In today’s fast-evolving technology landscape, Salesforce, Inc. and Uber Technologies, Inc. represent two giants redefining customer experience and digital innovation. Both companies operate within the software application industry and share a Silicon Valley base, yet they focus on distinct but overlapping markets—Salesforce in customer relationship management and Uber in mobility and delivery services. This article will explore their strategies and performance to reveal which presents the most compelling investment opportunity for you.
Table of contents
Companies Overview
I will begin the comparison between Salesforce and Uber by providing an overview of these two companies and their main differences.
Salesforce Overview
Salesforce, Inc. specializes in customer relationship management technology, aiming to unite companies and customers globally. Its Customer 360 platform facilitates collaboration to deliver connected customer experiences. The company serves various industries by offering sales, service, marketing, commerce, analytics, and integration solutions. Headquartered in San Francisco, Salesforce employs over 76K people and is a major player in the software application industry.
Uber Overview
Uber Technologies, Inc. operates proprietary technology platforms connecting consumers with independent providers across ride-sharing, delivery, and freight logistics. It serves multiple regions worldwide, including the Americas, Europe, and Asia Pacific. Uber’s three main segments—Mobility, Delivery, and Freight—offer diverse transportation and delivery services. Based in San Francisco, Uber employs about 31K staff and focuses on transforming urban mobility and logistics.
Key similarities and differences
Both Salesforce and Uber operate in the technology sector with a focus on software applications, though their business models differ. Salesforce primarily provides cloud-based CRM and enterprise software solutions, while Uber delivers technology-enabled transportation and delivery services. Each leverages proprietary platforms to connect users and providers but targets distinct markets: Salesforce focuses on business clients, whereas Uber serves individual consumers and logistics partners.
Income Statement Comparison
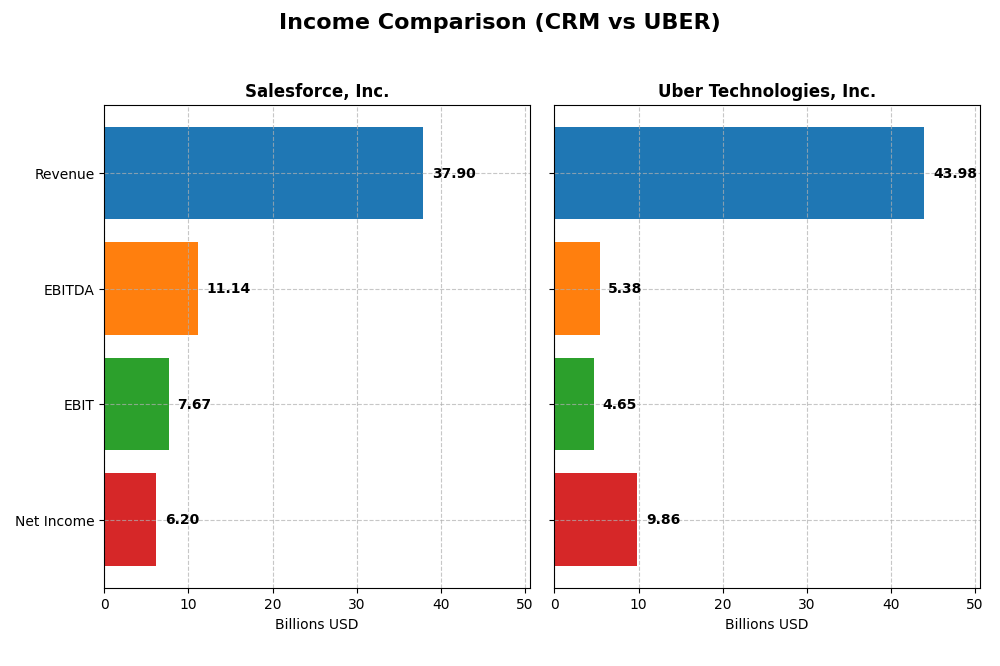
The following table presents a side-by-side comparison of key income statement metrics for Salesforce, Inc. and Uber Technologies, Inc. based on their most recent fiscal year results.
| Metric | Salesforce, Inc. (CRM) | Uber Technologies, Inc. (UBER) |
|---|---|---|
| Market Cap | 219B | 174B |
| Revenue | 37.9B | 43.98B |
| EBITDA | 11.14B | 5.39B |
| EBIT | 7.67B | 4.65B |
| Net Income | 6.20B | 9.81B |
| EPS | 6.44 | 4.71 |
| Fiscal Year | 2025 | 2024 |
Income Statement Interpretations
Salesforce, Inc.
Salesforce exhibited consistent revenue growth from 21B in 2021 to nearly 38B in 2025, with net income rising notably from 4.07B in 2021 to 6.2B in 2025. Margins remained robust, with a favorable gross margin of 77.19% and net margin at 16.35%. The latest year saw revenue growth slow moderately to 8.7%, while net margin and EPS growth accelerated, reflecting improved operational efficiency.
Uber Technologies, Inc.
Uber’s revenue surged from 11.1B in 2020 to 44B in 2024, with net income turning positive and reaching approximately 9.8B in 2024 from a negative 6.8B in 2020. Margins improved steadily, with a 39.4% gross margin and a strong net margin of 22.41% in 2024. The latest year demonstrated accelerated revenue growth of 18% and exceptional net margin and EPS expansion, indicating a solid turnaround and profitability momentum.
Which one has the stronger fundamentals?
Both companies show favorable income statement trends, but Uber’s growth rates and margin improvements are more pronounced, reflecting a more dynamic recovery and profitability gain. Salesforce maintains higher gross margins and stable profitability but with slower recent revenue growth. The fundamental strength varies by focus: Salesforce excels in margin stability, while Uber leads in growth and margin expansion.
Financial Ratios Comparison
The table below presents a side-by-side comparison of key financial ratios for Salesforce, Inc. (CRM) and Uber Technologies, Inc. (UBER) based on their most recent fiscal year data for 2025 (CRM) and 2024 (UBER).
| Ratios | Salesforce, Inc. (CRM) 2025 | Uber Technologies, Inc. (UBER) 2024 |
|---|---|---|
| ROE | 10.1% | 45.7% |
| ROIC | 7.9% | 6.8% |
| P/E | 53.0 | 12.8 |
| P/B | 5.37 | 5.86 |
| Current Ratio | 1.06 | 1.07 |
| Quick Ratio | 1.06 | 1.07 |
| D/E (Debt-to-Equity) | 0.19 | 0.53 |
| Debt-to-Assets | 11.1% | 22.3% |
| Interest Coverage | 26.5 | 5.35 |
| Asset Turnover | 0.37 | 0.86 |
| Fixed Asset Turnover | 7.03 | 14.1 |
| Payout ratio | 24.8% | 0% |
| Dividend yield | 0.47% | 0% |
Interpretation of the Ratios
Salesforce, Inc.
Salesforce displays a mix of strong and weak ratios, with favorable net margin (16.35%) and solid debt management, including a low debt-to-equity ratio (0.19) and strong interest coverage (28.18). However, valuation metrics like PE (53.04) and PB (5.37) are unfavorable, indicating a potentially high price relative to earnings and book value. The company pays dividends, but the dividend yield is low at 0.47%, which might concern income-focused investors.
Uber Technologies, Inc.
Uber shows generally favorable profitability ratios, including a high net margin (22.41%) and exceptional return on equity (45.72%). The company’s valuation looks more reasonable with a favorable PE of 12.82, though its price-to-book ratio remains high at 5.86. Uber does not pay dividends, likely prioritizing reinvestment and growth, supported by favorable liquidity and debt ratios, with a current ratio of 1.07 and debt-to-assets at 22.32%.
Which one has the best ratios?
Both companies exhibit slightly favorable overall financial ratios, but Uber’s stronger profitability and more attractive valuation metrics set it apart. Salesforce’s higher leverage and weaker valuation ratios contrast with Uber’s more balanced profile, although Uber’s dividend absence reflects a different capital allocation strategy. The choice depends on investor priorities regarding growth, income, and valuation risk.
Strategic Positioning
This section compares the strategic positioning of Salesforce and Uber, focusing on market position, key segments, and exposure to technological disruption:
Salesforce, Inc.
- Leading CRM software provider with strong presence in enterprise technology, facing competition in software applications.
- Diverse revenue streams: Sales Cloud, Service Cloud, Marketing, Commerce, Integration, Analytics, and Professional Services.
- Faces technological disruption through evolving cloud and AI technologies impacting software and analytics solutions.
Uber Technologies, Inc.
- Major player in mobility and delivery services, competing in global ride-sharing and logistics markets.
- Revenue driven by three segments: Mobility, Delivery, and Freight, leveraging proprietary technology platforms.
- Exposure to disruption from autonomous vehicles, delivery innovations, and evolving on-demand service platforms.
Salesforce, Inc. vs Uber Technologies, Inc. Positioning
Salesforce has a diversified business model across multiple software and cloud services, offering stability but facing broad competition. Uber’s focus on mobility and delivery services is more concentrated, with opportunities tied closely to transportation and logistics innovation.
Which has the best competitive advantage?
Both companies have a slightly unfavorable moat status, shedding value but showing growing profitability trends. Neither demonstrates a clear economic moat advantage based on ROIC versus WACC evaluations for the recent periods analyzed.
Stock Comparison
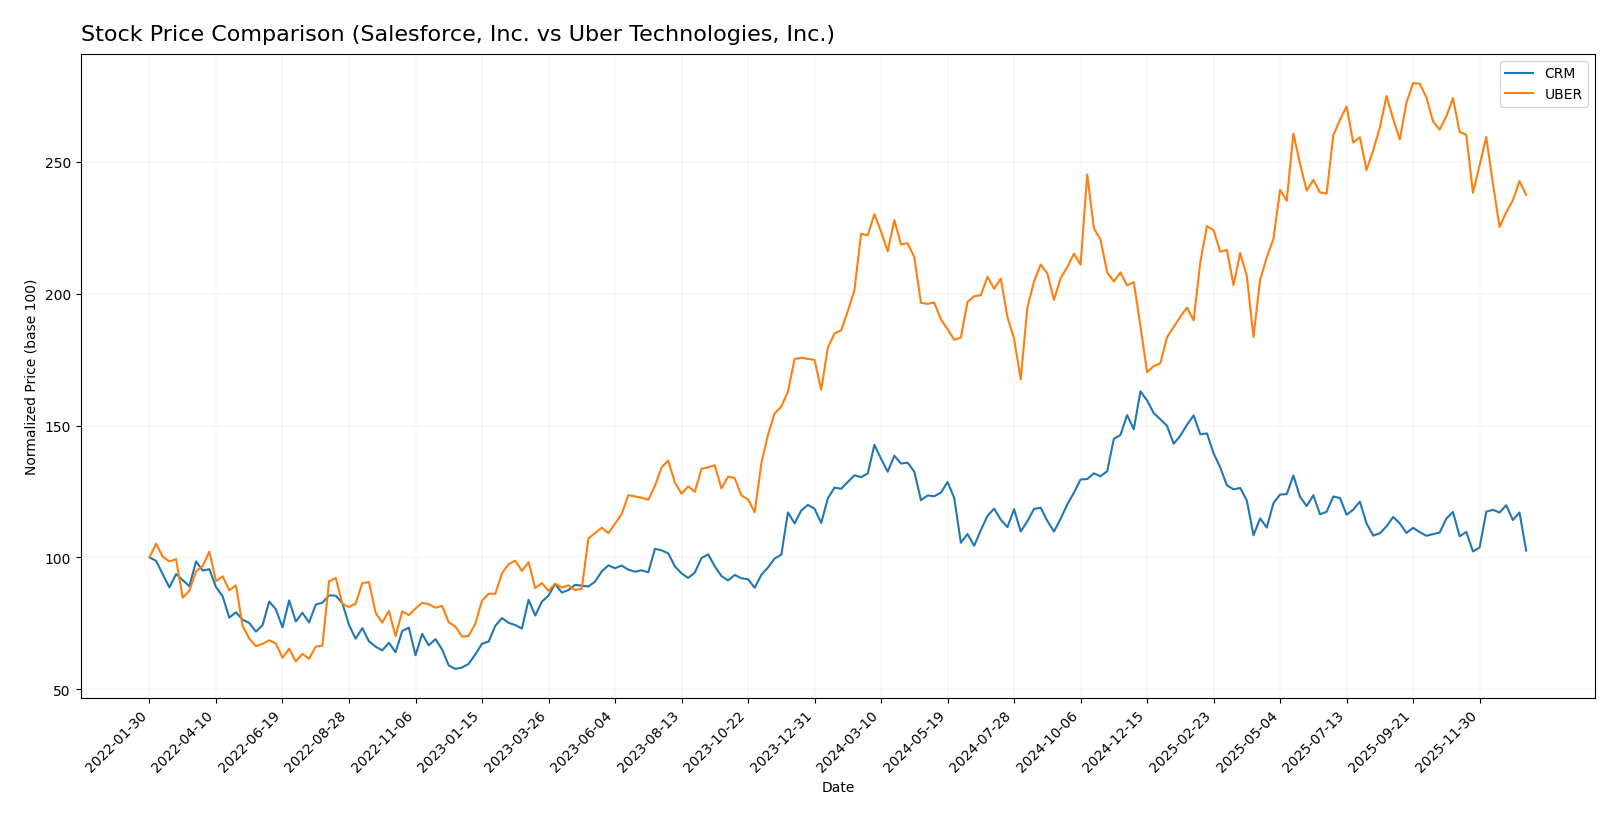
The stock prices of Salesforce, Inc. (CRM) and Uber Technologies, Inc. (UBER) have exhibited contrasting dynamics over the past 12 months, with CRM showing a significant downward acceleration and UBER a moderate upward trend with recent deceleration.
Trend Analysis
Salesforce, Inc. (CRM) experienced a bearish trend over the past year with a -22.16% price change, marked by accelerating decline and high volatility (31.81 std deviation). The stock hit a high of 361.99 and a low of 227.11.
Uber Technologies, Inc. (UBER) showed a bullish trend over the same period, rising 6.92% with decelerating growth and lower volatility (10.28 std deviation). Its price ranged between 58.99 and 98.51, though recent months reveal a negative short-term slope.
Comparing both, UBER delivered the highest market performance over the last year with positive gains, while CRM posted a pronounced negative return with accelerated decline.
Target Prices
The consensus target prices for Salesforce, Inc. and Uber Technologies, Inc. reflect moderate optimism from analysts.
| Company | Target High | Target Low | Consensus |
|---|---|---|---|
| Salesforce, Inc. | 400 | 250 | 324.17 |
| Uber Technologies, Inc. | 140 | 73 | 111.26 |
Analysts expect Salesforce’s stock to appreciate well above its current price of 229.10 USD, indicating significant upside potential. Uber’s consensus target price also suggests a notable increase from its current 83.67 USD, reflecting positive growth expectations.
Analyst Opinions Comparison
This section compares analysts’ ratings and grades for Salesforce, Inc. and Uber Technologies, Inc.:
Rating Comparison
Salesforce, Inc. Rating
- Rating: B+, considered very favorable by analysts.
- Discounted Cash Flow Score: 4, indicating favorable valuation.
- ROE Score: 4, reflecting favorable profit generation from equity.
- ROA Score: 4, signaling favorable asset utilization.
- Debt To Equity Score: 3, a moderate financial risk level.
- Overall Score: 3, a moderate overall financial standing.
Uber Technologies, Inc. Rating
- Rating: B, also regarded as very favorable overall.
- Discounted Cash Flow Score: 1, showing very unfavorable valuation.
- ROE Score: 5, demonstrating very favorable equity profit efficiency.
- ROA Score: 5, indicating very favorable asset earnings efficiency.
- Debt To Equity Score: 2, representing moderate but slightly stronger balance sheet.
- Overall Score: 3, also a moderate overall financial standing.
Which one is the best rated?
Based strictly on the provided data, Salesforce holds a slightly higher overall rating (B+ vs. B) and a more favorable discounted cash flow score, while Uber outperforms in profitability metrics (ROE and ROA). Both have moderate overall scores but differ in valuation and financial structure.
Scores Comparison
Here is a comparison of the Altman Z-Score and Piotroski Score for Salesforce and Uber Technologies:
Salesforce Scores
- Altman Z-Score: 5.26, indicating a safe financial zone with low bankruptcy risk.
- Piotroski Score: 7, classified as strong financial health.
Uber Scores
- Altman Z-Score: 4.44, also in the safe zone with low bankruptcy risk.
- Piotroski Score: 6, considered average financial strength.
Which company has the best scores?
Salesforce has higher scores in both Altman Z-Score and Piotroski Score compared to Uber, indicating stronger financial stability and health based on the provided data.
Grades Comparison
Here is the comparison of recent grades from reputable grading companies for both Salesforce, Inc. and Uber Technologies, Inc.:
Salesforce, Inc. Grades
The following table summarizes recent grades assigned to Salesforce, Inc. by major financial institutions:
| Grading Company | Action | New Grade | Date |
|---|---|---|---|
| Barclays | Maintain | Overweight | 2026-01-12 |
| RBC Capital | Maintain | Sector Perform | 2026-01-05 |
| Morgan Stanley | Maintain | Overweight | 2025-12-09 |
| Citigroup | Maintain | Neutral | 2025-12-08 |
| DA Davidson | Maintain | Neutral | 2025-12-05 |
| Citizens | Maintain | Market Outperform | 2025-12-04 |
| Deutsche Bank | Maintain | Buy | 2025-12-04 |
| Wedbush | Maintain | Outperform | 2025-12-04 |
| Northland Capital Markets | Maintain | Market Perform | 2025-12-04 |
| Canaccord Genuity | Maintain | Buy | 2025-12-04 |
Salesforce’s grades primarily indicate optimism, with several “Buy,” “Overweight,” and “Outperform” ratings maintained by leading analysts.
Uber Technologies, Inc. Grades
The following table presents recent grades assigned to Uber Technologies, Inc. by respected grading firms:
| Grading Company | Action | New Grade | Date |
|---|---|---|---|
| BTIG | Maintain | Buy | 2026-01-15 |
| Wells Fargo | Maintain | Overweight | 2026-01-08 |
| Cantor Fitzgerald | Maintain | Overweight | 2026-01-08 |
| Wolfe Research | Maintain | Outperform | 2026-01-06 |
| Wedbush | Maintain | Neutral | 2025-12-19 |
| Morgan Stanley | Maintain | Overweight | 2025-12-08 |
| Arete Research | Upgrade | Buy | 2025-12-03 |
| Wells Fargo | Maintain | Overweight | 2025-11-05 |
| Guggenheim | Maintain | Buy | 2025-11-05 |
| DA Davidson | Maintain | Buy | 2025-11-05 |
Uber’s recent grades show consistent confidence with multiple “Buy,” “Overweight,” and “Outperform” ratings and one upgrade noted.
Which company has the best grades?
Both Salesforce and Uber share a consensus “Buy” rating, but Salesforce has a higher count of “Strong Buy” ratings (2 vs. 1). However, Uber shows a more frequent presence of “Overweight” and upgrades. This suggests both companies are favorably viewed with slightly differing analyst emphasis, potentially affecting investor sentiment depending on grade distribution and stability.
Strengths and Weaknesses
Below is a comparative overview of key strengths and weaknesses of Salesforce, Inc. (CRM) and Uber Technologies, Inc. (UBER) based on the most recent financial and strategic data.
| Criterion | Salesforce, Inc. (CRM) | Uber Technologies, Inc. (UBER) |
|---|---|---|
| Diversification | Highly diversified with multiple cloud segments: Service Cloud ($9.05B), Sales Cloud ($8.32B), and Platform & Analytics growing steadily. | Diversified across Mobility ($25.09B), Delivery ($13.75B), and Freight ($5.14B); Mobility is dominant but other segments growing. |
| Profitability | Moderate net margin at 16.35%, ROIC slightly below WACC, indicating value destruction but improving profitability trend. | Higher net margin at 22.41%, strong ROE at 45.72%, ROIC below WACC but improving, signaling increasing profitability. |
| Innovation | Strong investment in integration and analytics; steady growth in Salesforce Platform and other new offerings. | Investments in technology programs and freight segment, enhancing competitive capabilities in mobility and delivery. |
| Global presence | Extensive global footprint with broad cloud service adoption across industries. | Global operations with major presence in urban mobility, delivery, and freight logistics worldwide. |
| Market Share | Leading CRM market player with expanding cloud services portfolio. | Significant share in ride-hailing and delivery markets, facing competition but maintaining strong brand recognition. |
Key takeaways: Both companies show strengths in diversification and innovation with growing profitability trends. Salesforce leads in cloud service diversification, while Uber excels in mobility and delivery scale. However, both are currently shedding value, requiring cautious investment consideration.
Risk Analysis
Below is a comparison of key risks for Salesforce, Inc. (CRM) and Uber Technologies, Inc. (UBER) based on the latest available data from 2025 and 2024.
| Metric | Salesforce, Inc. (CRM) | Uber Technologies, Inc. (UBER) |
|---|---|---|
| Market Risk | Beta 1.27 indicates moderate volatility; high P/E (53.04) suggests sensitivity to market sentiment | Beta 1.20, slightly lower volatility; more favorable P/E (12.82) reduces market valuation risk |
| Debt level | Low debt-to-equity (0.19), strong interest coverage (28.18x) signals low financial risk | Moderate debt-to-equity (0.53), decent interest coverage (8.89x), manageable but higher leverage |
| Regulatory Risk | Moderate, given global software/data privacy regulations but stable sector | High, due to ride-sharing and delivery regulation complexities worldwide |
| Operational Risk | Software platform reliance; risk mitigated by diversified service offerings | High operational complexity in mobility, delivery, and freight segments |
| Environmental Risk | Low direct environmental impact; focus on cloud infrastructure energy use | Moderate, due to vehicle emissions and logistics operations |
| Geopolitical Risk | Moderate, exposure through multinational customers and partners | Higher, with operations in diverse and sometimes unstable regions |
Salesforce’s key risks stem mainly from market valuation and evolving data privacy rules, but its strong balance sheet reduces financial risk. Uber faces more impactful operational and regulatory risks due to its global mobility business but benefits from improving profitability and manageable leverage. These factors should guide cautious allocation decisions.
Which Stock to Choose?
Salesforce, Inc. (CRM) shows favorable income evolution with strong revenue and profit growth, a slightly favorable global financial ratio profile, low debt levels, and a very favorable B+ rating. However, its ROIC is below WACC, indicating value destruction despite rising profitability.
Uber Technologies, Inc. (UBER) exhibits robust income growth and profitability, a slightly favorable ratio evaluation with higher net margin and ROE, moderate debt, and a very favorable B rating. Its ROIC also trails WACC, signaling value destruction but improving profitability.
For investors prioritizing growth and profitability improvements, Uber may appear more attractive due to higher margins and return on equity. Conversely, those focused on stable debt management and consistent income growth might view Salesforce as slightly more favorable. The final choice could depend on one’s risk tolerance and investment strategy.
Disclaimer: Investment carries a risk of loss of initial capital. The past performance is not a reliable indicator of future results. Be sure to understand risks before making an investment decision.
Go Further
I encourage you to read the complete analyses of Salesforce, Inc. and Uber Technologies, Inc. to enhance your investment decisions: