Salesforce, Inc. and Tyler Technologies, Inc. are two prominent players in the software application industry, each targeting distinct yet overlapping markets. Salesforce excels in customer relationship management and enterprise cloud solutions, while Tyler focuses on integrated software for the public sector. Both companies emphasize innovation to drive growth, making their comparison crucial for investors seeking robust technology investments. This article will help you identify which company offers the most compelling opportunity for your portfolio.
Table of contents
Companies Overview
I will begin the comparison between Salesforce and Tyler Technologies by providing an overview of these two companies and their main differences.
Salesforce Overview
Salesforce, Inc. is a leading provider of customer relationship management (CRM) technology, aiming to connect companies with their customers worldwide. Its Customer 360 platform enables businesses to deliver personalized and connected experiences through sales, service, marketing, commerce, and analytics solutions. Headquartered in San Francisco, Salesforce serves diverse industries including financial services and healthcare, employing over 76K people and boasting a market cap of 219B USD.
Tyler Technologies Overview
Tyler Technologies, Inc. specializes in integrated information management solutions for the public sector, offering software across financial management, judicial systems, public safety, tax, and education. Founded in 1966 and based in Plano, Texas, Tyler serves governments and schools with products that automate and streamline operations. The company employs about 7.5K people and has a market capitalization of 19B USD, with a strategic cloud collaboration with Amazon Web Services.
Key similarities and differences
Both Salesforce and Tyler Technologies operate in the software application industry with a focus on specialized software solutions. Salesforce targets broad commercial markets with CRM and analytics platforms, while Tyler focuses exclusively on public sector and government software needs. Salesforce has a significantly larger workforce and market cap, reflecting its global reach, whereas Tyler emphasizes integrated public administration and judicial solutions with more modest scale.
Income Statement Comparison
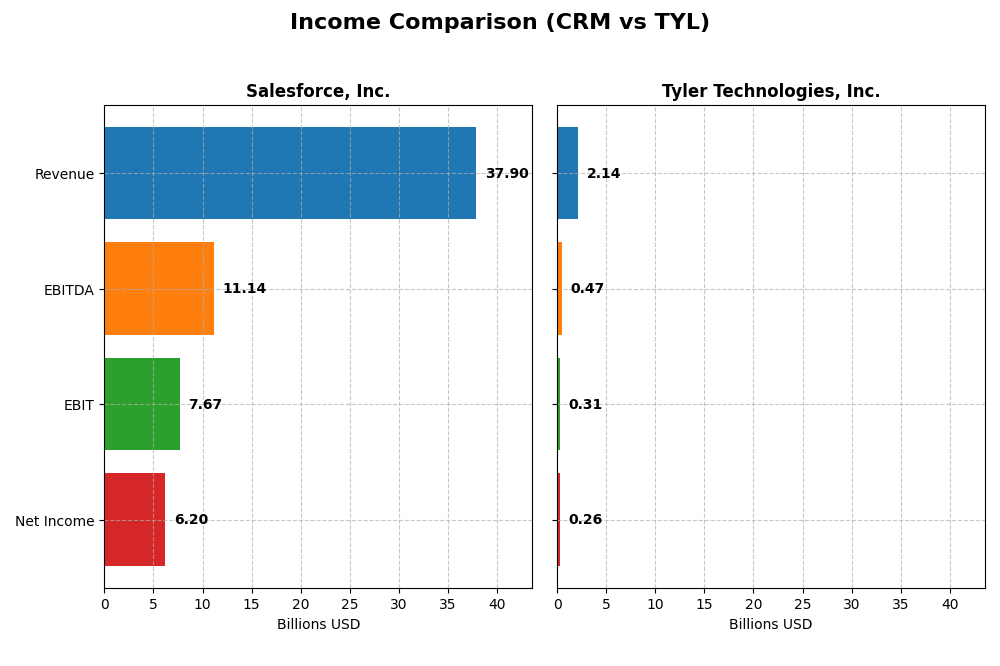
The table below presents a side-by-side comparison of key income statement metrics for Salesforce, Inc. and Tyler Technologies, Inc. based on their most recent fiscal year results.
| Metric | Salesforce, Inc. (CRM) | Tyler Technologies, Inc. (TYL) |
|---|---|---|
| Market Cap | 219B | 19B |
| Revenue | 37.9B | 2.14B |
| EBITDA | 11.1B | 466M |
| EBIT | 7.67B | 314M |
| Net Income | 6.20B | 263M |
| EPS | 6.44 | 6.17 |
| Fiscal Year | 2025 | 2024 |
Income Statement Interpretations
Salesforce, Inc.
Salesforce’s revenue grew steadily from $21.3B in 2021 to $37.9B in 2025, reflecting a 78.31% increase. Net income also rose from $4.07B to $6.20B over the same period. Margins remained strong, with a gross margin around 77%, while net margin showed some decline overall but improved significantly in the latest year, supported by an 8.72% revenue growth and a 37.82% net margin increase in 2025.
Tyler Technologies, Inc.
Tyler Technologies’ revenue expanded from $1.12B in 2020 to $2.14B in 2024, achieving a 91.45% growth. Net income grew from $195M to $263M during this period. Gross and net margins are favorable but notably lower than Salesforce, at about 41% and 12% respectively. The latest year saw a 9.53% revenue rise accompanied by a 44.73% net margin improvement, reflecting strong operational efficiency gains.
Which one has the stronger fundamentals?
Both Salesforce and Tyler Technologies demonstrate favorable income statement trends with robust revenue and net income growth. Salesforce leads in scale and margin levels, especially gross margin near 77%, while Tyler shows impressive percentage gains and operational efficiency improvements. Both have over 90% favorable metrics, though Salesforce’s larger size and margin advantage suggest stronger fundamentals by absolute measures.
Financial Ratios Comparison
The table below presents the most recent key financial ratios for Salesforce, Inc. (CRM) and Tyler Technologies, Inc. (TYL) based on their 2025 and 2024 fiscal year-end data respectively.
| Ratios | Salesforce, Inc. (CRM) 2025 | Tyler Technologies, Inc. (TYL) 2024 |
|---|---|---|
| ROE | 10.13% | 7.76% |
| ROIC | 7.95% | 6.20% |
| P/E | 53.04 | 93.42 |
| P/B | 5.37 | 7.25 |
| Current Ratio | 1.06 | 1.35 |
| Quick Ratio | 1.06 | 1.35 |
| D/E (Debt-to-Equity) | 0.19 | 0.19 |
| Debt-to-Assets | 11.07% | 12.32% |
| Interest Coverage | 26.49 | 50.50 |
| Asset Turnover | 0.37 | 0.41 |
| Fixed Asset Turnover | 7.03 | 10.95 |
| Payout Ratio | 24.80% | 0% |
| Dividend Yield | 0.47% | 0% |
Interpretation of the Ratios
Salesforce, Inc.
Salesforce shows a mix of strong and weaker ratios; its net margin at 16.35% is favorable, but high P/E of 53.04 and P/B of 5.37 raise valuation concerns. The company maintains a low debt-to-equity ratio of 0.19 and strong interest coverage at 28.18, supporting financial stability. Salesforce pays dividends with a low 0.47% yield, indicating modest shareholder returns amid cautious payout sustainability.
Tyler Technologies, Inc.
Tyler Technologies exhibits generally favorable liquidity and solvency ratios, including a current ratio of 1.35 and debt-to-assets of 12.32%. Its net margin is healthy at 12.3%, but a high P/E of 93.42 and P/B of 7.25 suggest elevated valuation risks. The company does not pay dividends, likely reflecting a focus on reinvestment and growth, supported by strong interest coverage of 52.96.
Which one has the best ratios?
Both companies present slightly favorable overall ratios, with Tyler Technologies showing a higher proportion of favorable metrics, especially in liquidity and interest coverage. Salesforce benefits from stronger profitability and lower leverage concerns. Valuation multiples are elevated for both, but Tyler’s dividend absence contrasts with Salesforce’s modest yield, highlighting differing shareholder return approaches.
Strategic Positioning
This section compares the strategic positioning of Salesforce, Inc. and Tyler Technologies, Inc. regarding market position, key segments, and exposure to technological disruption:
Salesforce, Inc.
- Leading software application provider with strong competitive pressure in global CRM and cloud markets.
- Diverse segments including Sales, Service, Marketing Clouds, Platform, Analytics, and Commerce services.
- Exposed to rapid innovation demands with integrated platforms like Slack and MuleSoft enhancing ecosystem.
Tyler Technologies, Inc.
- Smaller market cap with focused competition in public sector software and specialized government solutions.
- Concentrated on public sector software including enterprise, appraisal, tax, and judicial management solutions.
- Faces moderate technological disruption, leveraging cloud partnerships such as AWS for hosting and service delivery.
Salesforce, Inc. vs Tyler Technologies, Inc. Positioning
Salesforce adopts a diversified approach across multiple cloud and analytics segments, supporting broad industry applicability. Tyler Technologies concentrates on public sector niches, offering specialized software suites with focused market penetration but narrower diversification.
Which has the best competitive advantage?
Both companies are currently shedding value as ROIC is below WACC; however, Salesforce shows improving profitability trends, whereas Tyler’s profitability is declining, indicating Salesforce holds a slightly stronger competitive advantage based on MOAT evaluation.
Stock Comparison
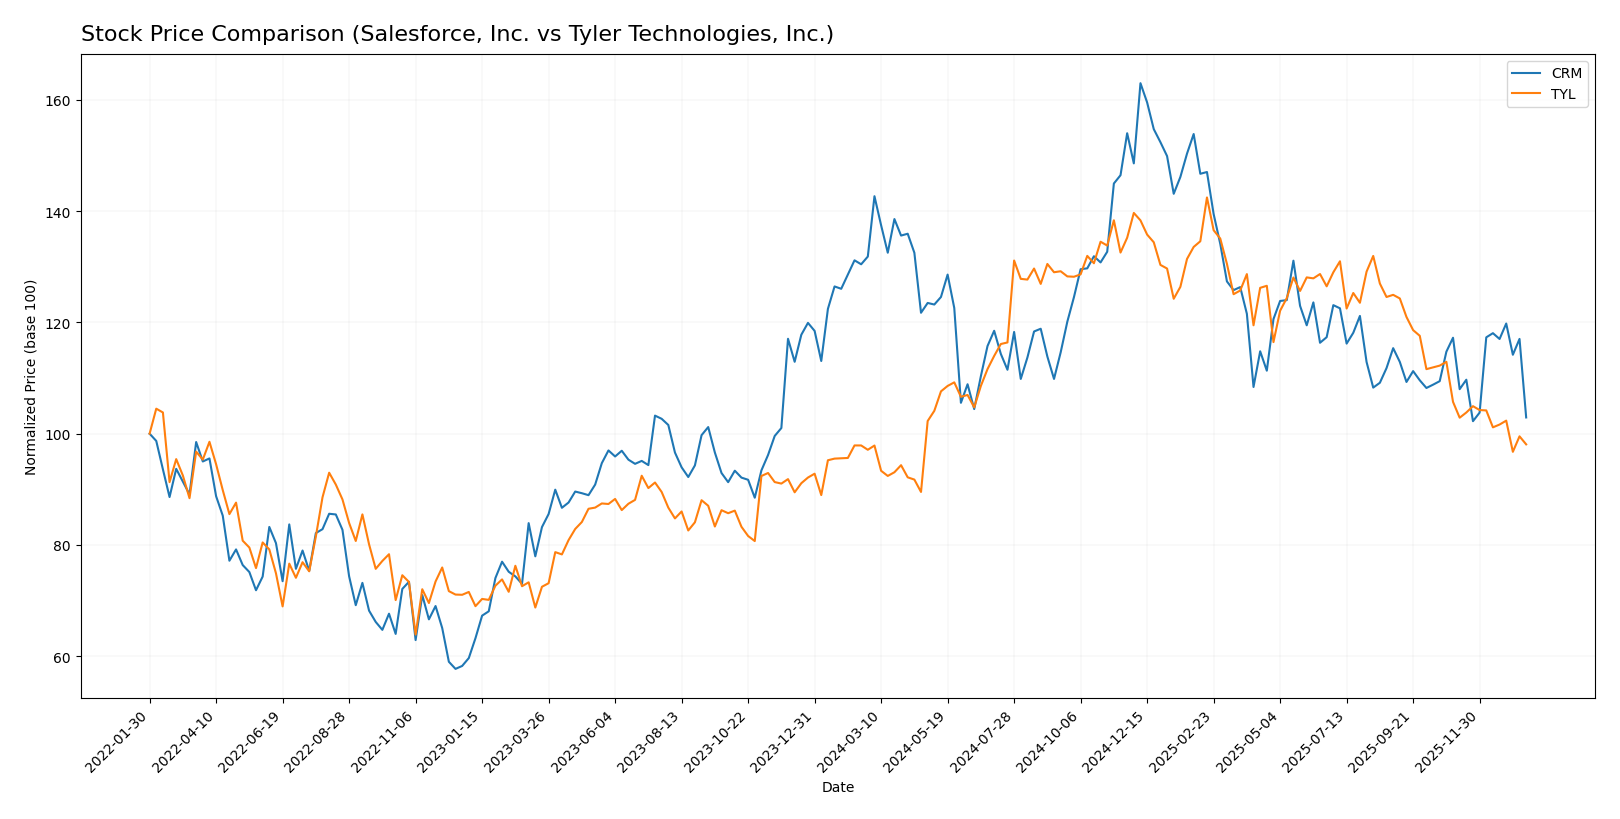
The stock prices of Salesforce, Inc. (CRM) and Tyler Technologies, Inc. (TYL) have exhibited distinct movements over the past 12 months, with CRM showing a notable decline and TYL maintaining relative stability amid varying trading volumes.
Trend Analysis
Salesforce, Inc. (CRM) experienced a bearish trend over the past year with a 21.93% price decline, marked by accelerating downward momentum and a high volatility level (std deviation 31.8). The recent period showed a smaller 12.22% drop, indicating slight deceleration.
Tyler Technologies, Inc. (TYL) posted a marginal 1.0% increase over the same period, classified as bullish but with decelerating momentum and higher overall volatility (std deviation 61.79). Recently, its trend turned negative with a 7.22% decline.
Comparatively, TYL delivered the highest market performance with a near-neutral annual price change, while CRM showed a significant bearish trend with a substantial loss in value.
Target Prices
The current analyst consensus points to considerable upside potential for both Salesforce, Inc. and Tyler Technologies, Inc.
| Company | Target High | Target Low | Consensus |
|---|---|---|---|
| Salesforce, Inc. | 400 | 250 | 324.17 |
| Tyler Technologies, Inc. | 675 | 470 | 584 |
Salesforce’s target consensus of 324.17 suggests a strong upside from its current price of 228.68 USD. Tyler Technologies shows even more bullish expectations with a consensus target of 584 versus a current price near 441.86 USD.
Analyst Opinions Comparison
This section compares analysts’ ratings and grades for Salesforce, Inc. and Tyler Technologies, Inc.:
Rating Comparison
Salesforce, Inc. Rating
- Rating: B+, evaluated as Very Favorable by analysts.
- Discounted Cash Flow Score: 4, indicating favorable valuation.
- ROE Score: 4, a favorable measure of profit efficiency.
- ROA Score: 4, strong asset utilization effectiveness.
- Debt To Equity Score: 3, moderate financial risk level.
- Overall Score: 3, a moderate summary of financial standing.
Tyler Technologies, Inc. Rating
- Rating: B, also considered Very Favorable by analysts.
- Discounted Cash Flow Score: 4, showing favorable valuation.
- ROE Score: 3, a moderate indicator of profit efficiency.
- ROA Score: 4, strong asset utilization effectiveness.
- Debt To Equity Score: 3, moderate financial risk level.
- Overall Score: 3, a moderate summary of financial standing.
Which one is the best rated?
Salesforce holds a slightly better overall rating at B+ compared to Tyler’s B, with stronger ROE performance. Both companies share similar DCF, ROA, debt levels, and overall moderate financial scores.
Scores Comparison
The following table compares the Altman Z-Score and Piotroski Score for Salesforce, Inc. and Tyler Technologies, Inc.:
Salesforce, Inc. Scores
- Altman Z-Score of 5.26 indicating a safe zone status.
- Piotroski Score of 7 reflecting strong financial health.
Tyler Technologies, Inc. Scores
- Altman Z-Score of 7.42 indicating a safe zone status.
- Piotroski Score of 6 reflecting average financial strength.
Which company has the best scores?
Tyler Technologies has a higher Altman Z-Score, suggesting stronger bankruptcy safety, while Salesforce has a better Piotroski Score, indicating stronger overall financial health based on provided data.
Grades Comparison
Here is a comparison of recent grades and ratings from recognized financial institutions for Salesforce, Inc. and Tyler Technologies, Inc.:
Salesforce, Inc. Grades
The following table summarizes the latest grades assigned by reputable grading companies for Salesforce, Inc.:
| Grading Company | Action | New Grade | Date |
|---|---|---|---|
| Barclays | Maintain | Overweight | 2026-01-12 |
| RBC Capital | Maintain | Sector Perform | 2026-01-05 |
| Morgan Stanley | Maintain | Overweight | 2025-12-09 |
| Citigroup | Maintain | Neutral | 2025-12-08 |
| DA Davidson | Maintain | Neutral | 2025-12-05 |
| Citizens | Maintain | Market Outperform | 2025-12-04 |
| Deutsche Bank | Maintain | Buy | 2025-12-04 |
| Wedbush | Maintain | Outperform | 2025-12-04 |
| Northland Capital Markets | Maintain | Market Perform | 2025-12-04 |
| Canaccord Genuity | Maintain | Buy | 2025-12-04 |
Overall, Salesforce maintains a generally positive rating trend, with multiple “Buy,” “Overweight,” and “Outperform” grades indicating steady confidence from analysts.
Tyler Technologies, Inc. Grades
The following table lists recent grades by recognized grading companies for Tyler Technologies, Inc.:
| Grading Company | Action | New Grade | Date |
|---|---|---|---|
| Piper Sandler | Maintain | Overweight | 2026-01-13 |
| Wells Fargo | Maintain | Equal Weight | 2026-01-08 |
| DA Davidson | Maintain | Neutral | 2025-12-09 |
| Evercore ISI Group | Maintain | In Line | 2025-10-31 |
| DA Davidson | Maintain | Neutral | 2025-10-31 |
| DA Davidson | Maintain | Neutral | 2025-10-10 |
| DA Davidson | Maintain | Neutral | 2025-08-05 |
| Barclays | Maintain | Overweight | 2025-07-31 |
| Needham | Maintain | Buy | 2025-05-13 |
| Barclays | Maintain | Overweight | 2025-04-25 |
Tyler Technologies shows a more mixed but positive trend, with ratings ranging from “Neutral” to “Overweight” and “Buy,” reflecting cautious optimism among analysts.
Which company has the best grades?
Salesforce, Inc. has received a higher volume of strong positive ratings, including multiple “Buy” and “Outperform” grades, compared to Tyler Technologies, Inc., whose ratings are more balanced between “Neutral” and “Overweight.” This suggests Salesforce may be currently viewed with greater confidence, potentially influencing investor sentiment towards stronger expected performance.
Strengths and Weaknesses
Below is a comparative overview of key strengths and weaknesses for Salesforce, Inc. (CRM) and Tyler Technologies, Inc. (TYL) based on the latest financial and operational data.
| Criterion | Salesforce, Inc. (CRM) | Tyler Technologies, Inc. (TYL) |
|---|---|---|
| Diversification | Highly diversified across multiple cloud services, including Sales, Service, Marketing, and Integration with revenues exceeding $5B in several segments | Less diversified, primarily focused on public sector software and related services, with dominant revenue from SaaS and transaction fees |
| Profitability | Moderate net margin at 16.35%, ROIC near WACC but improving; slightly unfavorable moat due to value shedding but growing profitability | Moderate net margin at 12.3%, ROIC below WACC and declining; very unfavorable moat indicating value destruction with decreasing profitability |
| Innovation | Strong innovation with expanding cloud platforms and analytics; consistent revenue growth across segments | Moderate innovation focused on specialized government software; growth more limited and concentrated |
| Global presence | Extensive global reach with strong brand recognition in enterprise cloud solutions | Primarily US-focused with limited international exposure |
| Market Share | Leading market share in CRM and cloud services, supported by strong platform ecosystem | Niche leader in government software markets but smaller overall market footprint |
Key takeaways: Salesforce demonstrates a well-diversified product portfolio and global reach with improving profitability trends despite current value shedding. Tyler Technologies operates in a niche market with focused offerings but faces challenges in profitability and growth, reflected in a declining ROIC and more limited diversification. Both companies have slightly favorable financial ratios, but Salesforce’s broader innovation and market presence offer a stronger long-term proposition.
Risk Analysis
Below is a comparison of key risks for Salesforce, Inc. (CRM) and Tyler Technologies, Inc. (TYL) based on the most recent data available.
| Metric | Salesforce, Inc. (CRM) | Tyler Technologies, Inc. (TYL) |
|---|---|---|
| Market Risk | High beta of 1.27 indicates higher volatility and sensitivity to market swings. | Lower beta of 0.92 suggests less market volatility risk. |
| Debt level | Low debt-to-equity ratio (0.19) and favorable interest coverage (28.18) indicate manageable debt. | Similarly low debt-to-equity (0.19) with even stronger interest coverage (52.96). |
| Regulatory Risk | Moderate, due to global operations and data privacy regulations in tech sector. | Moderate, focused on US public sector with compliance demands. |
| Operational Risk | Large workforce (76K) and complex cloud services pose operational scale challenges. | Smaller scale (7.5K employees) but reliant on government contracts and cloud partnerships. |
| Environmental Risk | Moderate, tech sector has low direct emissions but increasing scrutiny on sustainability. | Moderate, similar low direct emissions but subject to public sector environmental mandates. |
| Geopolitical Risk | Exposure to global markets increases risk amid geopolitical tensions. | Primarily US-focused, less exposed internationally. |
Salesforce’s higher market risk and global exposure are the most impactful risks, while Tyler benefits from lower market volatility and stronger interest coverage but faces challenges in government contract dependencies. Both show solid debt management reducing financial distress risk.
Which Stock to Choose?
Salesforce, Inc. (CRM) shows a favorable income evolution with strong revenue and net income growth, supported by a slightly favorable financial ratios profile. Profitability is solid with a 16.35% net margin, low debt levels, and a very favorable rating of B+. However, its MOAT evaluation suggests the company is currently shedding value despite improving profitability.
Tyler Technologies, Inc. (TYL) also displays favorable income growth and a slightly better ratio profile, with a 12.3% net margin and low debt. Its rating is very favorable at B, though slightly below CRM, and the MOAT evaluation is very unfavorable, indicating value destruction with declining profitability over recent years.
Investors focused on growth and improving profitability might find Salesforce’s profile more appealing given its favorable income growth and rating. Conversely, those prioritizing a slightly stronger ratio profile and safer financial scores might consider Tyler Technologies, despite its less favorable MOAT trend. The choice could depend on the investor’s risk tolerance and strategic focus.
Disclaimer: Investment carries a risk of loss of initial capital. The past performance is not a reliable indicator of future results. Be sure to understand risks before making an investment decision.
Go Further
I encourage you to read the complete analyses of Salesforce, Inc. and Tyler Technologies, Inc. to enhance your investment decisions: