Home > Comparison > Technology > CRM vs MSTR
The strategic rivalry between Salesforce, Inc. and Strategy Inc defines the current trajectory of the technology sector. Salesforce operates as a market-leading provider of customer relationship management software with broad enterprise applications. In contrast, Strategy Inc blends bitcoin treasury management with AI-powered analytics software, targeting niche innovation. This analysis will determine which company’s operational model delivers superior risk-adjusted returns for a diversified portfolio in today’s dynamic tech landscape.
Table of contents
Companies Overview
Salesforce and Strategy Inc dominate their niches in the evolving software application market, shaping how enterprises operate digitally.
Salesforce, Inc.: Global CRM Innovator
Salesforce leads in customer relationship management technology, generating revenue through its Customer 360 platform and a suite of services including Sales, Service, Marketing, Commerce, Tableau analytics, and MuleSoft integration. In 2026, it focuses on enhancing connected customer experiences and expanding its flexible platform for custom app development across industries.
Strategy Inc: Bitcoin Treasury Pioneer & AI Analytics Provider
Strategy Inc positions itself as a bitcoin treasury company while offering AI-powered enterprise analytics software. It monetizes through securities linked to Bitcoin exposure and its Strategy One and Strategy Mosaic analytics platforms. The 2026 strategy centers on integrating advanced AI insights for enterprises and expanding economic exposure to digital assets internationally.
Strategic Collision: Similarities & Divergences
Both companies leverage software innovation but diverge sharply: Salesforce builds a closed ecosystem for customer engagement, while Strategy Inc blends open AI analytics with cryptocurrency exposure. Their primary battleground is enterprise digital transformation and data-driven decision-making. Investment profiles differ markedly—Salesforce offers stability with broad industry reach; Strategy Inc embodies higher volatility tied to crypto markets and AI growth potential.
Income Statement Comparison
The following data dissects the core profitability and scalability of both corporate engines to reveal who dominates the bottom line:
| Metric | Salesforce, Inc. (CRM) | Strategy Inc (MSTR) |
|---|---|---|
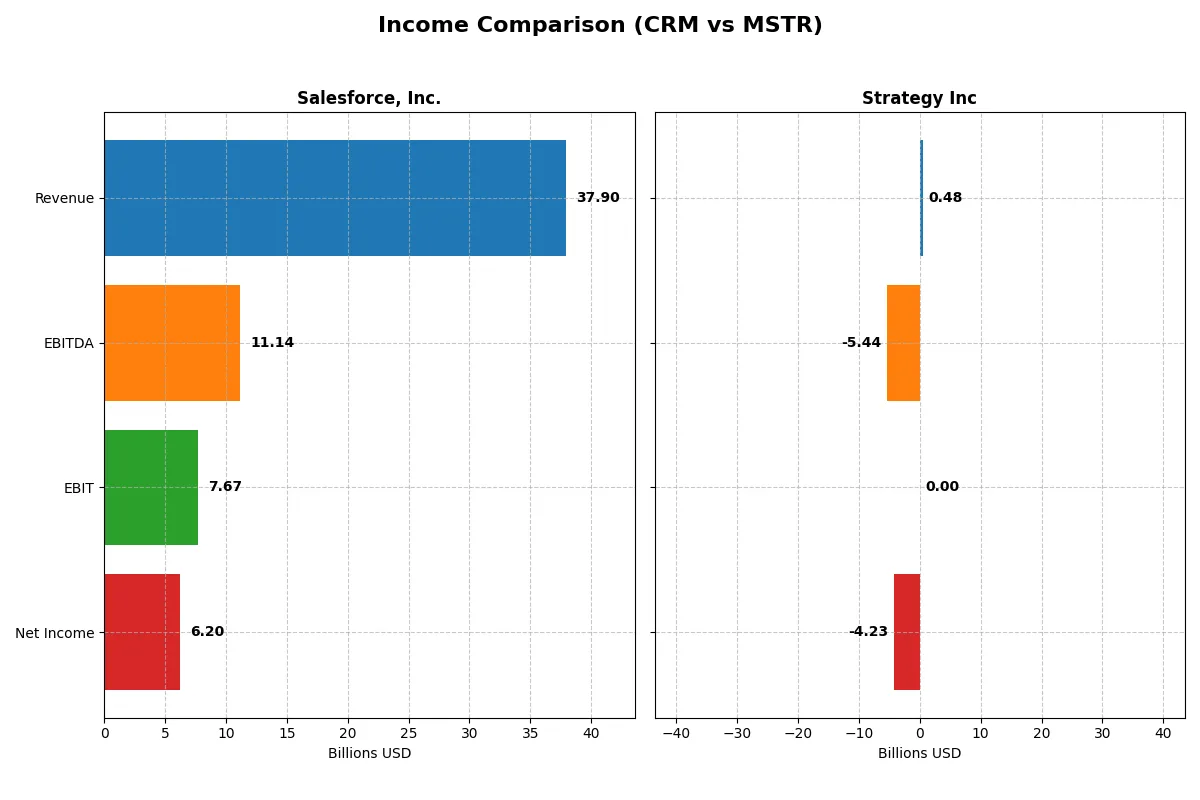
| Revenue | 37.9B | 477M |
| Cost of Revenue | 8.6B | 149M |
| Operating Expenses | 22.0B | 5.6B |
| Gross Profit | 29.3B | 328M |
| EBITDA | 11.1B | -5.4B |
| EBIT | 7.7B | 0 |
| Interest Expense | 272M | -65M |
| Net Income | 6.2B | -4.2B |
| EPS | 6.44 | -15.23 |
| Fiscal Year | 2025 | 2025 |
Income Statement Analysis: The Bottom-Line Duel
This income statement comparison exposes which company runs its business with superior efficiency and financial discipline.
Salesforce, Inc. Analysis
Salesforce’s revenue surged from 21.3B in 2021 to nearly 38B in 2025, with net income climbing from 4.07B to 6.2B. Its gross margin stands robust at 77.2%, reflecting strong cost control. The net margin of 16.4% and a 27.8% EBIT growth in 2025 highlight accelerating operational momentum and efficiency gains.
Strategy Inc Analysis
Strategy Inc’s revenue remained under 500M, slightly declining over five years. The company struggles with negative net income, hitting -4.23B in 2025 and a severely negative net margin of -886%. Despite a one-year EBIT improvement, overall profitability and efficiency deteriorate, signaling persistent fundamental challenges.
Verdict: Growth Efficiency vs. Structural Losses
Salesforce dominates with strong revenue growth, expanding margins, and solid profitability, while Strategy Inc contends with shrinking revenue and deep losses. Salesforce’s profile appeals to investors seeking durable earnings growth and operational strength, contrasting Strategy’s risk-laden, loss-heavy trajectory.
Financial Ratios Comparison
These vital ratios act as a diagnostic tool to expose the underlying fiscal health, valuation premiums, and capital efficiency of the companies analyzed:
| Ratios | Salesforce, Inc. (CRM) | Strategy Inc (MSTR) |
|---|---|---|
| ROE | 10.1% | -6.4% |
| ROIC | 7.9% | -4.4% |
| P/E | 53.0 | -47.8 |
| P/B | 5.37 | 3.06 |
| Current Ratio | 1.06 | 0.71 |
| Quick Ratio | 1.06 | 0.71 |
| D/E | 0.19 | 0.40 |
| Debt-to-Assets | 11.1% | 28.1% |
| Interest Coverage | 26.5 | -29.9 |
| Asset Turnover | 0.37 | 0.02 |
| Fixed Asset Turnover | 7.03 | 5.73 |
| Payout ratio | 24.8% | 0% |
| Dividend yield | 0.47% | 0% |
| Fiscal Year | 2025 | 2024 |
Efficiency & Valuation Duel: The Vital Signs
Financial ratios serve as a company’s DNA, unveiling hidden risks and operational strengths crucial for informed investment decisions.
Salesforce, Inc.
Salesforce reports a solid net margin of 16.35% and a moderate ROE of 10.13%, reflecting decent profitability. However, its P/E of 53.04 signals an expensive valuation, stretched beyond typical sector averages. The firm returns value via a modest 0.47% dividend yield, indicating a preference to reinvest in growth and R&D.
Strategy Inc
Strategy Inc suffers from a deeply negative net margin of -251.73% and a -6.4% ROE, marking operational distress and poor profitability. Its P/E ratio is negative but flagged favorable due to valuation quirks. The company’s liquidity is weak, with a current ratio of 0.71, and it pays no dividends, likely focusing on restructuring or growth investments.
Premium Valuation vs. Operational Safety
Salesforce offers a more balanced risk-reward profile with stable profitability but at a premium price. Strategy Inc presents higher risk due to weak earnings and liquidity but trades at a lower valuation multiple. Investors seeking operational stability may favor Salesforce, while more risk-tolerant profiles might consider Strategy Inc’s turnaround potential.
Which one offers the Superior Shareholder Reward?
Salesforce (CRM) pays a modest 0.47% dividend yield with a sustainable 25% payout ratio, supported by robust 12.9B FCF and steady share buybacks. Strategy Inc (MSTR) pays no dividend, suffers negative free cash flow (-115B), and shows weak buyback activity amid operational losses. I find CRM’s balanced dividend and buyback model far more sustainable and rewarding for investors in 2026.
Comparative Score Analysis: The Strategic Profile
The radar chart reveals the fundamental DNA and trade-offs of Salesforce, Inc. and Strategy Inc, exposing their core financial strengths and vulnerabilities:
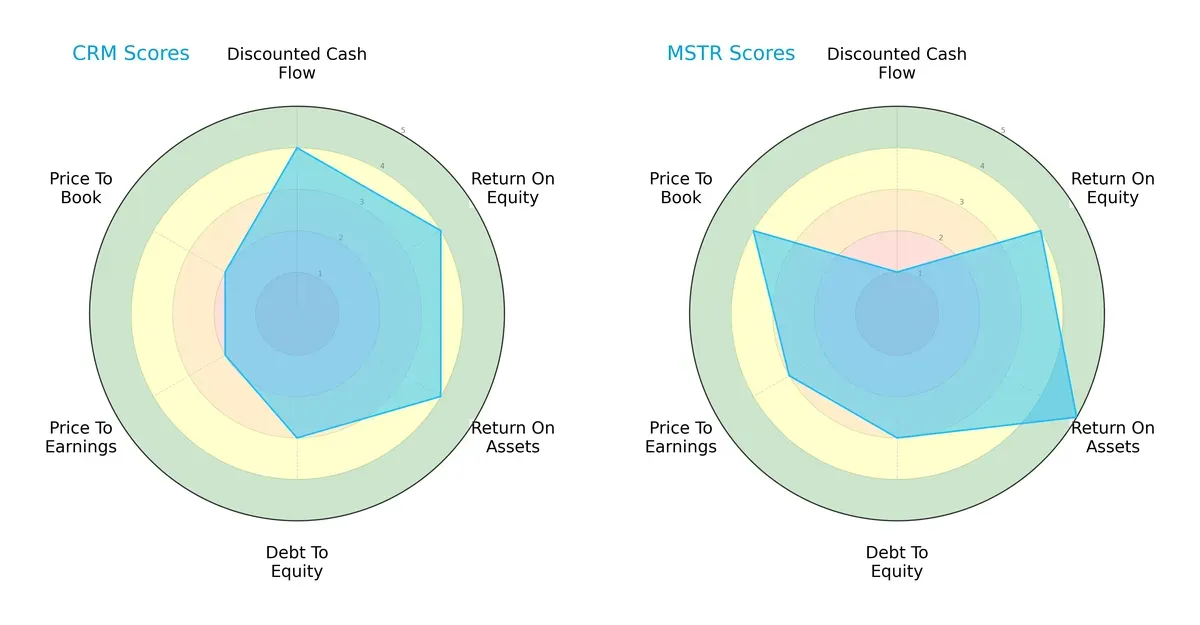
Salesforce demonstrates a balanced profile with solid DCF, ROE, and ROA scores, though its valuation metrics lag. Strategy Inc excels in asset efficiency and valuation but suffers from a weak DCF score. Salesforce relies on cash flow strength; Strategy Inc leans on operational efficiency and market valuation advantages.
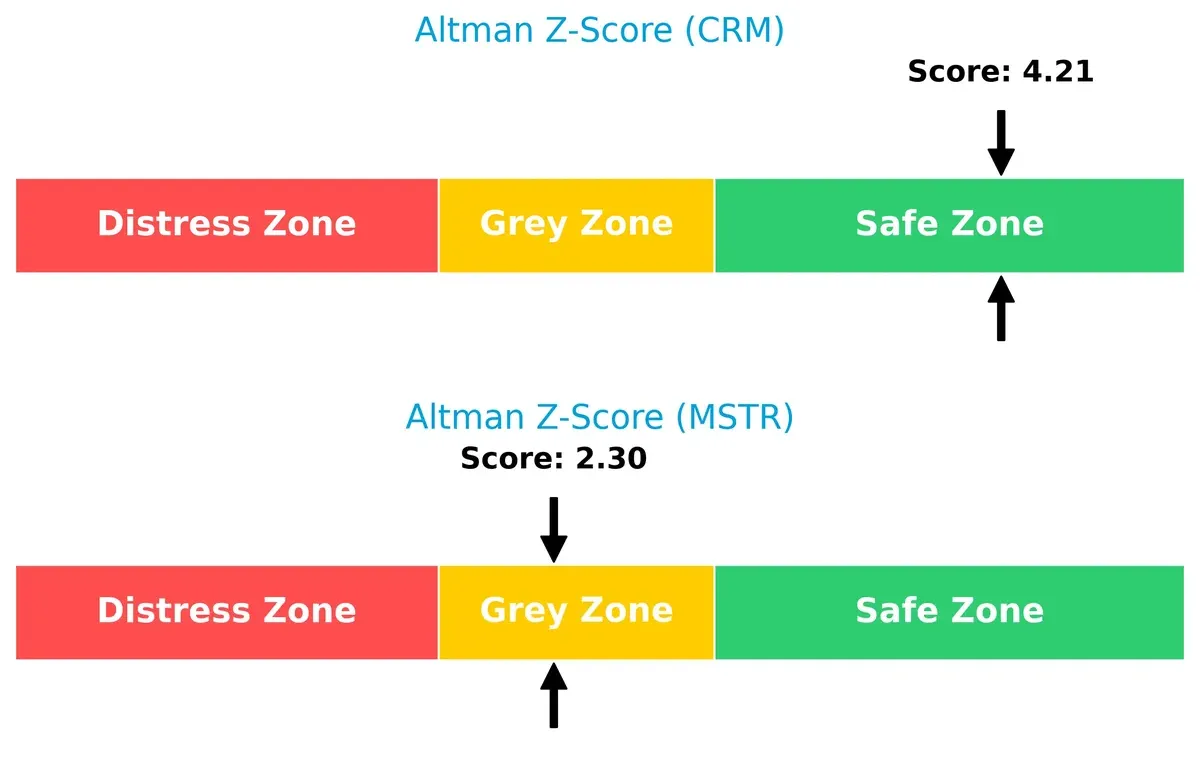
Bankruptcy Risk: Solvency Showdown
The Altman Z-Score delta shows Salesforce in the safe zone at 4.21, while Strategy Inc lingers in the grey zone at 2.30, revealing a higher bankruptcy risk for Strategy Inc in this cycle:
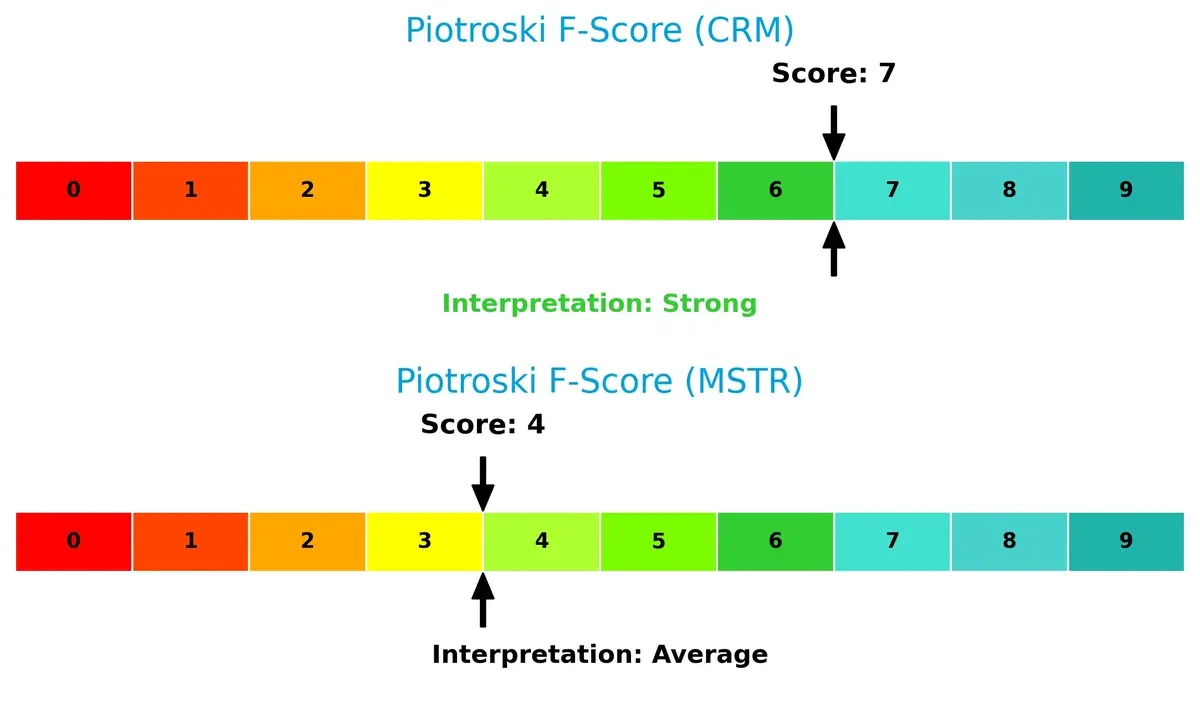
Financial Health: Quality of Operations
Salesforce posts a strong Piotroski F-Score of 7, signaling robust financial health. Strategy Inc’s average score of 4 flags potential internal weaknesses and operational risks:
How are the two companies positioned?
This section dissects the operational DNA of Salesforce and Strategy Inc by comparing their revenue distribution and internal dynamics. The goal is to confront their economic moats to identify the more resilient, sustainable competitive advantage in today’s market.
Revenue Segmentation: The Strategic Mix
The following visual comparison dissects how Salesforce, Inc. and Strategy Inc diversify their income streams and where their primary sector bets lie:
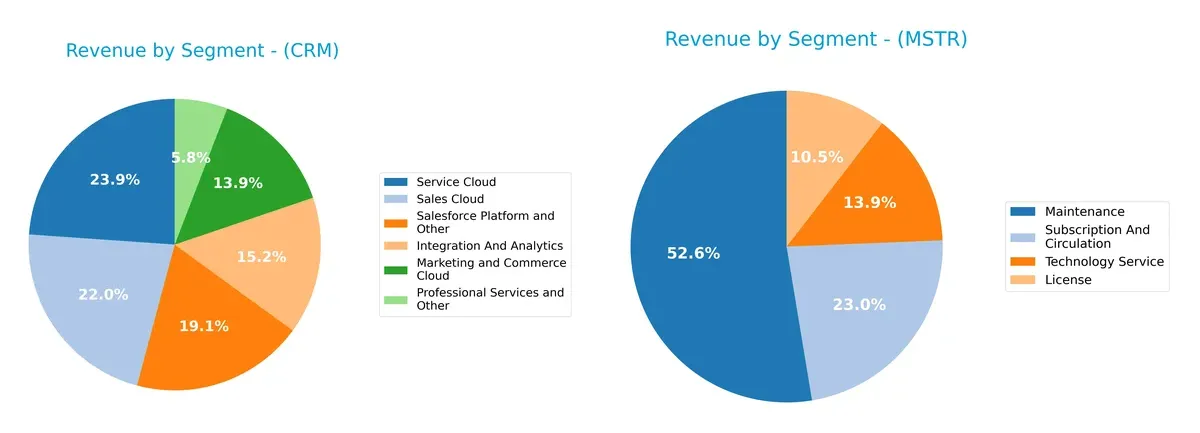
Salesforce, Inc. shows a well-balanced revenue mix, with Service Cloud leading at $9.05B, followed closely by Sales Cloud at $8.32B. Its six substantial segments reduce concentration risk and reinforce ecosystem lock-in. Strategy Inc relies heavily on Maintenance revenue at $244M, nearly four times its License income of $49M, indicating a narrower focus and potential vulnerability to subscription shifts. Salesforce’s diversification signals infrastructure dominance, while Strategy Inc pivots on service continuity.
Strengths and Weaknesses Comparison
This table compares the strengths and weaknesses of Salesforce, Inc. and Strategy Inc based on diversification, profitability, financials, innovation, global presence, and market share:
Salesforce, Inc. Strengths
- Diverse product segments including Sales Cloud and Service Cloud
- Favorable net margin at 16.35%
- Low debt-to-assets ratio at 11.07%
- Strong interest coverage at 28.18
- Global presence with significant Americas and Europe revenue
- High fixed asset turnover at 7.03
Strategy Inc Strengths
- Favorable price-to-earnings ratio despite negative net margin
- Moderate debt-to-assets ratio at 28.09%
- Favorable fixed asset turnover at 5.73
- Presence in North America and EMEA regions
- Maintains some diversification across licensing and subscription services
Salesforce, Inc. Weaknesses
- Unfavorable price-to-book ratio at 5.37
- Asset turnover is low at 0.37
- Dividend yield is minimal at 0.47%
- PE ratio high at 53.04 indicating expensive valuation
- ROIC below WACC at 7.95% vs. 9.39%
- Neutral current ratio at 1.06 indicating tight liquidity
Strategy Inc Weaknesses
- Negative net margin at -251.73% and negative ROE at -6.4%
- Unfavorable current and quick ratios at 0.71 indicating weak liquidity
- Negative interest coverage ratio
- Poor asset turnover at 0.02
- Unfavorable price-to-book ratio at 3.06
- No dividend yield and overall unfavorable financial ratios
Salesforce shows strength in diversified revenue streams and solid profitability metrics but faces valuation and efficiency challenges. Strategy Inc struggles with profitability and liquidity but retains some operational strengths in asset utilization and geographic presence. These factors will influence their strategic focus on financial health and market expansion.
The Moat Duel: Analyzing Competitive Defensibility
A structural moat is the only shield protecting long-term profits from relentless competitive erosion and market disruption:
Salesforce, Inc.: Network Effects and Platform Integration
Salesforce’s moat stems from powerful network effects and a broad platform ecosystem. Its high ROIC trend and margin stability reflect deep customer lock-in. Expansion into AI and global markets in 2026 should reinforce this advantage.
Strategy Inc: Niche Expertise and Data Analytics
Strategy Inc relies on specialized data analytics and Bitcoin treasury exposure, contrasting Salesforce’s broad platform. However, its declining ROIC and volatile margins weaken its moat. New AI tools offer growth potential but face fierce competition.
Ecosystem Scale vs. Specialized Data Analytics
Salesforce holds the deeper moat with expanding network effects and improving profitability. Strategy Inc’s niche positioning lacks scale and suffers profitability erosion. Salesforce is better positioned to defend and grow market share in 2026.
Which stock offers better returns?
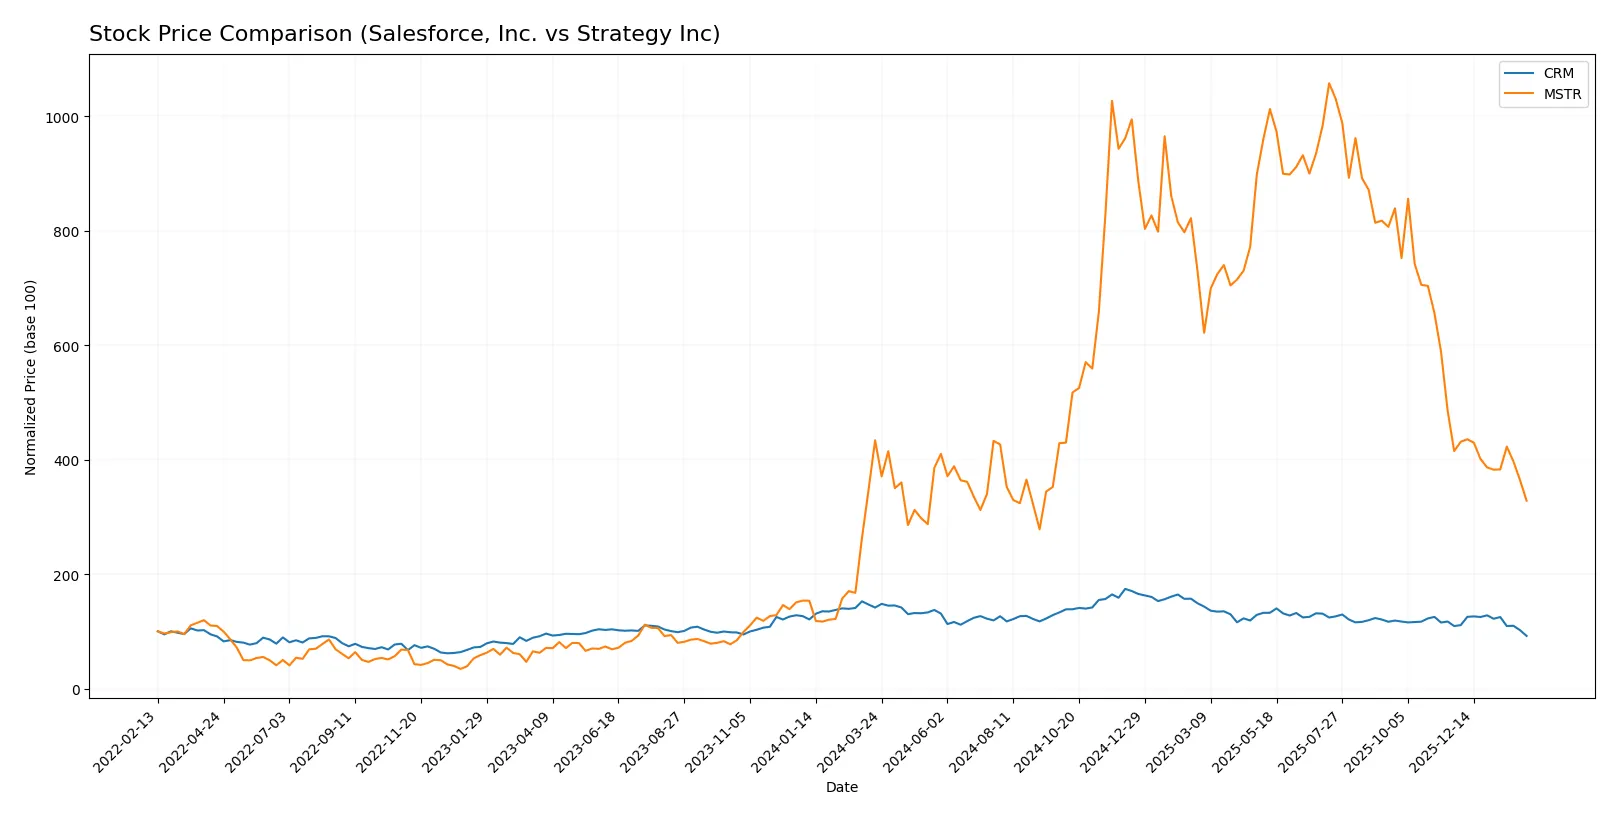
Over the past year, both Salesforce, Inc. and Strategy Inc experienced notable price declines with decelerating bearish trends, reflecting weakening momentum amid diverging trading volumes and buyer-seller dynamics.
Trend Comparison
Salesforce, Inc. shows a 35.0% price decline over the past 12 months, marking a bearish trend with decelerating downside momentum and a high volatility level of 33.28. The stock peaked at 361.99 and bottomed at 191.35.
Strategy Inc’s stock fell 24.3% over the same 12-month span, also bearish with deceleration. Volatility is significantly higher at 101.34, with a top price of 434.58 and a low of 114.3, indicating wider price swings.
Comparing both, Salesforce, Inc. suffered a larger percentage drop, delivering weaker market performance than Strategy Inc over the past year.
Target Prices
Analysts show a broad range of target prices, reflecting varied growth expectations for these technology firms.
| Company | Target Low | Target High | Consensus |
|---|---|---|---|
| Salesforce, Inc. | 250 | 400 | 324.17 |
| Strategy Inc | 175 | 705 | 374.5 |
Salesforce’s consensus target sits well above its current price of $191, signaling substantial upside potential. Strategy Inc’s wide target range suggests higher volatility but also significant growth opportunities relative to its $135 price.

Don’t Let Luck Decide Your Entry Point
Optimize your entry points with our advanced ProRealTime indicators. You’ll get efficient buy signals with precise price targets for maximum performance. Start outperforming now!
How do institutions grade them?
Here is a summary of recent institutional grades for Salesforce, Inc. and Strategy Inc:
Salesforce, Inc. Grades
The table below shows the latest grades from major financial institutions for Salesforce, Inc.
| Grading Company | Action | New Grade | Date |
|---|---|---|---|
| Piper Sandler | Maintain | Overweight | 2026-02-03 |
| Barclays | Maintain | Overweight | 2026-01-12 |
| RBC Capital | Maintain | Sector Perform | 2026-01-05 |
| Morgan Stanley | Maintain | Overweight | 2025-12-09 |
| Citigroup | Maintain | Neutral | 2025-12-08 |
| DA Davidson | Maintain | Neutral | 2025-12-05 |
| Northland Capital Markets | Maintain | Market Perform | 2025-12-04 |
| Canaccord Genuity | Maintain | Buy | 2025-12-04 |
| Truist Securities | Maintain | Buy | 2025-12-04 |
| Baird | Maintain | Outperform | 2025-12-04 |
Strategy Inc Grades
Below is a summary of recent grades by financial firms covering Strategy Inc.
| Grading Company | Action | New Grade | Date |
|---|---|---|---|
| BTIG | Maintain | Buy | 2026-02-06 |
| Canaccord Genuity | Maintain | Buy | 2026-02-04 |
| Mizuho | Maintain | Outperform | 2026-01-16 |
| TD Cowen | Maintain | Buy | 2026-01-15 |
| Citigroup | Maintain | Buy | 2025-12-22 |
| Bernstein | Maintain | Outperform | 2025-12-08 |
| Monness, Crespi, Hardt | Upgrade | Neutral | 2025-11-10 |
| Canaccord Genuity | Maintain | Buy | 2025-11-03 |
| HC Wainwright & Co. | Maintain | Buy | 2025-11-03 |
| TD Cowen | Maintain | Buy | 2025-10-31 |
Which company has the best grades?
Strategy Inc generally receives stronger buy and outperform ratings consistently. Salesforce, Inc. shows a mix of overweight, neutral, and buy grades. Strategy Inc’s higher frequency of buy and outperform grades could signal greater institutional confidence. Investors may interpret this as relatively stronger market endorsement for Strategy Inc.
Risks specific to each company
The following categories identify the critical pressure points and systemic threats facing both firms in the 2026 market environment:
1. Market & Competition
Salesforce, Inc.
- Dominates with a 182B market cap in software applications, facing intense SaaS competition.
Strategy Inc
- Smaller 39B market cap, niche in bitcoin treasury and AI analytics, battling volatile crypto market.
2. Capital Structure & Debt
Salesforce, Inc.
- Low debt-to-equity at 0.19 and strong interest coverage of 28.18 signals financial stability.
Strategy Inc
- Higher leverage with 0.4 debt-to-equity and negative interest coverage raises solvency concerns.
3. Stock Volatility
Salesforce, Inc.
- Beta of 1.28 indicates moderate market sensitivity and steadier price movements.
Strategy Inc
- High beta at 3.54 signals extreme volatility, reflecting crypto exposure and market speculation.
4. Regulatory & Legal
Salesforce, Inc.
- Faces evolving data privacy and cloud regulation risks typical for enterprise software giants.
Strategy Inc
- Exposed to regulatory uncertainty over cryptocurrency laws and AI governance frameworks.
5. Supply Chain & Operations
Salesforce, Inc.
- Robust platform integrations and global partner network reduce operational disruptions.
Strategy Inc
- Smaller scale and reliance on digital assets increase operational risk amid crypto market swings.
6. ESG & Climate Transition
Salesforce, Inc.
- Strong ESG initiatives aligned with tech sector norms support sustainable growth.
Strategy Inc
- ESG efforts less mature, with climate risks tied to crypto mining energy consumption.
7. Geopolitical Exposure
Salesforce, Inc.
- Global footprint in stable markets diversifies geopolitical risks.
Strategy Inc
- Crypto focus exposes firm to sanctions, regulatory shifts, and geopolitical tensions in key regions.
Which company shows a better risk-adjusted profile?
Salesforce’s strongest risk is market competition amid a mature sector but benefits from solid financial health and moderate volatility. Strategy Inc’s principal risk is regulatory and financial instability tied to its crypto exposure, highlighted by weak liquidity and volatile stock performance. Salesforce offers a superior risk-adjusted profile, evidenced by its safe-zone Altman Z-Score of 4.21 versus Strategy’s grey-zone 2.30. Strategy’s recent 26% stock surge reflects speculative enthusiasm but amplifies risk exposure.
Final Verdict: Which stock to choose?
Salesforce, Inc. excels as a robust cash machine with a strong growth trajectory and improving profitability. Its efficiency in capital allocation supports sustained value creation, despite a premium valuation and a modest point of vigilance around its asset turnover. It suits an aggressive growth portfolio aiming for innovation leaders.
Strategy Inc’s key moat lies in niche specialization and asset-light operations, offering a strategic edge amid volatility. However, its financial instability and declining returns flag higher risk compared to Salesforce. This stock might appeal to risk-tolerant investors seeking deep value or turnaround opportunities within a GARP framework.
If you prioritize steady growth and proven capital efficiency, Salesforce outshines with better stability and a stronger financial foundation. However, if your strategy embraces contrarian bets and potential high reward from undervalued assets, Strategy Inc offers a speculative avenue despite its challenges. Each fits distinct investor profiles demanding disciplined risk management.
Disclaimer: Investment carries a risk of loss of initial capital. The past performance is not a reliable indicator of future results. Be sure to understand risks before making an investment decision.
Go Further
I encourage you to read the complete analyses of Salesforce, Inc. and Strategy Inc to enhance your investment decisions: