Salesforce, Inc. (CRM) and monday.com Ltd. (MNDY) are two leading players in the software application industry, each offering innovative platforms for business process management and customer engagement. While Salesforce boasts a vast ecosystem with diverse enterprise solutions, monday.com emphasizes flexible, visual work operating systems tailored for dynamic teams. This article will explore which company presents the most compelling investment opportunity for your portfolio in 2026.
Table of contents
Companies Overview
I will begin the comparison between Salesforce and monday.com by providing an overview of these two companies and their main differences.
Salesforce Overview
Salesforce, Inc. specializes in customer relationship management technology, aiming to connect companies and customers globally through its Customer 360 platform. It offers diverse services including sales, service, marketing, commerce, analytics via Tableau, and integration through MuleSoft. Founded in 1999 and headquartered in San Francisco, Salesforce serves multiple industries with a strong focus on personalized customer experiences and business app development, employing over 76K staff.
monday.com Overview
monday.com Ltd. develops cloud-based software applications, primarily its Work OS, a modular visual work management system that supports marketing, CRM, project management, and software development. Established in 2012 and based in Tel Aviv, the company caters to organizations worldwide, including educational and government institutions. With around 2.5K employees, monday.com focuses on flexible work management solutions and customer success services.
Key similarities and differences
Both Salesforce and monday.com operate in the software application industry with a technology focus and serve global markets. They provide cloud-based platforms that enhance business operations and customer engagement. However, Salesforce has a broader portfolio covering CRM, analytics, marketing, and commerce with a significantly larger workforce and market cap (219B vs 6.6B). monday.com emphasizes modular work management tools with a smaller scale and more recent IPO.
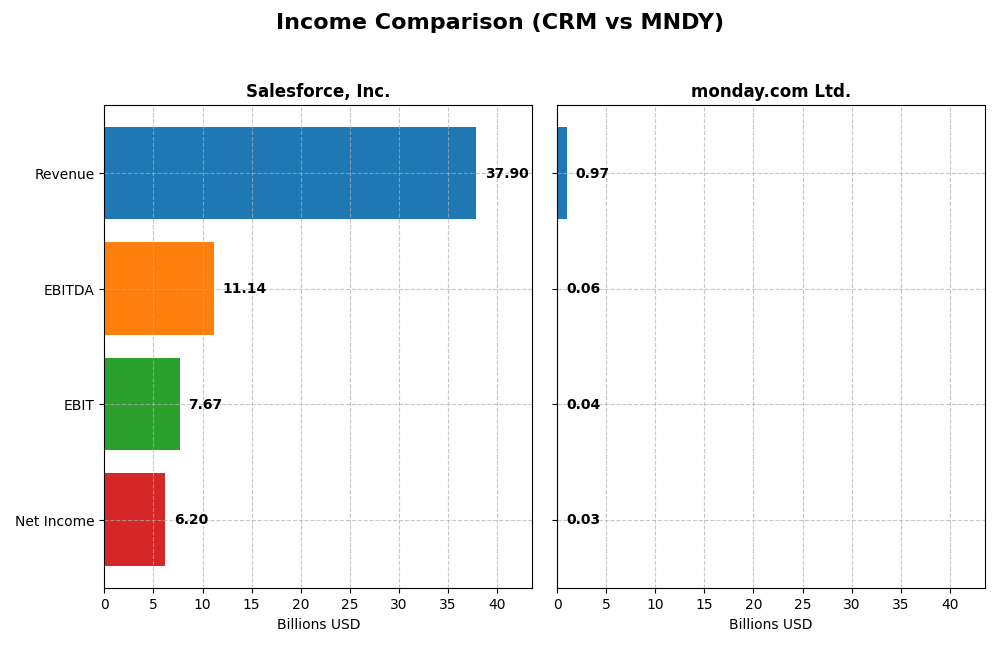
Income Statement Comparison
The table below compares key income statement metrics for Salesforce, Inc. and monday.com Ltd. for their most recent fiscal years.
| Metric | Salesforce, Inc. (CRM) | monday.com Ltd. (MNDY) |
|---|---|---|
| Market Cap | 219B | 6.6B |
| Revenue | 37.9B | 972M |
| EBITDA | 11.1B | 58M |
| EBIT | 7.7B | 40M |
| Net Income | 6.2B | 32M |
| EPS | 6.44 | 0.65 |
| Fiscal Year | 2025 | 2024 |
Income Statement Interpretations
Salesforce, Inc.
Salesforce demonstrated strong revenue growth from $21.3B in 2021 to $37.9B in 2025, with net income rising from $4.07B to $6.2B over the same period. Margins mostly remained favorable, with a slight net margin decline overall but marked improvement in the latest year. In 2025, revenue growth slowed to 8.7%, yet net margin grew substantially by 37.8%, reflecting better profitability.
monday.com Ltd.
monday.com’s revenue surged from $161M in 2020 to nearly $972M in 2024, while net income turned positive in 2024 at $32M after several years of losses. The company holds a high gross margin of 89.3%, with EBIT and net margins classified as neutral due to thin profitability. The latest year showed strong growth in revenue (33.2%) and net margin (1394.7%), highlighting a turnaround in earnings.
Which one has the stronger fundamentals?
Salesforce exhibits more stable and larger-scale financials with consistently favorable margins and significant net income growth, though net margin slightly contracted overall. monday.com reflects rapid expansion with exceptional growth rates and improving profitability but remains smaller and less mature. Both maintain favorable income statement evaluations, with Salesforce showing greater scale and margin strength.
Financial Ratios Comparison
This table presents a side-by-side comparison of key financial ratios for Salesforce, Inc. (CRM) and monday.com Ltd. (MNDY) based on their most recent full fiscal year data.
| Ratios | Salesforce, Inc. (CRM) 2025 | monday.com Ltd. (MNDY) 2024 |
|---|---|---|
| ROE | 10.1% | 3.14% |
| ROIC | 7.95% | -1.73% |
| P/E | 53.0 | 363 |
| P/B | 5.37 | 11.4 |
| Current Ratio | 1.06 | 2.66 |
| Quick Ratio | 1.06 | 2.66 |
| D/E (Debt-to-Equity) | 0.19 | 0.10 |
| Debt-to-Assets | 11.1% | 6.3% |
| Interest Coverage | 26.5 | 0 |
| Asset Turnover | 0.37 | 0.58 |
| Fixed Asset Turnover | 7.03 | 7.13 |
| Payout ratio | 24.8% | 0% |
| Dividend yield | 0.47% | 0% |
Interpretation of the Ratios
Salesforce, Inc.
Salesforce shows a mix of strong and weak ratios, with favorable net margin at 16.35% and good debt management indicated by a low debt-to-equity ratio of 0.19. However, its high P/E of 53.04 and P/B of 5.37 are unfavorable, suggesting expensive valuation. The dividend yield is low at 0.47%, reflecting a modest shareholder return approach.
monday.com Ltd.
monday.com presents several unfavorable profitability ratios, including a low net margin of 3.33% and negative return on invested capital at -1.73%. Its valuation ratios, like an extremely high P/E of 362.98 and P/B of 11.41, are also unfavorable. The company does not pay dividends, likely focusing on growth and reinvestment strategies.
Which one has the best ratios?
Salesforce holds a slightly favorable overall ratio profile with better profitability and debt metrics, despite expensive valuation multiples. monday.com, while showing strong liquidity and low leverage, suffers from weak profitability and high valuation, resulting in a neutral global ratio assessment.
Strategic Positioning
This section compares the strategic positioning of Salesforce, Inc. and monday.com Ltd., including their market position, key segments, and exposure to technological disruption:
Salesforce, Inc.
- Leading global CRM software provider with strong NYSE presence and high competitive pressure.
- Diverse software segments: Sales, Service, Marketing, Commerce, Integration, Analytics, and Platform services drive growth.
- Exposure through cloud-based platforms and integration solutions but no explicit disruption risk detailed.
monday.com Ltd.
- Smaller market cap NASDAQ-listed company in work management software facing competition.
- Focused on Work OS with modular tools for marketing, CRM, project management, and software development.
- Provides cloud-based solutions internationally, but no direct mention of disruption exposure.
Salesforce, Inc. vs monday.com Ltd. Positioning
Salesforce exhibits a diversified strategy across multiple cloud software segments, generating broad revenue streams, while monday.com concentrates on a modular work operating system. Salesforce’s broad portfolio contrasts with monday.com’s focused approach, reflecting different scale and market reach.
Which has the best competitive advantage?
Both companies are currently shedding value despite growing profitability, indicating slightly unfavorable moats. Salesforce’s larger scale and diversification may offer some resilience, but neither has demonstrated a strong sustainable competitive advantage based on current MOAT evaluations.
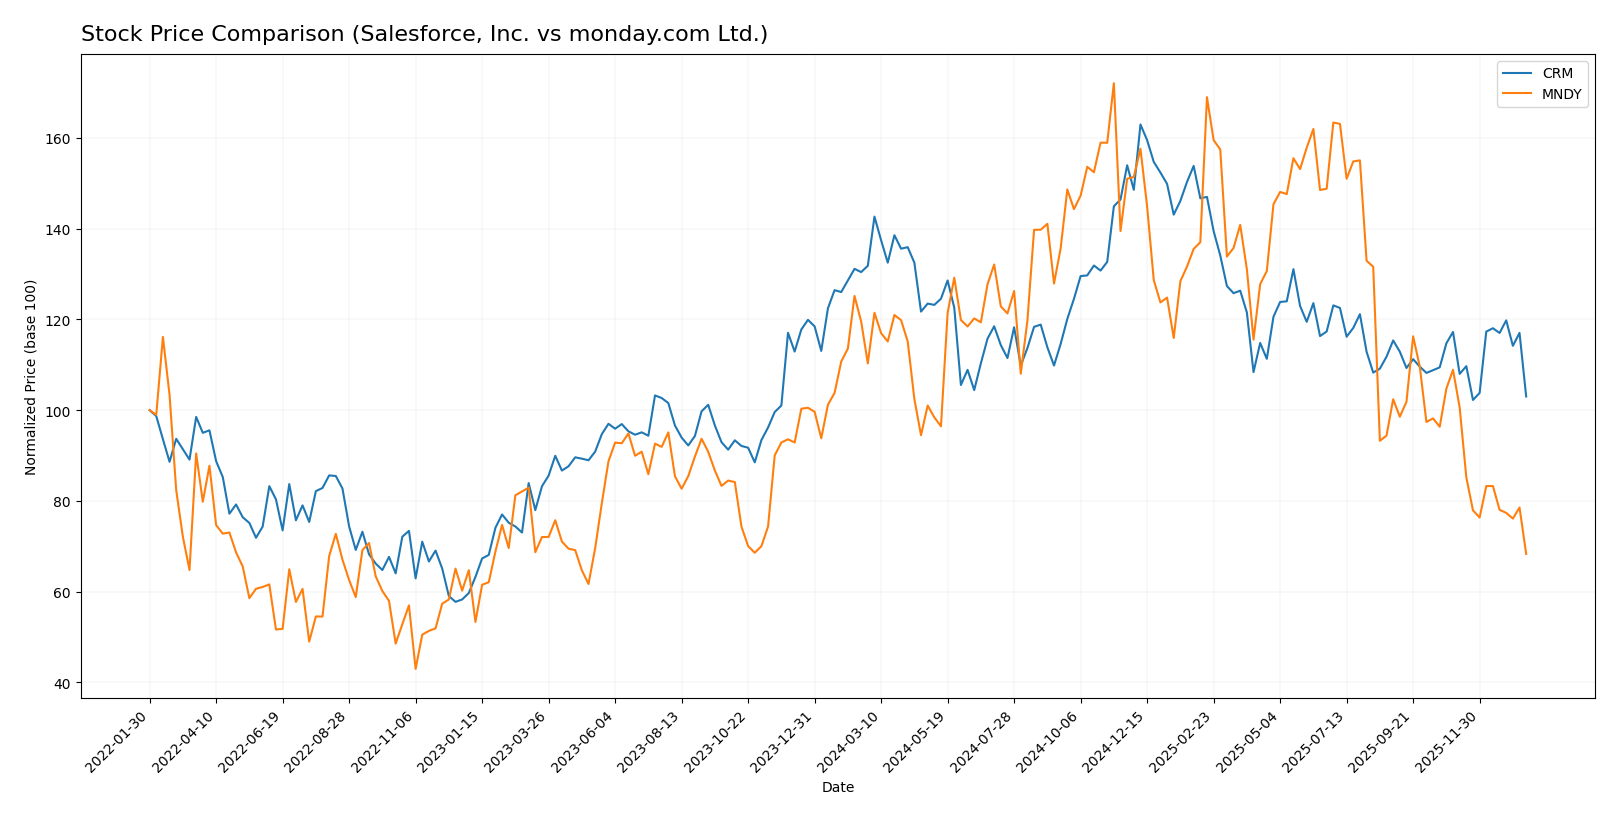
Stock Comparison
The stock price movements of Salesforce, Inc. (CRM) and monday.com Ltd. (MNDY) over the past 12 months reveal distinct bearish trends, marked by varying degrees of price decline and differing momentum patterns.
Trend Analysis
Salesforce, Inc. (CRM) experienced a 21.86% price decline over the past year, indicating a bearish trend with accelerating downward momentum. The stock showed high volatility, reaching a high of 361.99 and a low of 227.11.
monday.com Ltd. (MNDY) saw a steeper 38.07% decrease in price over the same period, confirming a bearish trend with decelerating downward momentum. Volatility was higher than CRM, with prices ranging from 324.31 to 128.75.
Comparing both, CRM outperformed MNDY in market performance over the last 12 months, delivering a smaller price decline and showing signs of recent trend acceleration versus MNDY’s sharper and decelerating drop.
Target Prices
The current analyst consensus for target prices indicates significant upside potential for both Salesforce, Inc. and monday.com Ltd.
| Company | Target High | Target Low | Consensus |
|---|---|---|---|
| Salesforce, Inc. | 400 | 250 | 324.17 |
| monday.com Ltd. | 330 | 194 | 264.42 |
Analysts expect Salesforce’s price to rise substantially above its current 228.95 USD, while monday.com’s consensus target price is more than double its current 128.72 USD, reflecting bullish sentiment on both stocks.
Analyst Opinions Comparison
This section compares analysts’ ratings and grades for Salesforce, Inc. and monday.com Ltd.:
Rating Comparison
Salesforce, Inc. Rating
- Rating: B+, considered very favorable overall.
- Discounted Cash Flow Score: 4, favorable value indicating good cash flow prospects.
- ROE Score: 4, favorable efficiency in generating profit from equity.
- ROA Score: 4, favorable asset utilization to generate earnings.
- Debt To Equity Score: 3, moderate financial risk profile.
- Overall Score: 3, moderate overall financial standing.
monday.com Ltd. Rating
- Rating: B-, also considered very favorable.
- Discounted Cash Flow Score: 4, favorable cash flow outlook similar to Salesforce.
- ROE Score: 3, moderate efficiency in profit generation from equity.
- ROA Score: 3, moderate effectiveness in asset utilization.
- Debt To Equity Score: 3, moderate financial risk, matching Salesforce.
- Overall Score: 3, moderate overall financial standing, same as Salesforce.
Which one is the best rated?
Based strictly on the provided data, Salesforce holds a higher rating of B+ compared to monday.com’s B-. Salesforce also scores higher in ROE and ROA, indicating better profitability and asset efficiency, while both share similar scores in other categories.
Scores Comparison
The following table compares the Altman Z-Score and Piotroski Score of Salesforce and monday.com Ltd.:
Salesforce Scores
- Altman Z-Score: 5.26, indicating a safe zone and low bankruptcy risk.
- Piotroski Score: 7, reflecting strong financial health and performance.
monday.com Scores
- Altman Z-Score: 6.33, indicating a safe zone and low bankruptcy risk.
- Piotroski Score: 5, reflecting average financial strength.
Which company has the best scores?
Salesforce has a lower Altman Z-Score but a higher Piotroski Score compared to monday.com Ltd. Salesforce shows stronger financial health, while both are in a safe zone regarding bankruptcy risk.
Grades Comparison
Here is a comparison of recent grades assigned by reputable financial institutions to Salesforce, Inc. and monday.com Ltd.:
Salesforce, Inc. Grades
The following table summarizes recent grades from major financial firms for Salesforce, Inc.:
| Grading Company | Action | New Grade | Date |
|---|---|---|---|
| Barclays | Maintain | Overweight | 2026-01-12 |
| RBC Capital | Maintain | Sector Perform | 2026-01-05 |
| Morgan Stanley | Maintain | Overweight | 2025-12-09 |
| Citigroup | Maintain | Neutral | 2025-12-08 |
| DA Davidson | Maintain | Neutral | 2025-12-05 |
| Citizens | Maintain | Market Outperform | 2025-12-04 |
| Deutsche Bank | Maintain | Buy | 2025-12-04 |
| Wedbush | Maintain | Outperform | 2025-12-04 |
| Northland Capital Markets | Maintain | Market Perform | 2025-12-04 |
| Canaccord Genuity | Maintain | Buy | 2025-12-04 |
Salesforce’s grades show a stable trend mostly between “Neutral” and “Overweight,” with several “Buy” and “Outperform” ratings, indicating moderate confidence.
monday.com Ltd. Grades
The following table presents the latest grades from recognized analysts for monday.com Ltd.:
| Grading Company | Action | New Grade | Date |
|---|---|---|---|
| Barclays | Maintain | Overweight | 2026-01-12 |
| Jefferies | Maintain | Buy | 2026-01-05 |
| Citigroup | Maintain | Buy | 2025-12-23 |
| Tigress Financial | Maintain | Buy | 2025-12-11 |
| JP Morgan | Maintain | Overweight | 2025-11-11 |
| Morgan Stanley | Maintain | Overweight | 2025-11-11 |
| Piper Sandler | Maintain | Overweight | 2025-11-11 |
| Canaccord Genuity | Maintain | Buy | 2025-11-11 |
| Baird | Maintain | Outperform | 2025-11-11 |
| Citigroup | Maintain | Buy | 2025-11-11 |
monday.com’s ratings are consistently positive, predominantly “Buy” and “Overweight,” with an “Outperform” rating, reflecting strong analyst support.
Which company has the best grades?
Both Salesforce and monday.com have a consensus “Buy” rating, but monday.com displays a more uniformly positive grade profile with multiple “Buy” and “Overweight” ratings. This consistency could suggest greater analyst confidence, potentially influencing investor sentiment and portfolio strategy.
Strengths and Weaknesses
The table below compares key strengths and weaknesses of Salesforce, Inc. (CRM) and monday.com Ltd. (MNDY) based on their latest financial data and market positioning.
| Criterion | Salesforce, Inc. (CRM) | monday.com Ltd. (MNDY) |
|---|---|---|
| Diversification | Highly diversified product portfolio across multiple clouds and services, with total FY2025 revenue exceeding $40B distributed among Sales Cloud, Service Cloud, Platform, and others. | Limited product range focused on work OS platform, less diversified revenue streams. |
| Profitability | Solid net margin at 16.35%, moderate ROIC at 7.95%, though ROIC below WACC indicating slight value erosion. | Low net margin of 3.33%, negative ROIC (-1.73%), indicating ongoing value destruction. |
| Innovation | Strong investment in platform and analytics with consistent revenue growth and innovation in cloud solutions. | Growing ROIC trend but still unprofitable, indicating innovation efforts not yet fully translating into profits. |
| Global presence | Established global footprint with broad enterprise adoption and extensive partner ecosystem. | Smaller global reach, more focused on niche markets and SMBs. |
| Market Share | Leading market share in CRM and cloud software sectors, benefiting from scale and brand recognition. | Smaller market share, competing in a crowded productivity and collaboration tools space. |
Key takeaway: Salesforce demonstrates strong diversification, profitability, and global presence, although it currently faces slight value destruction. monday.com shows potential with improving profitability trends but remains less diversified and less profitable, requiring cautious consideration.
Risk Analysis
Below is a comparative table summarizing key risks for Salesforce, Inc. (CRM) and monday.com Ltd. (MNDY) as of the most recent data available:
| Metric | Salesforce, Inc. (CRM) | monday.com Ltd. (MNDY) |
|---|---|---|
| Market Risk | Moderate (Beta 1.27, volatile tech sector) | Moderate (Beta 1.26, high valuation swings) |
| Debt level | Low (Debt-to-Equity 0.19, favorable) | Low (Debt-to-Equity 0.10, favorable) |
| Regulatory Risk | Moderate (US tech regulations evolving) | Moderate to High (International exposure, Israel base) |
| Operational Risk | Moderate (Large scale global operations) | Moderate (Smaller scale, growth phase) |
| Environmental Risk | Low (Technology sector, limited direct impact) | Low (Software focused) |
| Geopolitical Risk | Moderate (US-based, global presence) | Elevated (Headquartered in Israel, geopolitical tensions) |
The most impactful risks are geopolitical for monday.com due to its Israel location and market exposure, and regulatory shifts for Salesforce given its US and global footprint. Both companies maintain low debt levels, reducing financial risk. Market volatility remains moderate for both, reflecting tech sector sensitivity in 2026.
Which Stock to Choose?
Salesforce, Inc. (CRM) has shown favorable income evolution with 8.72% revenue growth in 2025 and strong profitability reflected in a 16.35% net margin. Its financial ratios are slightly favorable overall, including low debt (0.19 D/E) and high interest coverage (28.18). The company’s rating is very favorable with a B+ score and scores indicating solid financial health.
monday.com Ltd. (MNDY) experienced robust revenue growth of 33.21% in 2024, though with lower profitability, showing a 3.33% net margin and several unfavorable financial ratios such as a high P/E of 363 and negative ROIC. Its debt levels are low, and liquidity ratios are favorable. The company’s rating is also very favorable at B-, but with more moderate scores on profitability and valuation.
From an investor’s perspective, Salesforce might appear more suitable for those prioritizing stable profitability and financial strength, while monday.com could be interpreted as an option for growth-focused investors willing to accept higher valuation risks and lower current returns. Both companies show growing ROIC trends but are currently shedding value relative to their cost of capital.
Disclaimer: Investment carries a risk of loss of initial capital. The past performance is not a reliable indicator of future results. Be sure to understand risks before making an investment decision.
Go Further
I encourage you to read the complete analyses of Salesforce, Inc. and monday.com Ltd. to enhance your investment decisions: