Home > Comparison > Industrials > RTX vs TDG
The strategic rivalry between RTX Corporation and TransDigm Group Incorporated shapes the aerospace and defense sector’s competitive landscape. RTX operates as a diversified industrial powerhouse, integrating aerospace systems, engines, and defense technologies. In contrast, TransDigm focuses on specialized, high-margin aircraft components with a niche operational model. This analysis aims to identify which company’s trajectory offers superior risk-adjusted returns for a diversified portfolio amid evolving industry dynamics.
Table of contents
Companies Overview
RTX Corporation and TransDigm Group Incorporated stand as pivotal players in the aerospace and defense sector.
RTX Corporation: Aerospace & Defense Systems Leader
RTX Corporation dominates aerospace and defense with a diversified portfolio spanning commercial, military, and government clients. Its revenue primarily stems from three segments: Collins Aerospace, Pratt & Whitney engines, and Raytheon defense systems. In 2026, RTX focuses on expanding its integrated solutions and aftermarket services, cementing its competitive edge through innovation and broad market reach.
TransDigm Group Incorporated: Specialized Aircraft Components Supplier
TransDigm Group specializes in high-margin aircraft components across Power & Control, Airframe, and Non-aviation segments. Its core revenue arises from supplying essential parts to OEMs, airlines, and military buyers worldwide. In 2026, TransDigm sharpens its focus on proprietary products and aftermarket services, leveraging its niche expertise and pricing power within complex aerospace supply chains.
Strategic Collision: Similarities & Divergences
Both companies excel in aerospace but diverge philosophically: RTX pursues a broad, integrated systems approach, while TransDigm targets specialized components with proprietary control. Their primary battleground is the aftermarket service and supply chain dominance. RTX offers scale and diversified innovation; TransDigm boasts pricing power and product specialization, shaping distinct risk-return profiles for investors.
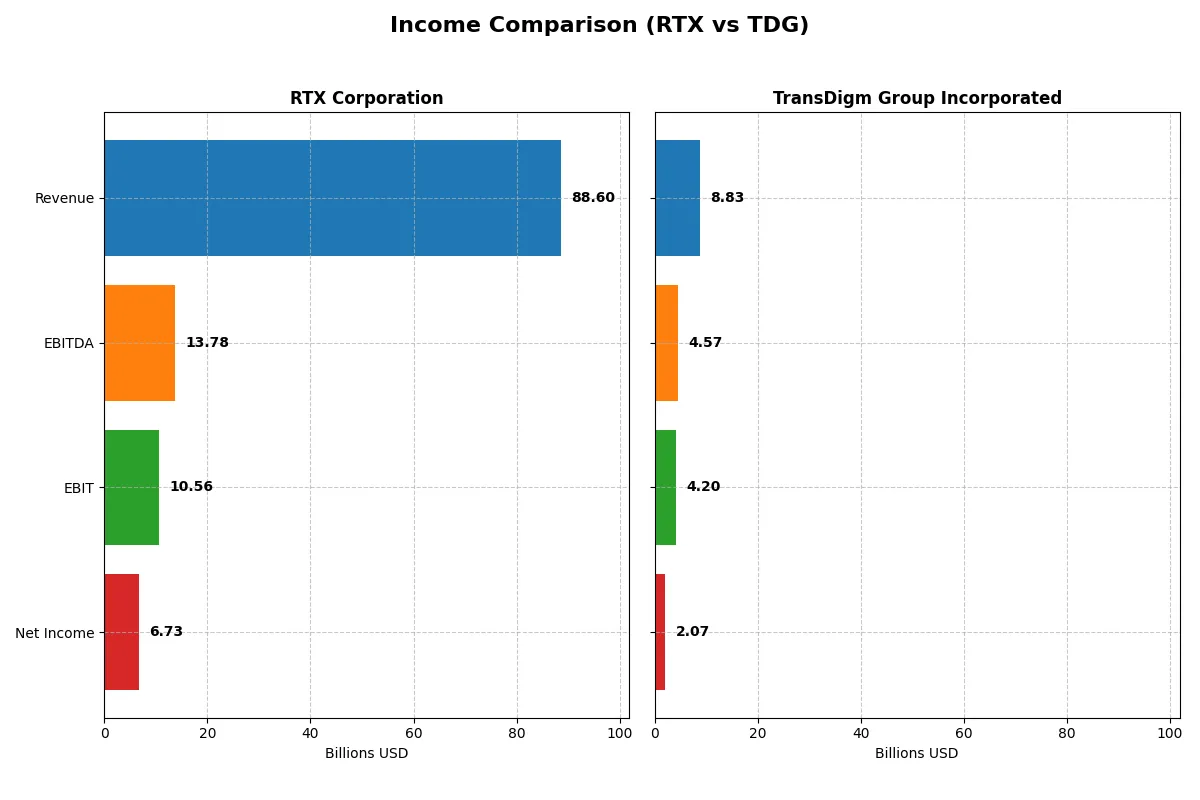
Income Statement Comparison
The data below dissects the core profitability and scalability of both corporate engines to reveal who dominates the bottom line:
| Metric | RTX Corporation (RTX) | TransDigm Group Incorporated (TDG) |
|---|---|---|
| Revenue | 88.6B | 8.8B |
| Cost of Revenue | 70.8B | 3.5B |
| Operating Expenses | 8.9B | 1.1B |
| Gross Profit | 17.8B | 5.3B |
| EBITDA | 13.8B | 4.6B |
| EBIT | 10.6B | 4.2B |
| Interest Expense | 1.8B | 1.6B |
| Net Income | 6.7B | 2.1B |
| EPS | 5.03 | 32.08 |
| Fiscal Year | 2025 | 2025 |
Income Statement Analysis: The Bottom-Line Duel
This income statement comparison reveals which company runs a more efficient and profitable corporate engine through recent financial performance.
RTX Corporation Analysis
RTX shows a steady revenue climb from $64B in 2021 to $88.6B in 2025, with net income surging from $3.9B to $6.7B. Gross margins hold firm near 20%, while net margins improved to 7.6% in 2025, reflecting enhanced cost control and operational leverage. The latest year exhibits strong momentum with a 9.7% revenue growth and a 28.5% net margin increase.
TransDigm Group Incorporated Analysis
TDG’s revenue jumped from $4.8B in 2021 to $8.8B in 2025, doubling net income from $607M to $1.87B. Its gross margin impresses at 60%, and net margin reached 23.5% despite a high 17.8% interest expense burden. The 2025 results show solid growth with 11.2% revenue increase and 8.8% net margin expansion, highlighting robust profitability despite financing costs.
Margin Power vs. Revenue Scale
TDG commands superior margins, with a 23.5% net margin vastly outpacing RTX’s 7.6%. However, RTX’s sheer revenue scale at $88.6B dwarfs TDG’s $8.8B, driving larger absolute profits. RTX’s broader diversification and improving margins offer scale efficiency, while TDG’s higher margins reflect niche pricing power. The choice depends on preference for margin dominance or revenue breadth in an investment profile.
Financial Ratios Comparison
These vital ratios act as a diagnostic tool to expose the underlying fiscal health, valuation premiums, and capital efficiency of each company:
| Ratios | RTX Corporation (RTX) | TransDigm Group (TDG) |
|---|---|---|
| ROE | 10.3% | -21.4% |
| ROIC | 6.2% | 15.2% |
| P/E | 36.6 | 37.0 |
| P/B | 3.78 | -7.92 |
| Current Ratio | 1.03 | 3.21 |
| Quick Ratio | 0.80 | 2.25 |
| D/E | 0.63 | -3.10 |
| Debt-to-Assets | 24.0% | 131.1% |
| Interest Coverage | 4.86 | 2.65 |
| Asset Turnover | 0.52 | 0.39 |
| Fixed Asset Turnover | 4.72 | 5.59 |
| Payout ratio | 53.1% | 464.3% |
| Dividend yield | 1.45% | 12.55% |
| Fiscal Year | 2025 | 2025 |
Efficiency & Valuation Duel: The Vital Signs
Financial ratios act as a company’s DNA, unveiling hidden risks and operational strengths essential for informed investment decisions.
RTX Corporation
RTX demonstrates moderate profitability with a 10.3% ROE and a neutral 7.6% net margin, reflecting steady but unspectacular returns. Its valuation appears stretched, with a high P/E of 36.6 and P/B of 3.78, signaling premium pricing. The company returns value through a 1.45% dividend yield, balancing shareholder payouts with ongoing R&D investments.
TransDigm Group Incorporated
TransDigm posts strong operational efficiency, boasting a 23.5% net margin and a robust 15.2% ROIC despite a negative ROE of -21.4%. Its valuation is similarly stretched, with a P/E near 37 but a favorable P/B ratio. The firm offers a striking 12.55% dividend yield, indicating substantial cash returned to shareholders amid mixed leverage and liquidity signals.
Premium Valuation vs. Operational Safety
Both companies carry slightly favorable overall ratios but face stretched valuations near a 37 P/E. RTX offers steadier returns and balanced payout with moderate leverage. TransDigm delivers superior margins and dividend yield but bears higher debt and risk. Conservative investors may prefer RTX’s stability; income-seekers might favor TransDigm’s yield profile.
Which one offers the Superior Shareholder Reward?
I compare RTX Corporation and TransDigm Group Incorporated based on their distribution philosophies, dividend yields, payout ratios, and buyback intensity. RTX pays a modest 1.45% yield with a 53% payout ratio, supported by solid free cash flow coverage (1.7x). It balances dividends with steady buybacks, fostering sustainable shareholder returns. TransDigm boasts an outsized 12.55% yield but an unsustainably high 464% payout ratio, signaling risk despite its large dividend per share ($165). TDG’s aggressive buybacks and high leverage raise red flags for long-term stability. I conclude RTX offers a superior total return profile in 2026, blending moderate yield, prudent payout, and sustainable buybacks.
Comparative Score Analysis: The Strategic Profile
The radar chart reveals the fundamental DNA and trade-offs of RTX Corporation and TransDigm Group Incorporated:
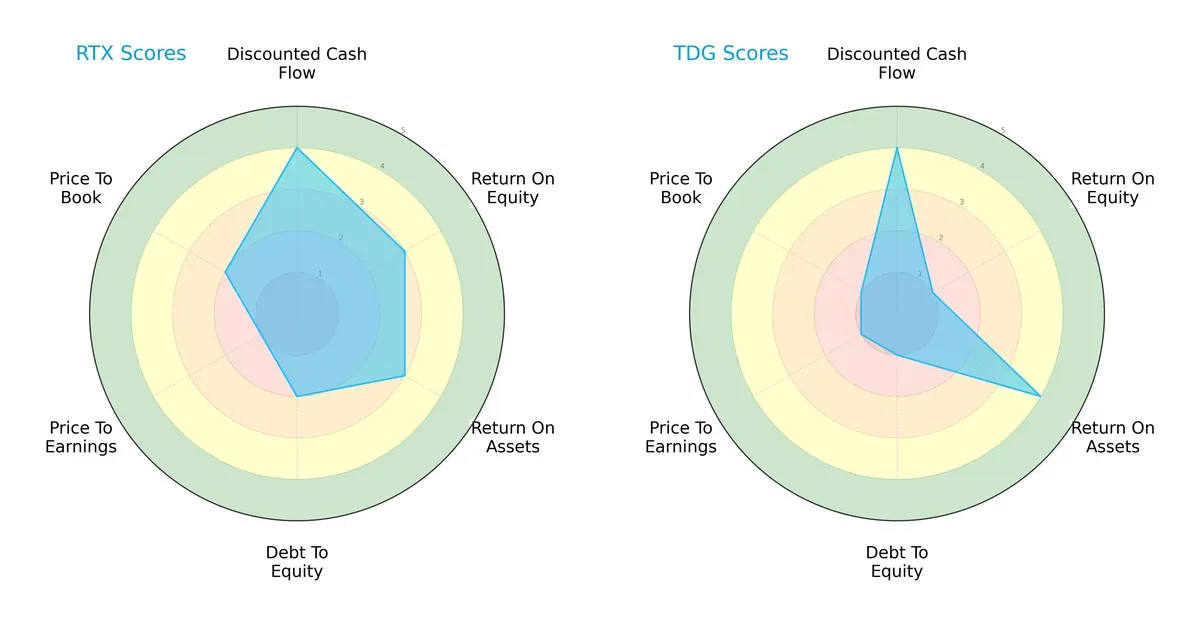
RTX demonstrates a balanced profile with solid DCF (4), ROE (3), and ROA (3) scores, but shows moderate leverage risk (debt/equity 2) and poor valuation metrics (P/E 1, P/B 2). TransDigm leans heavily on asset efficiency (ROA 4) but suffers from weak equity returns (ROE 1) and high leverage risk (debt/equity 1), coupled with unattractive valuations (P/E 1, P/B 1). RTX offers steadier fundamentals; TransDigm depends on operational efficiency amid financial risks.
Bankruptcy Risk: Solvency Showdown
The Altman Z-Scores position RTX at 2.77 and TransDigm at 1.93, both in the grey zone but with a clear solvency edge for RTX:
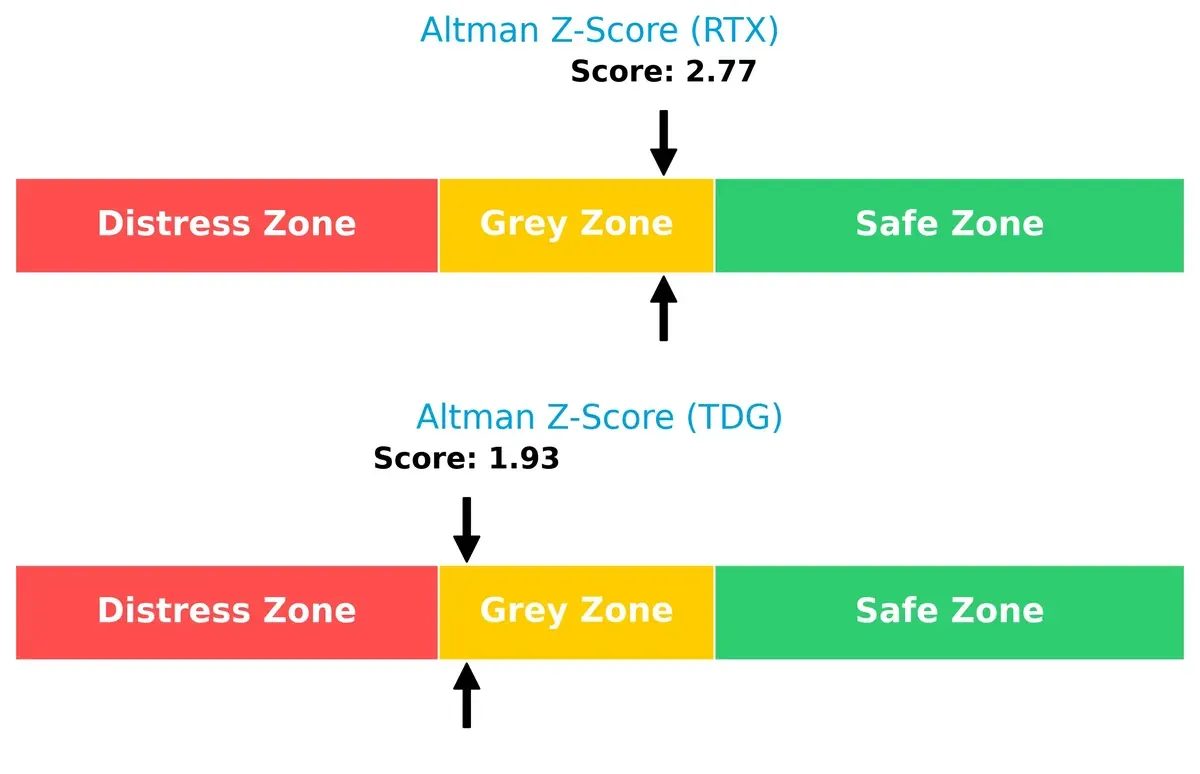
RTX’s higher score signals a stronger buffer against bankruptcy risk amid economic cycles. TransDigm’s score closer to the distress threshold warrants caution, reflecting potential vulnerability if market conditions deteriorate.
Financial Health: Quality of Operations
Both firms share identical Piotroski F-Scores of 7, indicating strong financial health without glaring red flags:
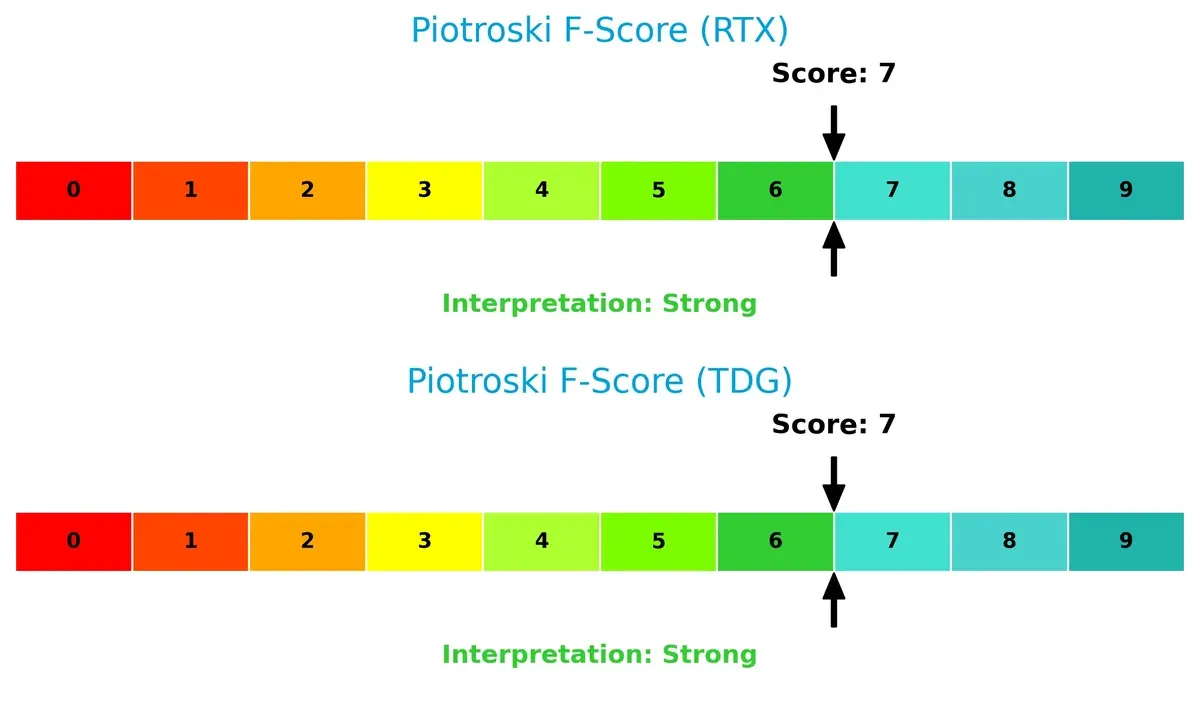
This parity suggests both companies maintain solid profitability, leverage, liquidity, and operational efficiency. Neither shows internal metric weaknesses, supporting resilience in their financial quality despite differing strategic risks.
How are the two companies positioned?
This section dissects RTX and TDG’s operational DNA by comparing revenue distribution and internal dynamics. The goal is to confront their economic moats to reveal which model offers the most resilient, sustainable advantage today.
Revenue Segmentation: The Strategic Mix
This visual comparison dissects how RTX Corporation and TransDigm Group diversify their income streams and where their primary sector bets lie:
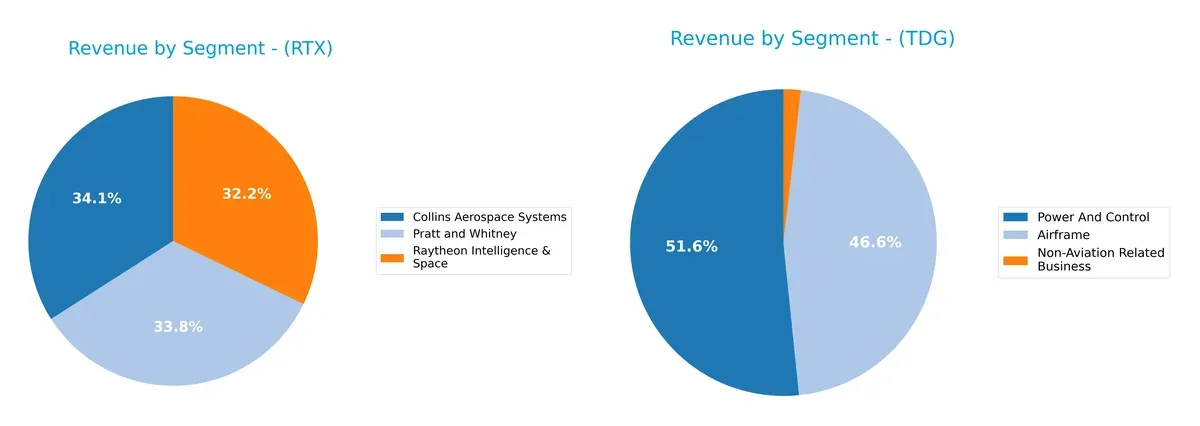
RTX Corporation’s revenue divides almost evenly among Collins Aerospace Systems ($28.3B), Pratt and Whitney ($28.1B), and Raytheon Intelligence & Space ($26.7B). This balance reflects strong ecosystem lock-in and infrastructure dominance across aerospace and defense. Conversely, TransDigm Group relies heavily on two segments: Power And Control ($4.6B) and Airframe ($4.1B), showing less diversification and higher concentration risk. RTX’s broad portfolio shields it better from sector volatility than TransDigm’s focused approach.
Strengths and Weaknesses Comparison
This table compares the Strengths and Weaknesses of RTX Corporation and TransDigm Group Incorporated:
RTX Strengths
- Diversified revenue across aerospace segments
- Favorable WACC and debt-to-assets ratios
- Strong global presence with majority US and broad Europe sales
TDG Strengths
- High net margin and ROIC indicating strong profitability
- Favorable quick ratio and debt-to-equity metrics
- Focused product lines with growing revenue in airframe and power control
RTX Weaknesses
- Unfavorable valuation multiples (PE, PB)
- Low quick ratio indicating liquidity concerns
- Neutral profitability metrics with moderate net margin and ROE
TDG Weaknesses
- Negative ROE and high debt-to-assets ratio signal financial stress
- Unfavorable current ratio and asset turnover
- High PE ratio implies valuation risk
RTX shows a broad operational scope with solid financial discipline in cost of capital and leverage. TDG exhibits strong profitability but faces financial structure risks and valuation challenges. Both companies maintain slightly favorable overall financial profiles, reflecting different strategic priorities.
The Moat Duel: Analyzing Competitive Defensibility
A structural moat is the only reliable shield protecting long-term profits from relentless competition erosion. Let’s compare RTX Corporation and TransDigm Group Incorporated:
RTX Corporation: Integrated Aerospace Systems Moat
RTX’s advantage stems from diversified aerospace segments combining engines, avionics, and defense systems. This integration yields stable margins and growing profitability despite a modest ROIC below WACC. Expansion in commercial and military markets could deepen its moat in 2026.
TransDigm Group Incorporated: Niche Components Pricing Power
TransDigm’s moat relies on proprietary, high-margin aerospace components with strong pricing power. Its ROIC significantly exceeds WACC, reflecting efficient capital use and robust value creation. Continued innovation and aftermarket dominance may further widen this moat.
Verdict: Diversification Stability vs. Concentrated Pricing Power
TransDigm’s niche pricing power builds a deeper moat than RTX’s broad aerospace integration. With a superior ROIC gap and margin profile, TransDigm is better equipped to defend market share against competition in 2026.
Which stock offers better returns?
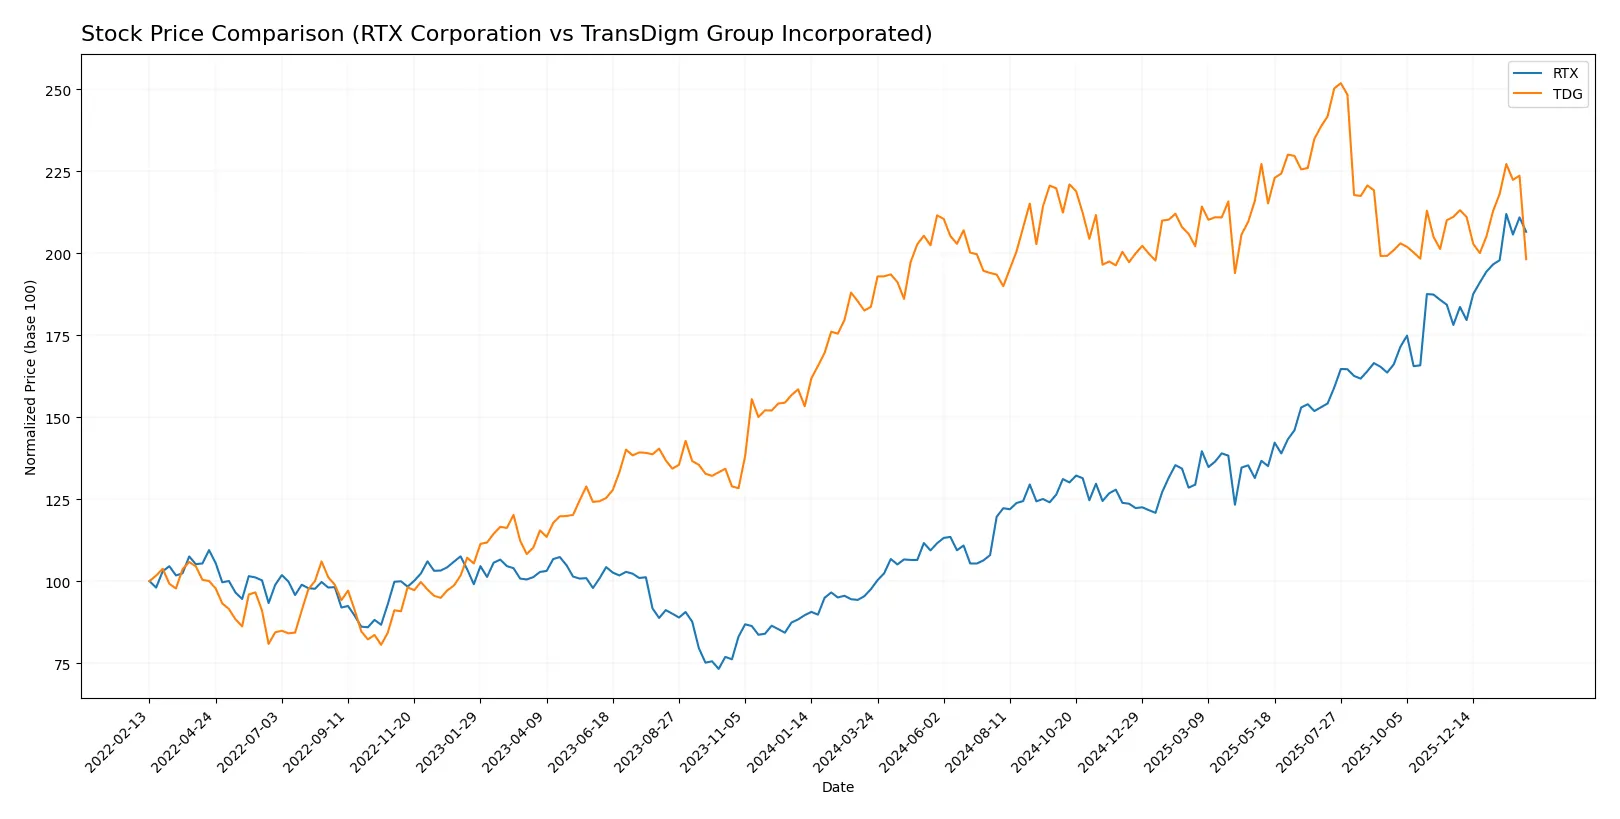
Over the past 12 months, RTX Corporation and TransDigm Group Incorporated exhibited distinct price trajectories, with RTX showing strong gains and TransDigm demonstrating modest appreciation followed by recent weakness.
Trend Comparison
RTX Corporation’s stock surged 111.71% over the past year, reflecting a clear bullish trend with accelerating momentum and a price range between 92.93 and 201.92. Volatility was moderate, with a standard deviation of 27.63.
TransDigm Group’s stock rose 7.9% over the same period, also bullish but with greater volatility (std dev 85.88). The trend accelerated overall, despite a recent 6.12% decline signaling short-term weakness.
RTX’s performance decisively outpaced TransDigm’s, delivering substantially higher returns and sustained upward acceleration through the twelve-month span.
Target Prices
Analysts show a bullish consensus for RTX Corporation and TransDigm Group Incorporated, expecting strong upside potential.
| Company | Target Low | Target High | Consensus |
|---|---|---|---|
| RTX Corporation | 168 | 235 | 214.7 |
| TransDigm Group Incorporated | 1370 | 1871 | 1582 |
The target consensus for RTX at $214.7 suggests a 9% upside from the current $196.74 price. TransDigm’s $1582 consensus implies a 25% gain from $1264.79, reflecting robust analyst confidence.

Don’t Let Luck Decide Your Entry Point
Optimize your entry points with our advanced ProRealTime indicators. You’ll get efficient buy signals with precise price targets for maximum performance. Start outperforming now!
How do institutions grade them?
This section compares recent institutional grades for RTX Corporation and TransDigm Group Incorporated:
RTX Corporation Grades
The following table summarizes recent grades assigned to RTX Corporation by major financial institutions.
| Grading Company | Action | New Grade | Date |
|---|---|---|---|
| UBS | Maintain | Neutral | 2026-01-28 |
| JP Morgan | Maintain | Overweight | 2026-01-28 |
| RBC Capital | Maintain | Outperform | 2026-01-28 |
| Citigroup | Maintain | Buy | 2026-01-13 |
| UBS | Downgrade | Neutral | 2026-01-05 |
| JP Morgan | Maintain | Overweight | 2025-12-19 |
| B of A Securities | Maintain | Buy | 2025-10-27 |
| UBS | Maintain | Buy | 2025-10-22 |
| Goldman Sachs | Maintain | Neutral | 2025-10-22 |
| Susquehanna | Maintain | Positive | 2025-10-22 |
TransDigm Group Incorporated Grades
Below is a summary of the recent institutional grades given to TransDigm Group Incorporated.
| Grading Company | Action | New Grade | Date |
|---|---|---|---|
| UBS | Maintain | Buy | 2026-02-04 |
| UBS | Maintain | Buy | 2026-01-15 |
| JP Morgan | Maintain | Neutral | 2025-11-14 |
| Morgan Stanley | Maintain | Overweight | 2025-11-14 |
| Stifel | Maintain | Buy | 2025-11-13 |
| BMO Capital | Maintain | Outperform | 2025-11-13 |
| UBS | Maintain | Buy | 2025-11-13 |
| RBC Capital | Maintain | Sector Perform | 2025-11-13 |
| Morgan Stanley | Maintain | Overweight | 2025-10-15 |
| Truist Securities | Maintain | Buy | 2025-10-15 |
Which company has the best grades?
TransDigm Group Incorporated consistently earns higher ratings, including multiple Buy and Outperform grades. RTX Corporation shows a mix of Neutral to Outperform grades but has recent downgrades. Investors may view TransDigm’s stronger consensus as a signal of more favorable analyst sentiment.
Risks specific to each company
The following categories identify the critical pressure points and systemic threats facing both firms in the 2026 market environment:
1. Market & Competition
RTX Corporation
- Operates in a highly competitive aerospace & defense sector with diversified segments mitigating risk.
TransDigm Group Incorporated
- Faces intense competition in specialized aircraft components with niche market power but less diversification.
2. Capital Structure & Debt
RTX Corporation
- Debt-to-assets ratio at 24% is favorable; interest coverage strong at 5.77x, indicating manageable leverage.
TransDigm Group Incorporated
- Debt-to-assets at 131% signals high leverage risk; interest coverage moderate at 2.67x, raising financial vulnerability.
3. Stock Volatility
RTX Corporation
- Beta of 0.42 suggests lower market volatility and defensive stock behavior.
TransDigm Group Incorporated
- Beta near 0.9 indicates higher sensitivity to market swings and greater volatility risk.
4. Regulatory & Legal
RTX Corporation
- Subject to stringent aerospace & defense regulations but benefits from established compliance frameworks.
TransDigm Group Incorporated
- Faces regulatory scrutiny in specialized component manufacturing; less regulatory breadth but possible concentrated risks.
5. Supply Chain & Operations
RTX Corporation
- Large, complex supply chains across commercial and military segments add operational risk but also resilience.
TransDigm Group Incorporated
- Supply chain focused on component manufacturing; more susceptible to single-source supplier disruptions.
6. ESG & Climate Transition
RTX Corporation
- Increasing ESG initiatives due to scale; climate transition risks managed via diversified aerospace portfolio.
TransDigm Group Incorporated
- ESG risks rising with industrial components focus; less publicized sustainability initiatives may flag investor concerns.
7. Geopolitical Exposure
RTX Corporation
- Global footprint with defense contracts exposes RTX to geopolitical shifts but also government support buffers.
TransDigm Group Incorporated
- International sales present geopolitical risks; smaller scale limits risk mitigation compared to larger peers.
Which company shows a better risk-adjusted profile?
RTX’s more balanced capital structure and lower stock volatility create a stronger risk-adjusted profile. TransDigm’s heavy leverage and higher beta amplify its financial and market risks. RTX’s Altman Z-Score and interest coverage ratios indicate better bankruptcy risk management. The most impactful risk for RTX is operational complexity in a volatile market, while TransDigm faces critical leverage risks that could impair financial flexibility. Recent debt-to-assets data confirm TransDigm’s elevated financial risk, tipping the scale in favor of RTX for risk-conscious investors.
Final Verdict: Which stock to choose?
RTX Corporation’s superpower lies in its steadily growing profitability amid a challenging industrial landscape. Its improving ROIC signals rising efficiency, yet a cautious eye on its moderate leverage and valuation premium remains prudent. RTX fits well in portfolios seeking disciplined industrial growth with a blend of stability and upside.
TransDigm Group Incorporated boasts a robust moat through exceptional margin dominance and strong free cash flow generation. Its niche pricing power underpins a strategic advantage, though high debt levels and episodic earnings volatility require vigilance. TDG suits investors favoring high-margin, cash-rich businesses willing to tolerate leverage risk for growth.
If you prioritize resilient industrial growth with improving capital efficiency, RTX outshines as a strategic choice due to its balanced risk profile and upward earnings trajectory. However, if you seek commanding margin superiority and can weather financial leverage, TDG offers superior cash flow generation and a durable competitive moat. Each represents a scenario aligned to distinct investor risk appetites and return expectations.
Disclaimer: Investment carries a risk of loss of initial capital. The past performance is not a reliable indicator of future results. Be sure to understand risks before making an investment decision.
Go Further
I encourage you to read the complete analyses of RTX Corporation and TransDigm Group Incorporated to enhance your investment decisions: