Home > Comparison > Industrials > RTX vs BA
The strategic rivalry between RTX Corporation and The Boeing Company defines the current trajectory of the aerospace and defense sector. RTX operates as a diversified industrial powerhouse with integrated aerospace systems and defense technologies. Boeing, meanwhile, combines commercial jetliner manufacturing with expansive defense and space services. This analysis pits RTX’s broad-based innovation against Boeing’s scale and service integration to identify which offers superior risk-adjusted returns for a balanced portfolio.
Table of contents
Companies Overview
RTX Corporation and The Boeing Company stand as pillars in the aerospace and defense industry, shaping global markets.
RTX Corporation: Integrated Aerospace & Defense Leader
RTX Corporation commands a diversified aerospace and defense portfolio spanning commercial, military, and government sectors. Its revenue hinges on three segments: Collins Aerospace, Pratt & Whitney engines, and Raytheon defense systems. In 2026, RTX sharpens its focus on expanding integrated system capabilities and aftermarket services, reinforcing its competitive advantage through innovation and comprehensive customer solutions.
The Boeing Company: Aerospace Giant with Broad Aerospace Reach
The Boeing Company dominates as a manufacturer and service provider of commercial jetliners, military aircraft, and space systems. Its core revenue derives from four segments: Commercial Airplanes, Defense, Space & Security, Global Services, and financing via Boeing Capital. Boeing’s 2026 strategy prioritizes advancing commercial airplane production while scaling its defense and space technology offerings, balancing growth with service excellence and financial management.
Strategic Collision: Similarities & Divergences
Both giants pursue aerospace and defense leadership but differ in approach. RTX integrates systems and services with a focus on engine technology and defense innovation. Boeing emphasizes complete aircraft manufacturing, space exploration, and broad service ecosystems. Their primary battleground is commercial and military aerospace markets. RTX offers a diversified, tech-driven profile, while Boeing presents a scale-driven, multifaceted aerospace powerhouse.
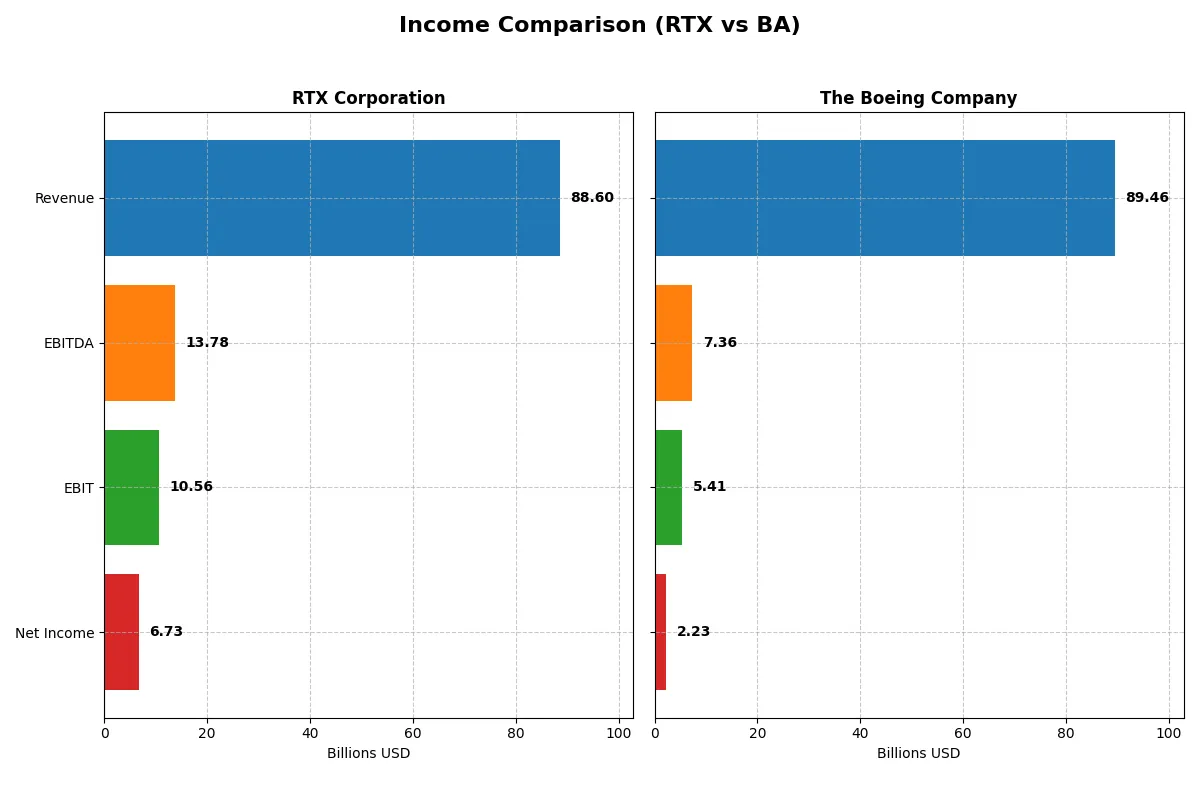
Income Statement Comparison
This data dissects the core profitability and scalability of both corporate engines to reveal who dominates the bottom line:
| Metric | RTX Corporation (RTX) | The Boeing Company (BA) |
|---|---|---|
| Revenue | 88.6B | 89.5B |
| Cost of Revenue | 70.8B | 85.2B |
| Operating Expenses | 8.9B | 9.7B |
| Gross Profit | 17.8B | 4.3B |
| EBITDA | 13.8B | 7.4B |
| EBIT | 10.6B | 5.4B |
| Interest Expense | 1.8B | 2.8B |
| Net Income | 6.7B | 1.9B |
| EPS | 5.03 | 2.49 |
| Fiscal Year | 2025 | 2025 |
Income Statement Analysis: The Bottom-Line Duel
This income statement comparison uncovers which company drives superior efficiency and profitability through its core operations.
RTX Corporation Analysis
RTX shows a robust revenue climb from $64B in 2021 to $88.6B in 2025, with net income more than doubling from $3.9B to $6.7B. The company maintains healthy gross margins near 20% and net margins improving to 7.6% in 2025. This demonstrates strong operational efficiency and sustained momentum in profitability and EPS growth.
The Boeing Company Analysis
Boeing’s revenue rose from $62.3B in 2021 to $89.5B in 2025, recovering from prior losses. Despite volatile net income swinging from a $4.2B loss in 2021 to a $2.2B profit in 2025, Boeing’s margins remain thin, with a 4.8% gross margin and 2.5% net margin in 2025. The recent sharp turnaround reflects improved cost control but still lags in profitability compared to RTX.
Margin Strength vs. Recovery Trajectory
RTX delivers consistently higher margins and clearer earnings quality, underpinning a fundamentally stronger income statement. Boeing shows impressive growth from deep losses but operates with weaker profitability and margin discipline. Investors seeking stable, margin-driven returns find RTX’s profile more attractive, while Boeing’s recovery remains a riskier, high-volatility play.
Financial Ratios Comparison
These vital ratios act as a diagnostic tool to expose the underlying fiscal health, valuation premiums, and capital efficiency of the companies compared below:
| Ratios | RTX Corporation (RTX) | The Boeing Company (BA) |
|---|---|---|
| ROE | 10.3% | 40.98% |
| ROIC | 6.22% | -6.71% |
| P/E | 36.6 | 74.1 |
| P/B | 3.78 | 30.35 |
| Current Ratio | 1.03 | 1.27 |
| Quick Ratio | 0.80 | 0.49 |
| D/E | 0.63 | 9.92 |
| Debt-to-Assets | 24.0% | 32.2% |
| Interest Coverage | 4.86 | -1.95 |
| Asset Turnover | 0.52 | 0.53 |
| Fixed Asset Turnover | 4.72 | 5.73 |
| Payout Ratio | 53.1% | 14.8% |
| Dividend Yield | 1.45% | 0.20% |
| Fiscal Year | 2025 | 2025 |
Efficiency & Valuation Duel: The Vital Signs
Ratios act as a company’s DNA, revealing hidden risks and operational excellence behind the financial statements.
RTX Corporation
RTX shows moderate profitability with a 10.3% ROE and a 7.6% net margin, reflecting operational steadiness. Its valuation appears stretched, trading at a high 36.6 P/E and 3.78 P/B, signaling investor optimism. The company offers a 1.45% dividend yield, balancing shareholder returns with ongoing R&D investments at 3.17% of revenue.
The Boeing Company
Boeing delivers a striking 41.0% ROE but suffers from weak profitability with a 2.5% net margin. Its valuation is expensive, with a 74.1 P/E and a sky-high 30.35 P/B, indicating significant market expectations. Boeing’s dividend yield stands low at 0.2%, reflecting limited shareholder cash returns amid ongoing recovery challenges.
Premium Valuation vs. Operational Safety
RTX trades at a premium but maintains consistent profitability and a balanced capital structure. Boeing’s high ROE contrasts with profitability struggles and heavy debt. Investors seeking operational safety may prefer RTX, while risk-tolerant profiles might consider Boeing’s growth potential despite its financial headwinds.
Which one offers the Superior Shareholder Reward?
I find RTX Corporation delivers a superior shareholder reward compared to The Boeing Company in 2026. RTX pays a 1.45% dividend yield with a 53% payout ratio, well-covered by strong free cash flow of 5.9/share. Its buyback activities further enhance total returns. Boeing offers a paltry 0.2% dividend yield and negative free cash flow (-2.5/share), signaling weak distribution capacity. Boeing’s heavy debt load (debt/equity 9.9x) and poor operating cash flow coverage raise sustainability concerns. RTX’s balanced dividend and buyback strategy, backed by healthier margins and cash flow, promises more sustainable long-term value creation and total return upside.
Comparative Score Analysis: The Strategic Profile
The radar chart reveals the fundamental DNA and trade-offs of RTX Corporation and The Boeing Company, highlighting their distinct financial strengths and weaknesses:
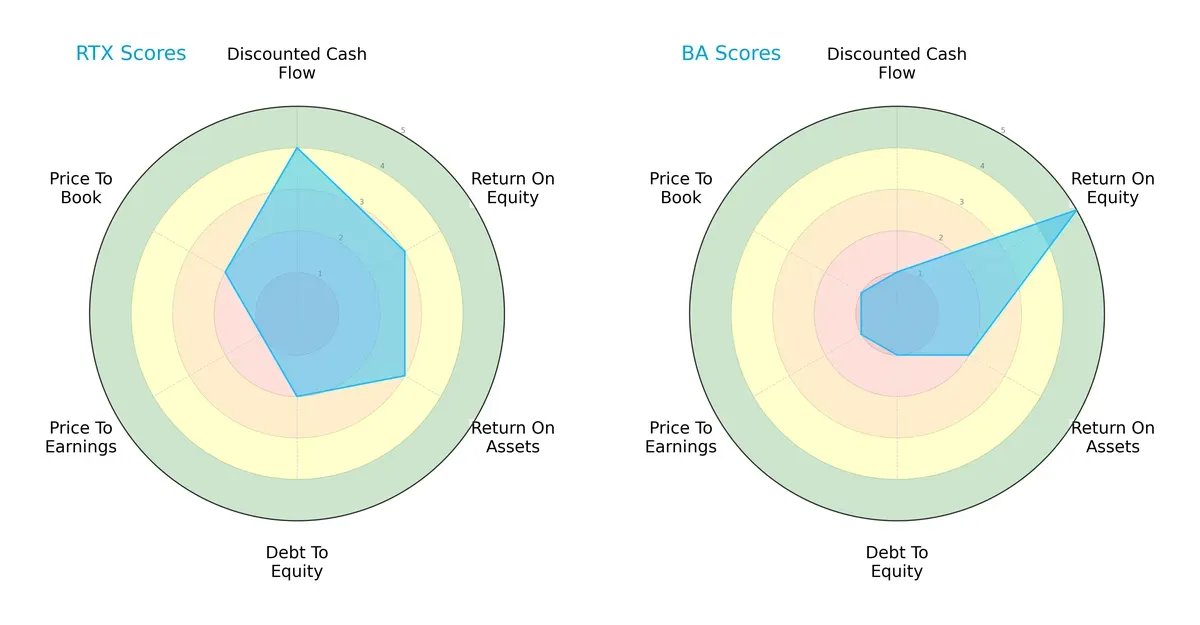
RTX shows a more balanced profile with moderate scores in ROE (3) and ROA (3) and a favorable DCF score (4), though its debt and valuation metrics lag. Boeing relies heavily on a strong ROE (5) but suffers from very weak debt and valuation scores (1 across the board), reflecting higher financial risk and poor market pricing.
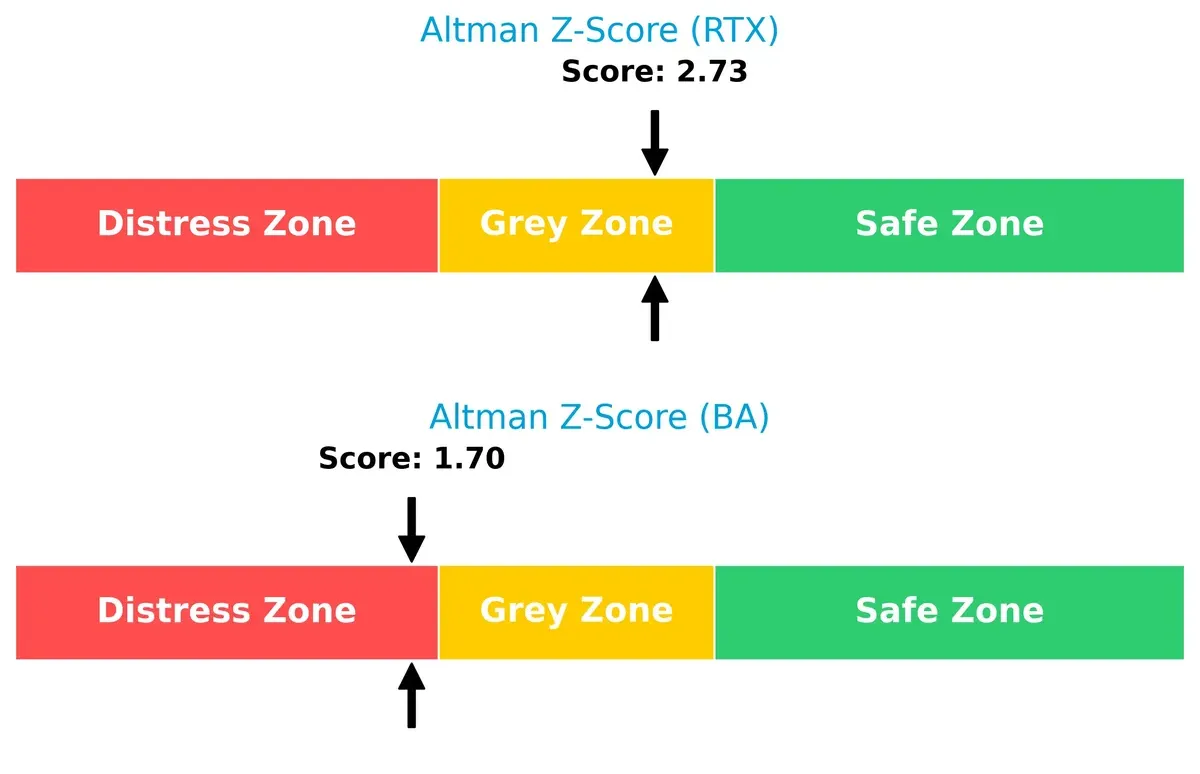
Bankruptcy Risk: Solvency Showdown
The Altman Z-Score gap indicates RTX operates in the grey zone (2.73), implying moderate bankruptcy risk, while Boeing’s distress zone score (1.70) signals elevated financial vulnerability in this cycle:
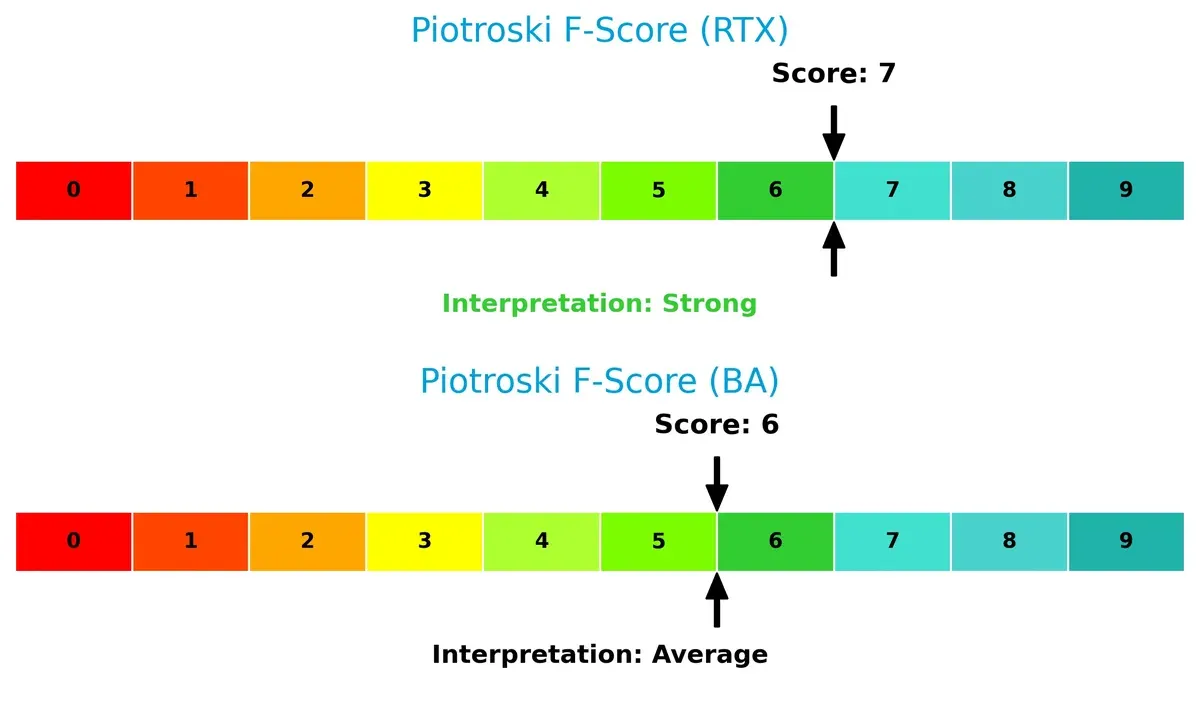
Financial Health: Quality of Operations
RTX’s Piotroski F-Score of 7 suggests strong financial health with solid operational quality, outperforming Boeing’s average score of 6, which raises caution on internal metrics and value sustainability:
How are the two companies positioned?
This section dissects RTX and BA’s operational DNA by comparing their revenue distribution and internal dynamics, including strengths and weaknesses. The goal is to confront their economic moats and identify which business model offers the most resilient competitive advantage today.
Revenue Segmentation: The Strategic Mix
This comparison dissects how RTX Corporation and The Boeing Company diversify income streams and highlights their primary sector bets:
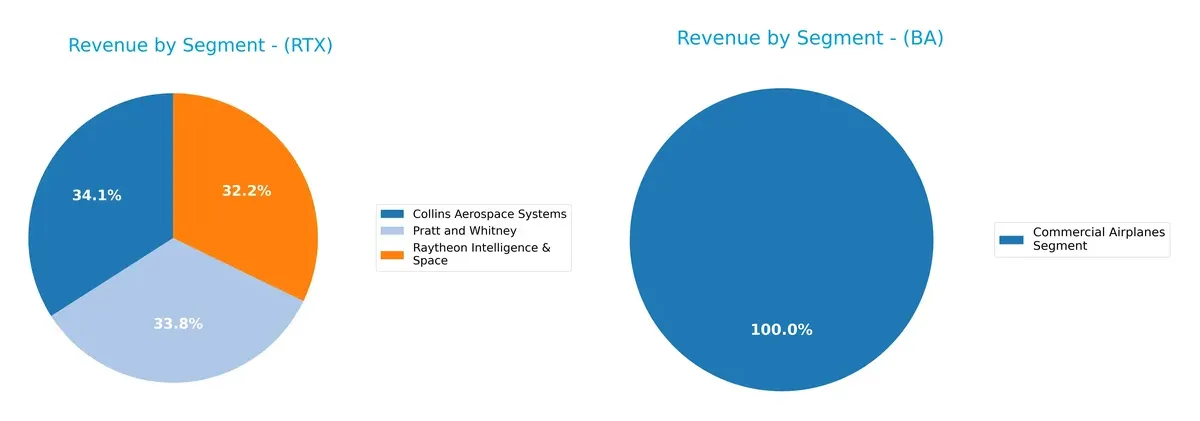
RTX splits revenue almost evenly across Collins Aerospace Systems ($28.3B), Pratt and Whitney ($28.1B), and Raytheon Intelligence & Space ($26.7B). This balanced portfolio reduces concentration risk and anchors RTX in aerospace, defense, and intelligence. Boeing’s revenue pivots around Commercial Airplanes ($22.9B) and Boeing Defense Space Security ($23.9B), with Global Services ($19.9B) adding diversification. Boeing leans more heavily on commercial aviation, exposing it to market cyclicality but benefiting from ecosystem lock-in.
Strengths and Weaknesses Comparison
This table compares the Strengths and Weaknesses of RTX Corporation and The Boeing Company:
RTX Strengths
- Diversified revenue across aerospace and defense segments
- Favorable WACC at 5.45% supporting efficient capital use
- Strong interest coverage ratio at 5.77 indicating robust debt servicing
- Favorable fixed asset turnover at 4.72 showing asset efficiency
BA Strengths
- High ROE at 40.98% reflecting strong profitability on equity
- Leading market share in commercial airplanes with $41.5B segment revenue
- Favorable fixed asset turnover at 5.73 highlighting efficient asset use
RTX Weaknesses
- Unfavorable P/E at 36.64 suggesting high valuation risk
- Low quick ratio at 0.8 indicating potential liquidity issues
- Neutral net margin at 7.6%, limiting profitability upside
- Moderate debt/equity ratio at 0.63 constraining financial leverage
BA Weaknesses
- Negative ROIC at -6.71% indicating value destruction on invested capital
- Unfavorable net margin at 2.5%, showing weak profitability
- High debt/equity at 9.92 raising financial risk
- Poor interest coverage at 1.95 posing debt servicing concerns
- Very high P/B ratio at 30.35 signaling overvaluation
RTX benefits from diversification and solid capital efficiency but faces valuation and liquidity concerns. Boeing’s profitability is supported by strong equity returns and market dominance, yet it struggles with capital inefficiency and high financial risk. These contrasts inform their strategic focus on balancing growth with financial stability.
The Moat Duel: Analyzing Competitive Defensibility
A durable structural moat shields long-term profits from relentless competitive pressure. Here’s how RTX Corporation and The Boeing Company defend their turf:
RTX Corporation: Diversified Aerospace Moat
RTX leverages intangible assets and integrated defense systems, reflected in stable margins and growing ROIC. Its strong aftermarket services and new tech deepen this advantage in 2026.
The Boeing Company: Scale and Brand Moat
Boeing’s moat centers on scale and brand recognition, but declining ROIC signals weakening capital efficiency. Recent product launches aim to revive growth, yet competition pressures loom large.
Integrated Innovation vs. Scale Legacy
RTX’s growing ROIC and diversified portfolio reveal a deeper moat than Boeing’s shrinking capital returns. RTX stands better poised to defend and expand its aerospace leadership.
Which stock offers better returns?
The chart highlights strong price gains for both RTX Corporation and The Boeing Company over the past year, with distinct acceleration phases and notable highs.
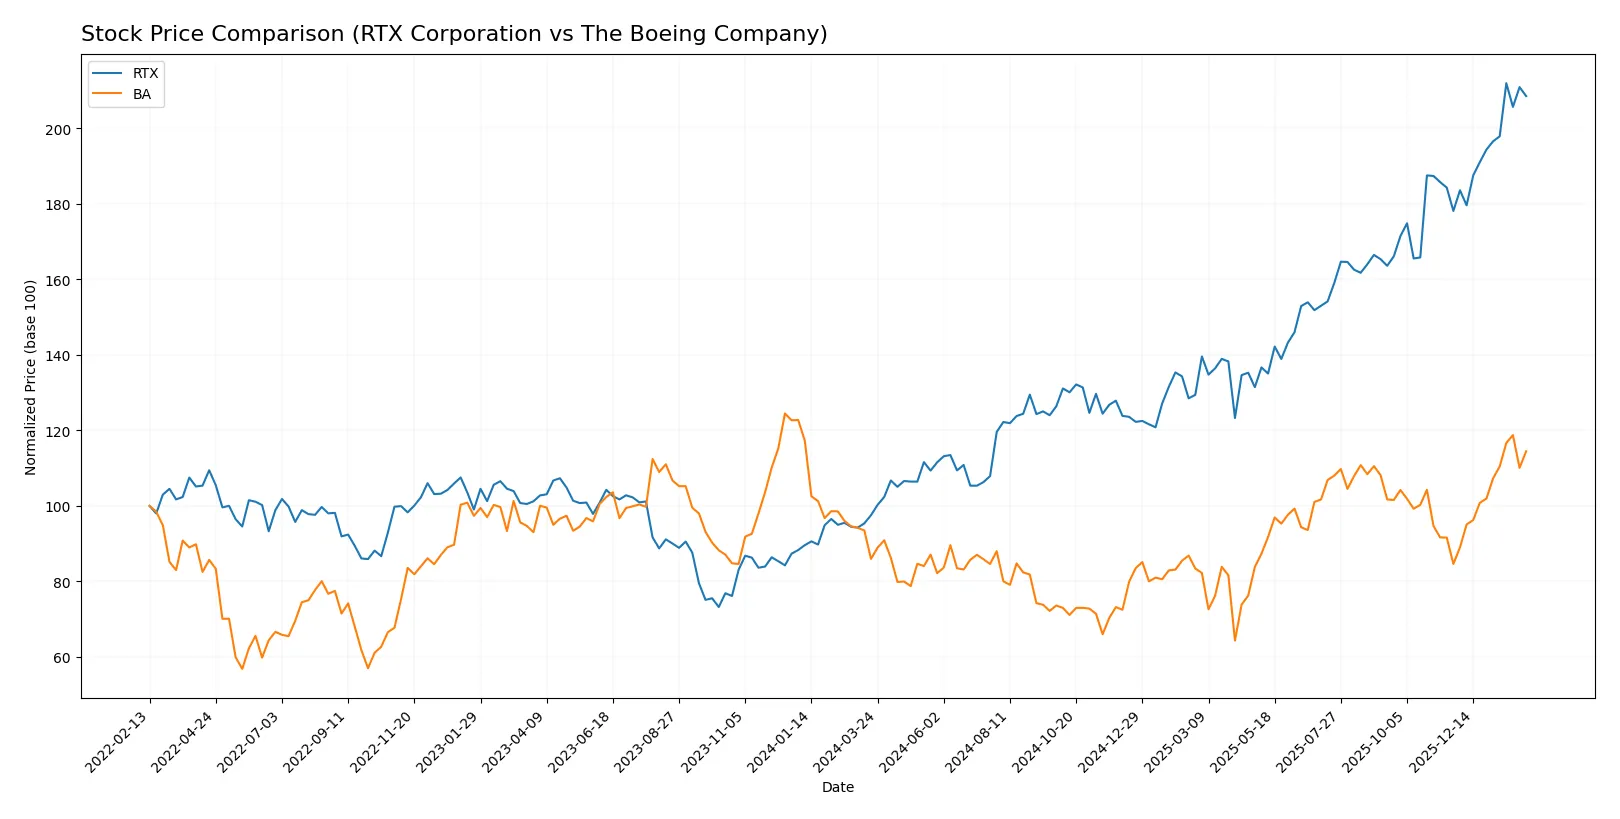
Trend Comparison
RTX Corporation’s stock surged 113.77% over the past year, showing a clear bullish trend with accelerating momentum and a high of 201.92. Volatility is moderate with a standard deviation of 27.67.
The Boeing Company’s stock rose 33.15% over the same period, also bullish with acceleration. It reached a peak of 252.15, and volatility is comparable at a 26.94 standard deviation.
RTX’s return significantly outpaced Boeing’s, delivering the highest market performance in this 12-month span. Both show acceleration, but RTX leads in overall gains.
Target Prices
Analysts present a bullish consensus for RTX Corporation and The Boeing Company, indicating solid upside potential.
| Company | Target Low | Target High | Consensus |
|---|---|---|---|
| RTX Corporation | 168 | 235 | 214.7 |
| The Boeing Company | 150 | 298 | 260.36 |
RTX’s target consensus at 214.7 exceeds its current price of 198.66, suggesting upside near 8%. Boeing’s consensus target of 260.36 implies roughly 7% potential from its 243.03 price.

Don’t Let Luck Decide Your Entry Point
Optimize your entry points with our advanced ProRealTime indicators. You’ll get efficient buy signals with precise price targets for maximum performance. Start outperforming now!
How do institutions grade them?
The following tables summarize recent institutional grades for RTX Corporation and The Boeing Company:
RTX Corporation Grades
This table lists the latest grades and actions from major grading companies for RTX Corporation.
| Grading Company | Action | New Grade | Date |
|---|---|---|---|
| Citigroup | Maintain | Buy | 2026-02-05 |
| UBS | Maintain | Neutral | 2026-01-28 |
| JP Morgan | Maintain | Overweight | 2026-01-28 |
| RBC Capital | Maintain | Outperform | 2026-01-28 |
| Citigroup | Maintain | Buy | 2026-01-13 |
| UBS | Downgrade | Neutral | 2026-01-05 |
| JP Morgan | Maintain | Overweight | 2025-12-19 |
| B of A Securities | Maintain | Buy | 2025-10-27 |
| UBS | Maintain | Buy | 2025-10-22 |
| Goldman Sachs | Maintain | Neutral | 2025-10-22 |
The Boeing Company Grades
This table presents recent grades and actions from reputable grading companies for The Boeing Company.
| Grading Company | Action | New Grade | Date |
|---|---|---|---|
| Jefferies | Maintain | Buy | 2026-02-02 |
| JP Morgan | Maintain | Overweight | 2026-01-28 |
| RBC Capital | Maintain | Outperform | 2026-01-28 |
| Citigroup | Maintain | Buy | 2026-01-28 |
| UBS | Maintain | Buy | 2026-01-28 |
| Bernstein | Maintain | Outperform | 2026-01-15 |
| Citigroup | Maintain | Buy | 2026-01-13 |
| JP Morgan | Maintain | Overweight | 2025-12-19 |
| Susquehanna | Maintain | Positive | 2025-11-12 |
| Freedom Capital Markets | Upgrade | Buy | 2025-11-03 |
Which company has the best grades?
Both companies receive predominantly positive grades, but Boeing shows a higher frequency of “Buy” and “Outperform” ratings recently. This may signal stronger institutional confidence, potentially influencing investor sentiment accordingly.
Risks specific to each company
The following categories identify critical pressure points and systemic threats facing RTX Corporation and The Boeing Company in the 2026 market environment:
1. Market & Competition
RTX Corporation
- Diverse aerospace segments reduce exposure, but intense competition persists, especially in defense and commercial aviation.
The Boeing Company
- Faces strong rivalry in commercial jets and defense, with recent product delays impacting competitiveness.
2. Capital Structure & Debt
RTX Corporation
- Moderate debt levels with favorable interest coverage; balance sheet shows control over leverage.
The Boeing Company
- High debt-to-equity ratio (9.92) and weak interest coverage signal financial risk and refinancing challenges.
3. Stock Volatility
RTX Corporation
- Low beta (0.42) suggests stable stock with limited market sensitivity.
The Boeing Company
- Higher beta (1.14) indicates significant price swings and increased investor risk.
4. Regulatory & Legal
RTX Corporation
- Operates in highly regulated defense and aerospace markets; litigation risk moderate and managed.
The Boeing Company
- Greater exposure to regulatory scrutiny due to recent safety investigations and compliance costs.
5. Supply Chain & Operations
RTX Corporation
- Integrated supply chain with strong operational control; some risk from global parts sourcing.
The Boeing Company
- Supply chain disruptions and production bottlenecks persist, affecting delivery schedules and costs.
6. ESG & Climate Transition
RTX Corporation
- Investing in sustainable aerospace technologies; moderate ESG risks with improving disclosures.
The Boeing Company
- ESG risks elevated due to emissions concerns and slower adaptation to cleaner technologies.
7. Geopolitical Exposure
RTX Corporation
- Global defense contracts diversify geopolitical risks; sensitive to US export restrictions.
The Boeing Company
- Significant international exposure with risks from geopolitical tensions impacting sales and supply.
Which company shows a better risk-adjusted profile?
RTX Corporation’s moderate leverage, low stock volatility, and favorable operational control create a more balanced risk profile. In contrast, Boeing’s high debt, regulatory challenges, and volatile stock price heighten investor risk. RTX’s Altman Z-Score in the grey zone and strong Piotroski score reinforce relative financial stability. Boeing’s distress zone Z-score and weaker financial metrics underscore caution.
The most impactful risk for RTX is competitive pressure in aerospace defense markets. For Boeing, high leverage and regulatory scrutiny present critical threats. RTX’s stable beta (0.42) versus Boeing’s elevated beta (1.14) illustrates the heightened market risk investors face with Boeing today. Overall, RTX offers a better risk-adjusted investment opportunity amid 2026 uncertainties.
Final Verdict: Which stock to choose?
RTX Corporation’s superpower lies in its steadily improving profitability and efficient capital use amid steady market growth. Its growing ROIC signals emerging competitive strength. A point of vigilance is its moderate debt level and stretched valuation multiples. RTX fits well in an Aggressive Growth portfolio seeking upward momentum with manageable risk.
The Boeing Company’s moat is anchored in its entrenched aerospace leadership and strong revenue growth potential. However, its financial leverage and declining ROIC raise caution flags, making it less stable than RTX. BA suits a GARP (Growth at a Reasonable Price) investor who values market position but tolerates operational and financial volatility.
If you prioritize solid profitability growth and improving capital efficiency, RTX outshines BA due to its expanding economic value and cleaner balance sheet. However, if you seek exposure to high-revenue growth in aerospace despite financial risks, BA offers superior growth potential but commands a premium risk profile. Each scenario demands careful risk tolerance and strategic alignment.
Disclaimer: Investment carries a risk of loss of initial capital. The past performance is not a reliable indicator of future results. Be sure to understand risks before making an investment decision.
Go Further
I encourage you to read the complete analyses of RTX Corporation and The Boeing Company to enhance your investment decisions: