Home > Comparison > Industrials > RTX vs TXT
The strategic rivalry between RTX Corporation and Textron Inc. shapes the aerospace and defense sector’s evolution. RTX operates as a diversified industrial powerhouse with advanced aerospace systems and defense technology. Textron, by contrast, combines aviation manufacturing with industrial and finance segments, emphasizing niche defense and specialized vehicles. This head-to-head pits broad-scale innovation against focused diversification. This analysis aims to identify which corporate trajectory offers superior risk-adjusted returns for a balanced, growth-oriented portfolio.
Table of contents
Companies Overview
RTX Corporation and Textron Inc. are key players in the aerospace and defense sector, shaping global markets with distinct strengths.
RTX Corporation: Aerospace & Defense Powerhouse
RTX Corporation dominates with its diversified aerospace and defense portfolio, generating revenue through three main segments: Collins Aerospace, Pratt & Whitney, and Raytheon. It focuses on advanced systems and services for military and commercial customers, emphasizing innovation in aircraft engines, defense technologies, and aftermarket solutions. In 2026, RTX prioritizes expanding its integrated defense capabilities and sustaining leadership in aircraft engine technology.
Textron Inc.: Multifaceted Aerospace & Industrial Innovator
Textron Inc. operates across aircraft, defense, industrial, and finance sectors, with a strong focus on aviation and specialized vehicles. Its revenue comes from manufacturing business jets, military helicopters, unmanned systems, and industrial products like fuel tanks and recreational vehicles. In 2026, Textron advances its strategy of broadening product lines and leveraging finance services to support aircraft sales globally.
Strategic Collision: Similarities & Divergences
Both companies compete fiercely in aerospace and defense but diverge in scope: RTX pursues a high-tech integrated defense and engine strategy, while Textron focuses on diversified aviation and industrial markets. Their primary battleground lies in military and commercial aerospace innovation. RTX appeals as a tech-driven giant with substantial scale; Textron presents a nimble, multi-industry profile with varied revenue streams.
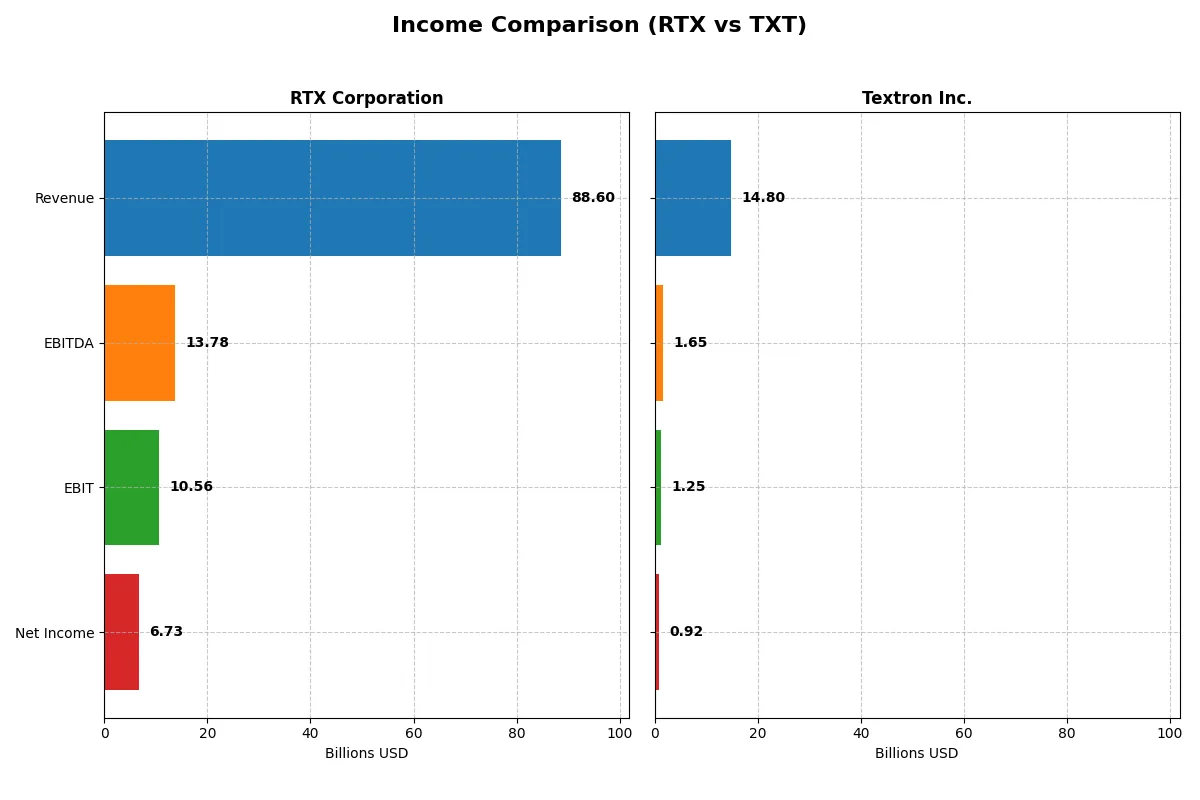
Income Statement Comparison
The following data dissects the core profitability and scalability of both corporate engines to reveal who dominates the bottom line:
| Metric | RTX Corporation (RTX) | Textron Inc. (TXT) |
|---|---|---|
| Revenue | 88.6B | 14.8B |
| Cost of Revenue | 70.8B | 12.3B |
| Operating Expenses | 8.9B | 1.3B |
| Gross Profit | 17.8B | 2.5B |
| EBITDA | 13.8B | 1.6B |
| EBIT | 10.6B | 1.2B |
| Interest Expense | 1.8B | 97M |
| Net Income | 6.7B | 921M |
| EPS | 5.03 | 5.11 |
| Fiscal Year | 2025 | 2025 |
Income Statement Analysis: The Bottom-Line Duel
This income statement comparison unveils the operational efficiency and growth momentum driving each company’s profitability engine.
RTX Corporation Analysis
RTX Corporation displays a strong upward trajectory with revenues rising from 64B in 2021 to 88.6B in 2025. Net income surged from 3.9B to 6.7B, reflecting robust margin expansion. Gross margin improved to 20.1%, and net margin reached 7.6%, showcasing superior cost control and operational leverage in 2025’s strong performance.
Textron Inc. Analysis
Textron Inc. grew revenues steadily from 12.4B in 2021 to 14.8B in 2025. Net income advanced from 746M to 921M, though margin gains were modest. Gross margin held around 16.9% and net margin at 6.2%. The 2025 results show consistent operational efficiency but less margin improvement compared to RTX.
Margin Strength vs. Revenue Scale
RTX clearly leads with higher margins and more significant net income growth, driven by stronger operational efficiency and scale. Textron delivers steady revenue gains but lags on profitability expansion. Investors prioritizing margin resilience and growth momentum will find RTX’s profile more compelling.
Financial Ratios Comparison
These vital ratios act as a diagnostic tool to expose the underlying fiscal health, valuation premiums, and capital efficiency of the companies analyzed:
| Ratios | RTX Corporation (RTX) | Textron Inc. (TXT) |
|---|---|---|
| ROE | 10.3% | 11.7% |
| ROIC | 6.2% | 9.4% |
| P/E | 36.6 | 17.0 |
| P/B | 3.78 | 1.99 |
| Current Ratio | 1.03 | 5.94 |
| Quick Ratio | 0.80 | 2.33 |
| D/E | 0.63 | 0.45 |
| Debt-to-Assets | 24.0% | 19.5% |
| Interest Coverage | 4.86 | 12.9 |
| Asset Turnover | 0.52 | 0.82 |
| Fixed Asset Turnover | 4.72 | 5.71 |
| Payout Ratio | 53.1% | 2.1% |
| Dividend Yield | 1.45% | 0.12% |
| Fiscal Year | 2025 | 2025 |
Efficiency & Valuation Duel: The Vital Signs
Financial ratios act as the company’s DNA, unmasking hidden risks and operational excellence to guide investors’ strategic decisions.
RTX Corporation
RTX shows a neutral 10.3% ROE and a 7.6% net margin, reflecting stable profitability. The stock trades at a stretched P/E of 36.6 and P/B of 3.78, signaling premium valuation. RTX delivers a 1.45% dividend yield, balancing modest shareholder returns with steady reinvestment in R&D (3.2% of revenue).
Textron Inc.
Textron posts a neutral 11.7% ROE and a 6.2% net margin, indicating efficient core profitability. It trades at a reasonable P/E of 17.0 and P/B of 1.99, suggesting fair valuation. The company yields 0.12% dividends, focusing reinvestment on growth and R&D (3.5% of revenue), supporting future expansion.
Premium Valuation vs. Operational Efficiency
RTX commands a higher valuation but offers moderate profitability with dividend income. Textron trades cheaper with better returns on capital and stronger coverage ratios. Investors seeking balanced risk and reward may prefer Textron’s efficient profile, while those valuing income and stability might lean toward RTX.
Which one offers the Superior Shareholder Reward?
I compare RTX Corporation and Textron Inc. on shareholder returns through dividends and buybacks. RTX yields 1.45% with a 53% payout ratio, moderately covered by free cash flow. It pairs dividends with steady buybacks, supporting long-term value. Textron yields a mere 0.12%, with a 2% payout ratio, indicating minimal dividends but robust free cash flow reinvestment. Textron’s aggressive buyback program and strong operating cash flow signal capital allocation favoring growth and shareholder value. Given RTX’s balanced distribution and higher yield versus Textron’s growth-centric model, I find RTX offers a more sustainable and attractive total return profile in 2026.
Comparative Score Analysis: The Strategic Profile
The radar chart reveals the fundamental DNA and trade-offs of RTX Corporation and Textron Inc., highlighting their financial strengths and valuation nuances:
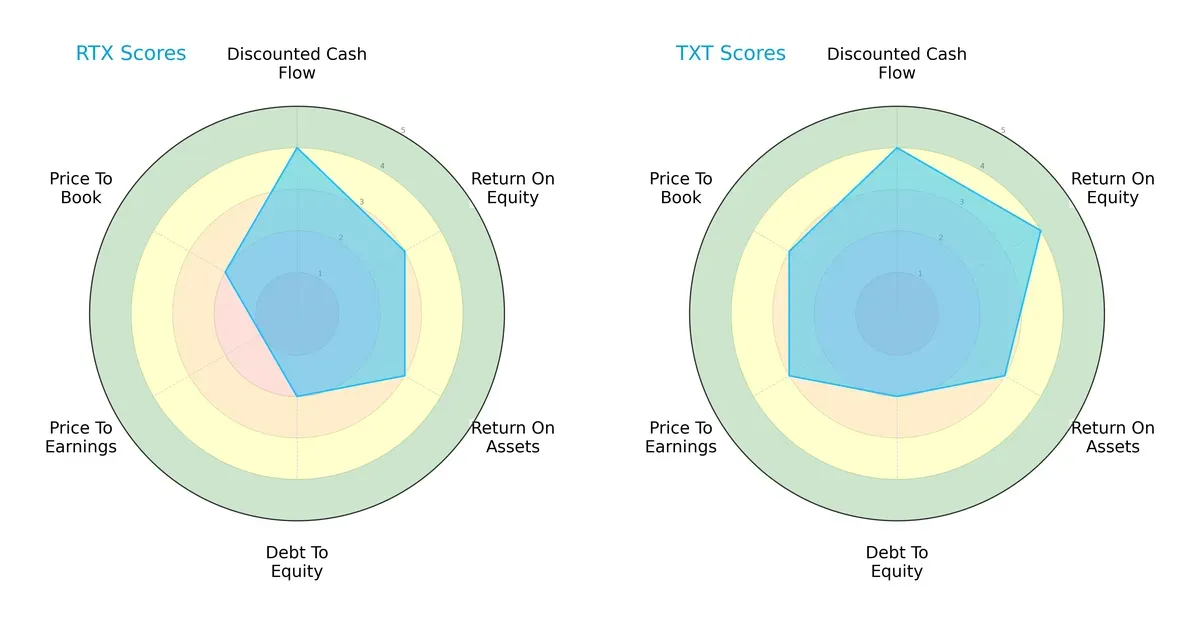
Both companies share a moderate overall score and favorable DCF scores, signaling solid cash flow expectations. Textron edges RTX with a stronger ROE (4 vs. 3) and better valuation metrics (P/E 3 vs. 1; P/B 3 vs. 2), suggesting superior profitability and market pricing. RTX’s moderate ROE and ROA reflect decent asset efficiency, but its very unfavorable P/E score flags potential overvaluation risks. Both have weak debt-to-equity scores, indicating heavier leverage. Textron presents a more balanced financial profile, whereas RTX relies more on its discounted cash flow strength amid valuation challenges.
Bankruptcy Risk: Solvency Showdown
The Altman Z-Scores place both firms in the grey zone, indicating moderate bankruptcy risk in this cycle:
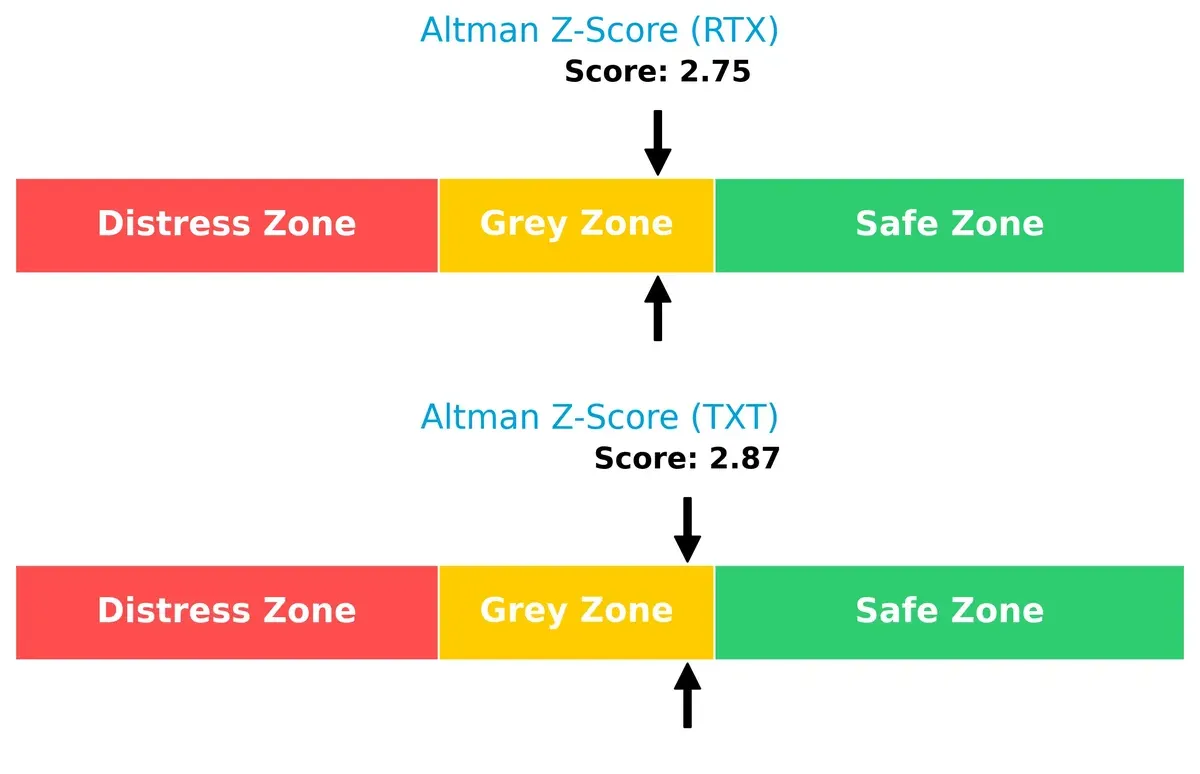
RTX’s score of 2.75 and Textron’s 2.87 imply neither is in immediate danger but both face cautionary solvency pressures. Investors should monitor liquidity and leverage closely as the economic environment tightens.
Financial Health: Quality of Operations
Both RTX and Textron score a 7 on the Piotroski F-Score, reflecting strong operational health:
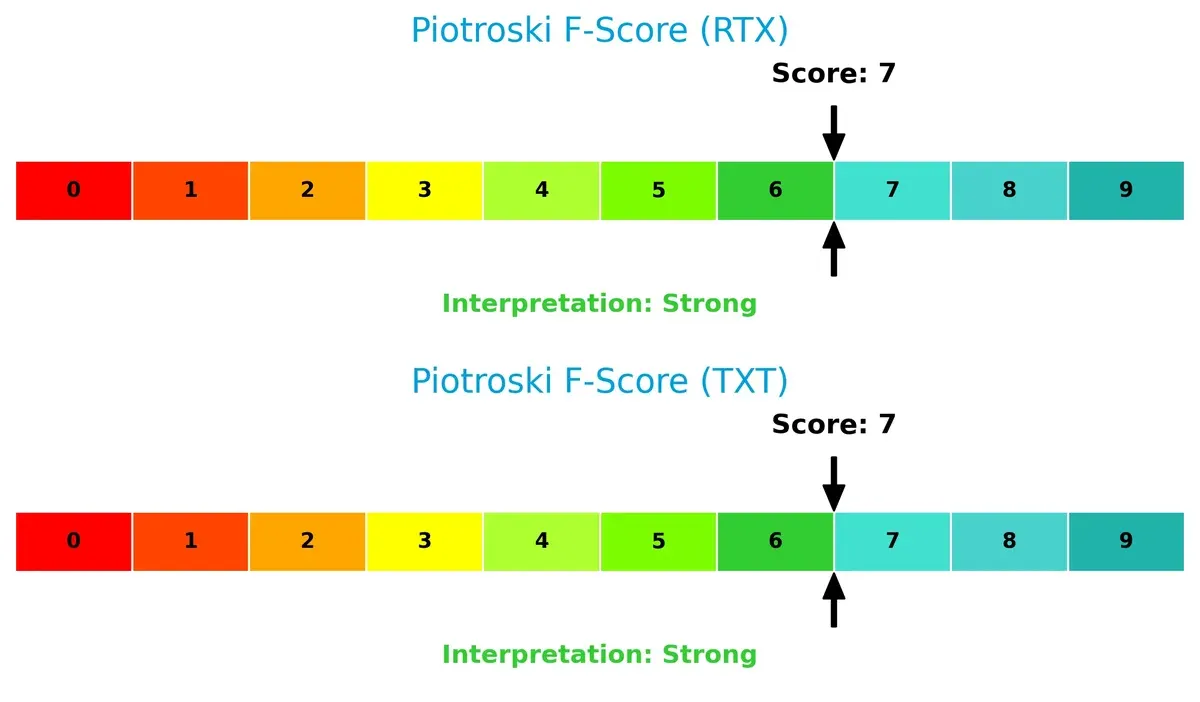
This score signals robust profitability, efficient capital allocation, and solid internal controls for both firms. Neither shows red flags in financial quality, supporting confidence in their ongoing operational resilience.
How are the two companies positioned?
This section dissects RTX and TXT’s operational DNA by comparing their revenue distribution and internal dynamics. The goal is to confront their economic moats to reveal which model offers the most resilient, sustainable competitive edge today.
Revenue Segmentation: The Strategic Mix
This comparison dissects how RTX Corporation and Textron Inc. diversify income streams and reveals their primary sector bets for 2025:
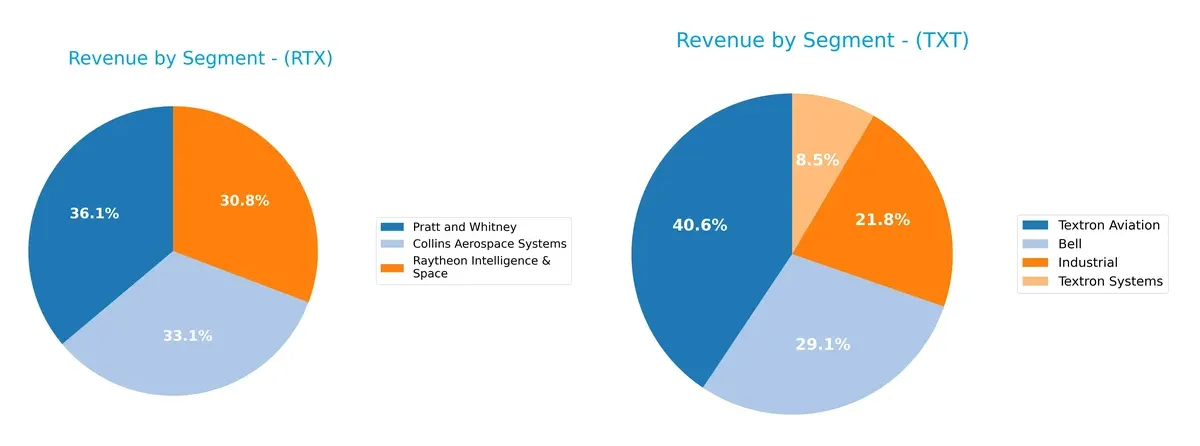
RTX anchors its revenue with Pratt and Whitney at $33B, closely followed by Collins Aerospace at $30.2B and Raytheon Intelligence & Space at $28B. This balance reflects a robust aerospace and defense ecosystem lock-in. Textron leans on Textron Aviation at $6B and Bell at $4.3B but shows more even spread across four segments. RTX’s concentration in aerospace powerhouses dwarfs Textron’s industrial diversification, signaling higher concentration risk but stronger infrastructure dominance.
Strengths and Weaknesses Comparison
This table compares the strengths and weaknesses of RTX Corporation and Textron Inc. based on key financial and market criteria:
RTX Strengths
- Diversified revenue across aerospace systems and intelligence segments
- Slightly favorable cost of capital (WACC 5.32%)
- Strong interest coverage ratio (5.77)
- Favorable fixed asset turnover (4.72)
- Large domestic and global presence with $74.8B domestic revenue
TXT Strengths
- Higher ROIC (9.41%) and strong profitability metrics
- Favorable debt-to-equity and quick ratios indicating liquidity
- Favorable interest coverage (12.84) and fixed asset turnover (5.71)
- More balanced geographic exposure with international revenues
- Lower valuation multiples (PE 17.04, PB 1.99)
RTX Weaknesses
- Unfavorable high valuation multiples (PE 36.64, PB 3.78)
- Quick ratio below 1.0 (0.8), indicating liquidity risk
- Moderate net margin and ROE compared to TXT
- Asset turnover relatively low (0.52)
- Dividend yield moderate at 1.45%
TXT Weaknesses
- Unfavorable very high current ratio (5.94) may indicate inefficient asset use
- Very low dividend yield (0.12%)
- Slightly higher WACC (7.36%)
- Net margin lower than RTX at 6.22%
- Smaller absolute revenue base and less segment diversification
RTX’s strengths lie in its broad aerospace diversification and strong domestic market share, supported by solid capital efficiency. Textron excels in profitability ratios, liquidity, and valuation metrics but faces risks in asset utilization and dividend returns. Each company’s financial profile suggests different strategic focuses in balancing growth, efficiency, and shareholder returns.
The Moat Duel: Analyzing Competitive Defensibility
A structural moat is the only reliable shield protecting long-term profits from relentless competitive erosion. Here’s how RTX Corporation and Textron Inc. stack up:
RTX Corporation: Diversified Aerospace Integration
RTX leverages a broad aerospace portfolio with strong intangible assets and aftermarket services. Its stable margins and 10%+ EBIT margin reflect efficient capital use. Expansion in defense tech could deepen its moat, but ROIC below WACC signals caution in 2026.
Textron Inc.: Focused Niche with Operational Efficiency
Textron’s moat centers on cost advantage and specialized military aviation products. Its ROIC outpaces WACC by over 2%, showing clear value creation. Growth in unmanned systems and advanced marine crafts offers solid runway for market disruption.
Diversification Moat vs. Cost Leadership Moat
Textron’s focused cost advantage delivers a wider moat with consistent value creation, while RTX’s diversification shows promise but sheds value currently. Textron stands better poised to defend and grow market share in 2026.
Which stock offers better returns?
The stock prices of RTX Corporation and Textron Inc. have shown distinct bullish trends over the past year, with RTX accelerating sharply and Textron posting moderate gains.
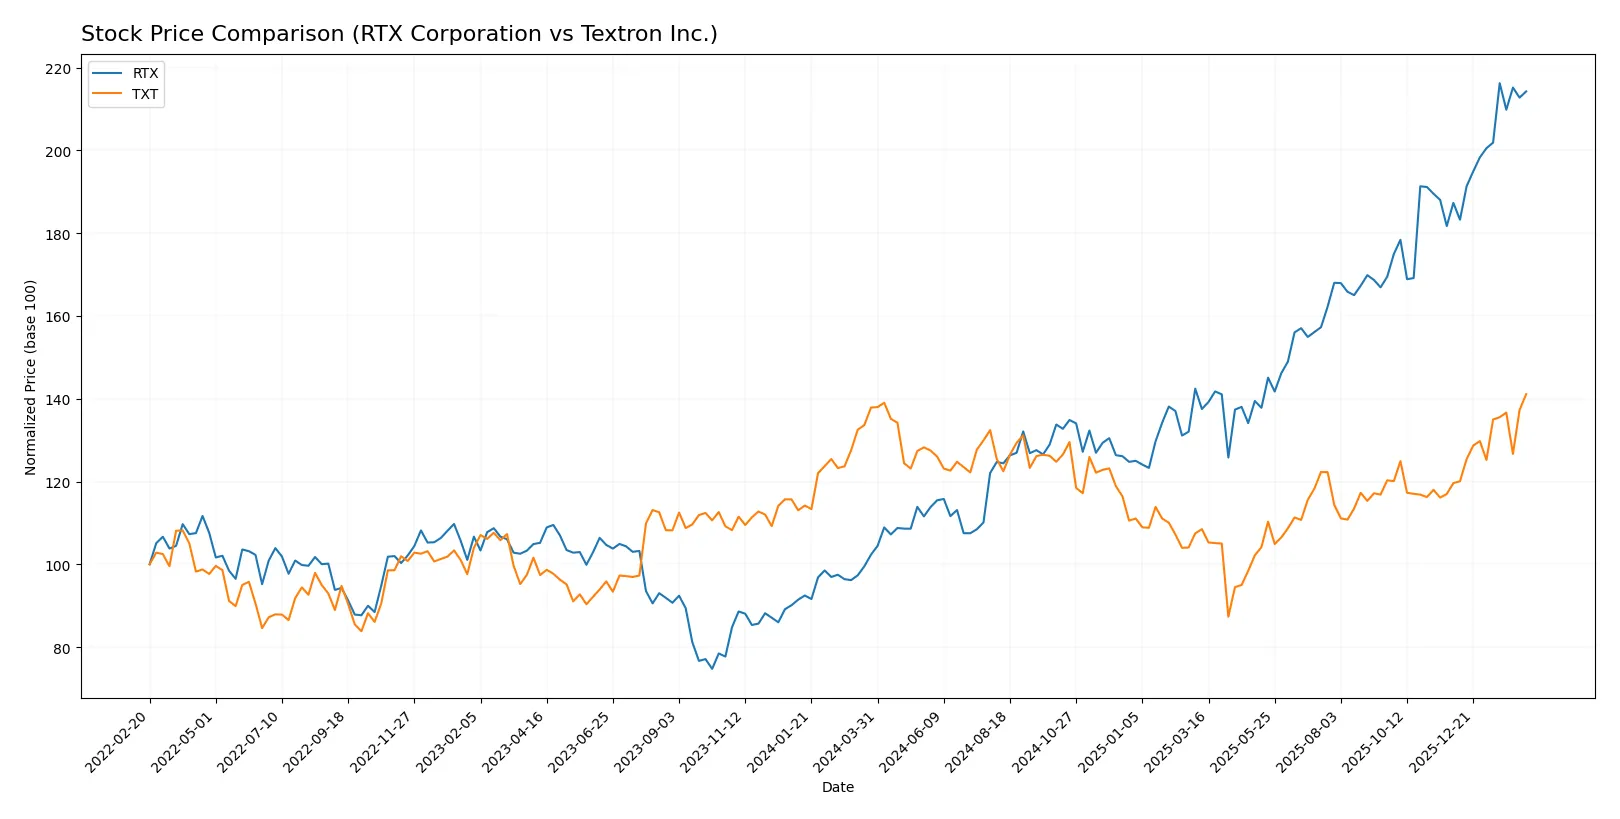
Trend Comparison
RTX Corporation’s stock surged 109.4% over the past 12 months, displaying a strong bullish trend with accelerating momentum and a high volatility of 28.09%. The stock’s price ranged from 95.54 to 201.92, indicating robust upward movement.
Textron Inc. gained 2.34% over the same period, marking a mild bullish trend with acceleration but significantly lower volatility at 7.38%. Its price fluctuated between 60.72 and 98.09, reflecting less dramatic price shifts.
Comparing trends, RTX outperformed Textron with a much higher return and volatility, delivering the strongest market performance over the past year.
Target Prices
Analysts present a clear consensus on target prices for RTX Corporation and Textron Inc., reflecting moderate upside potential.
| Company | Target Low | Target High | Consensus |
|---|---|---|---|
| RTX Corporation | 168 | 235 | 214.7 |
| Textron Inc. | 92 | 110 | 101 |
RTX’s consensus target of 214.7 suggests roughly 7% upside versus the current 200.06 price, indicating cautious optimism. Textron’s target of 101 implies a slight 3% upside from the 98.09 current price, signaling modest growth expectations.

Don’t Let Luck Decide Your Entry Point
Optimize your entry points with our advanced ProRealTime indicators. You’ll get efficient buy signals with precise price targets for maximum performance. Start outperforming now!
How do institutions grade them?
RTX Corporation Grades
The following table summarizes recent grades from major institutions for RTX Corporation.
| Grading Company | Action | New Grade | Date |
|---|---|---|---|
| Citigroup | Maintain | Buy | 2026-02-05 |
| UBS | Maintain | Neutral | 2026-01-28 |
| RBC Capital | Maintain | Outperform | 2026-01-28 |
| JP Morgan | Maintain | Overweight | 2026-01-28 |
| Citigroup | Maintain | Buy | 2026-01-13 |
| UBS | Downgrade | Neutral | 2026-01-05 |
| JP Morgan | Maintain | Overweight | 2025-12-19 |
| B of A Securities | Maintain | Buy | 2025-10-27 |
| UBS | Maintain | Buy | 2025-10-22 |
| Susquehanna | Maintain | Positive | 2025-10-22 |
Textron Inc. Grades
Below are the latest institutional grades for Textron Inc.
| Grading Company | Action | New Grade | Date |
|---|---|---|---|
| Jefferies | Maintain | Buy | 2026-02-02 |
| Citigroup | Maintain | Neutral | 2026-01-29 |
| JP Morgan | Maintain | Neutral | 2026-01-29 |
| UBS | Maintain | Neutral | 2026-01-15 |
| Citigroup | Maintain | Neutral | 2026-01-13 |
| JP Morgan | Maintain | Neutral | 2025-10-27 |
| UBS | Maintain | Neutral | 2025-10-24 |
| TD Cowen | Maintain | Hold | 2025-10-24 |
| Barclays | Maintain | Overweight | 2025-07-29 |
| UBS | Upgrade | Neutral | 2025-07-28 |
Which company has the best grades?
RTX Corporation consistently receives stronger grades, including multiple Buy and Outperform ratings. Textron’s grades cluster around Neutral and Hold, indicating less bullish sentiment. Investors may view RTX as having clearer institutional confidence.
Risks specific to each company
The following categories identify critical pressure points and systemic threats facing both firms in the 2026 market environment:
1. Market & Competition
RTX Corporation
- Operates in a highly competitive aerospace & defense sector with strong government contracts and commercial clients.
Textron Inc.
- Competes across diverse segments including aviation, defense, and industrial markets, facing pressure on innovation and market share.
2. Capital Structure & Debt
RTX Corporation
- Moderate debt-to-equity at 0.63 with favorable interest coverage of 5.77, but slightly unfavorable debt score.
Textron Inc.
- Lower debt-to-equity at 0.45 and strong interest coverage of 12.84 reflect a healthier balance sheet and financial flexibility.
3. Stock Volatility
RTX Corporation
- Low beta at 0.418 indicates defensive stock behavior with less sensitivity to market swings.
Textron Inc.
- Beta near 0.978 shows higher volatility, closely tracking broader market movements.
4. Regulatory & Legal
RTX Corporation
- Faces stringent aerospace and defense regulations, plus export controls affecting international sales.
Textron Inc.
- Navigates complex compliance across aviation, defense, and industrial products with exposure to U.S. and global regulations.
5. Supply Chain & Operations
RTX Corporation
- Large global footprint with complex supply chains vulnerable to geopolitical tensions and material cost inflation.
Textron Inc.
- Operations span multiple industries, risking disruption in raw materials and component availability.
6. ESG & Climate Transition
RTX Corporation
- Under pressure to reduce carbon footprint in jet engines and aerospace manufacturing amid increasing ESG scrutiny.
Textron Inc.
- Faces challenges adapting industrial and aviation segments to evolving climate regulations and sustainability demands.
7. Geopolitical Exposure
RTX Corporation
- Significant international defense contracts expose it to geopolitical risks and export restrictions.
Textron Inc.
- Global operations in defense and aviation expose it to geopolitical uncertainties but with diversified revenue streams.
Which company shows a better risk-adjusted profile?
RTX’s primary risk lies in complex regulatory and geopolitical challenges inherent in its size and global defense contracts. Textron faces operational risks from supply chain complexity but benefits from a stronger balance sheet and higher financial stability scores. Textron’s higher interest coverage and lower debt-to-equity ratio improve its risk-adjusted standing. RTX’s low beta offers defensive qualities, yet its unfavorable price multiples and debt scores weigh on risk. Textron’s diversified segments and healthier liquidity foster resilience, making it the better risk-adjusted choice in 2026.
Final Verdict: Which stock to choose?
RTX Corporation’s superpower lies in its accelerating profitability and robust income growth. It steadily improves its return metrics despite a challenging capital structure. The key point of vigilance is its relatively high valuation multiples, which could temper upside. RTX fits an aggressive growth portfolio willing to embrace cyclical aerospace dynamics.
Textron Inc. leverages a strong and sustainable economic moat with a clear value-creating return on invested capital. Its conservative debt profile and superior liquidity offer better balance-sheet safety than RTX. Textron appeals to investors seeking GARP (Growth at a Reasonable Price) exposure with a focus on capital efficiency.
If you prioritize rapid earnings expansion and can tolerate valuation risk, RTX stands out due to its compelling growth momentum. However, if you seek stable value creation with stronger financial resilience, Textron offers better stability and a durable competitive advantage. Both present slightly favorable profiles, but your investor avatar dictates the preferred exposure.
Disclaimer: Investment carries a risk of loss of initial capital. The past performance is not a reliable indicator of future results. Be sure to understand risks before making an investment decision.
Go Further
I encourage you to read the complete analyses of RTX Corporation and Textron Inc. to enhance your investment decisions: