The TJX Companies, Inc. and Ross Stores, Inc. are two leading players in the off-price retail apparel and home fashions sector, each with a strong footprint in the U.S. and international markets. Both companies focus on delivering value through discounted brand-name merchandise, making them direct competitors with overlapping customer bases. This comparison explores their business models, innovation strategies, and market positions to help you decide which company holds the most promise for your investment portfolio.

Table of contents
Companies Overview
I will begin the comparison between The TJX Companies, Inc. and Ross Stores, Inc. by providing an overview of these two companies and their main differences.
The TJX Companies, Inc. Overview
The TJX Companies, Inc. operates as an off-price apparel and home fashions retailer, serving customers through multiple segments including Marmaxx, HomeGoods, and international subsidiaries. With a diverse product range from family apparel to home basics and gourmet food, it maintains a strong market presence with over 4,000 stores worldwide. Founded in 1962 and headquartered in Framingham, Massachusetts, TJX serves a broad consumer base with a focus on value and variety.
Ross Stores, Inc. Overview
Ross Stores, Inc. operates off-price retail apparel and home fashion stores primarily under the Ross Dress for Less and dd’s DISCOUNTS brands. It targets middle to moderate income households with a focus on apparel, accessories, and home fashions. Founded in 1957 and based in Dublin, California, Ross manages approximately 1,950 stores across 40 states and territories, emphasizing affordability and accessibility within the U.S. market.
Key similarities and differences
Both TJX and Ross operate in the off-price retail sector, offering apparel and home fashions at discounted prices. While TJX has a larger global footprint with diversified segments and international operations, Ross focuses on the U.S. market with its two main brands. TJX’s broader product range and store count contrast with Ross’s more concentrated domestic presence, reflecting differing strategies within the same industry.
Income Statement Comparison
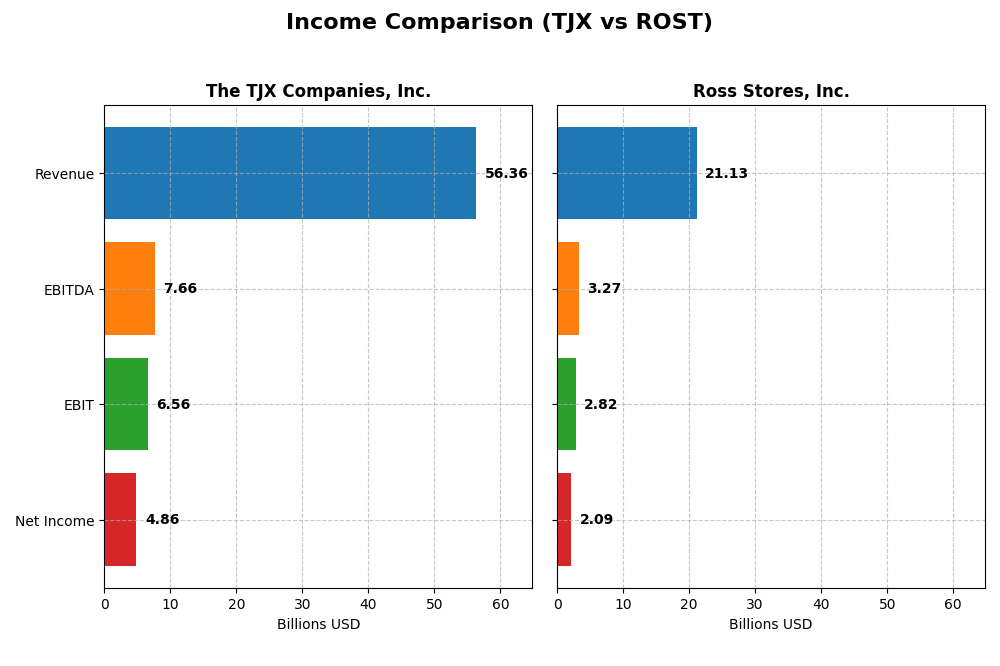
This table presents a side-by-side comparison of key income statement metrics for The TJX Companies, Inc. and Ross Stores, Inc. based on their most recent fiscal year results.
| Metric | The TJX Companies, Inc. (TJX) | Ross Stores, Inc. (ROST) |
|---|---|---|
| Market Cap | 176B | 62.3B |
| Revenue | 56.36B | 21.13B |
| EBITDA | 7.66B | 3.27B |
| EBIT | 6.56B | 2.82B |
| Net Income | 4.86B | 2.09B |
| EPS | 4.31 | 6.36 |
| Fiscal Year | 2025 | 2024 |
Income Statement Interpretations
The TJX Companies, Inc.
The TJX Companies, Inc. showed strong revenue growth from 2021 to 2025, increasing from $32.1B to $56.4B, with net income rising sharply from $90M to $4.86B. Margins improved notably, with gross margin at 30.6% and net margin at 8.63% in 2025. The latest year’s growth slowed slightly in revenue but saw favorable EBIT and EPS gains, indicating improved profitability.
Ross Stores, Inc.
Ross Stores, Inc. experienced steady revenue growth from $12.5B in 2020 to $21.1B in 2024, alongside net income growth from $85M to $2.09B. Margins remained favorable, with a gross margin of 27.78% and a net margin near 9.89% in the most recent fiscal year. The 2024 performance displayed solid EBIT and net margin growth, supported by efficient operating expenses relative to revenue.
Which one has the stronger fundamentals?
Both companies exhibit favorable income statement fundamentals with strong revenue and net income growth over their respective periods. TJX leads in absolute revenue and net income, with higher margin improvements and exceptional EPS growth. Ross shows excellent margin stability and efficiency with a slightly higher net margin and more consistent operating expense control. The decision depends on investor focus between scale and margin efficiency.
Financial Ratios Comparison
The table below presents key financial ratios for The TJX Companies, Inc. (TJX) and Ross Stores, Inc. (ROST) based on their most recent fiscal year data, allowing for a straightforward comparison.
| Ratios | The TJX Companies, Inc. (TJX) | Ross Stores, Inc. (ROST) |
|---|---|---|
| ROE | 57.95% | 37.95% |
| ROIC | 21.13% | 16.83% |
| P/E | 28.94 | 23.66 |
| P/B | 16.77 | 8.98 |
| Current Ratio | 1.18 | 1.62 |
| Quick Ratio | 0.60 | 1.09 |
| D/E (Debt-to-Equity) | 1.52 | 1.03 |
| Debt-to-Assets | 40.25% | 38.12% |
| Interest Coverage | 82.92 | 40.79 |
| Asset Turnover | 1.78 | 1.42 |
| Fixed Asset Turnover | 3.32 | 2.98 |
| Payout Ratio | 33.88% | 23.38% |
| Dividend Yield | 1.17% | 0.99% |
Interpretation of the Ratios
The TJX Companies, Inc.
TJX shows a mixed ratio profile with strong returns on equity (57.95%) and invested capital (21.13%), indicating efficient capital use. However, valuation metrics like P/E (28.94) and P/B (16.77) ratios appear high, which might concern value-focused investors. Its dividend yield is moderate at 1.17%, supported by stable payouts and manageable risks without excessive repurchases.
Ross Stores, Inc.
Ross Stores presents solid profitability with a 37.95% ROE and 16.83% ROIC, though these are lower than TJX’s. Liquidity ratios are healthier, including a current ratio of 1.62 and quick ratio of 1.09, signaling good short-term financial stability. Its dividend yield is slightly lower at 0.99%, reflecting conservative shareholder returns and no evident payout risks.
Which one has the best ratios?
Both companies have a slightly favorable ratio profile with 42.86% favorable ratios, yet TJX’s higher returns on equity and capital are offset by less attractive valuation and liquidity metrics. Ross shows better liquidity and lower valuation concerns but delivers lower profitability. The choice depends on investor priorities between efficiency and financial conservatism.
Strategic Positioning
This section compares the strategic positioning of The TJX Companies, Inc. and Ross Stores, Inc. including market position, key segments, and exposure to technological disruption:
The TJX Companies, Inc.
- Leading off-price retailer with large scale and multiple brands; faces competitive retail pressures.
- Diversified segments: Marmaxx, HomeGoods, TJX Canada, TJX International drive revenue growth.
- No explicit mention of technological disruption exposure or initiatives in available data.
Ross Stores, Inc.
- Off-price retailer focused on discount apparel with fewer brands; competes in mid-income retail.
- Concentrated on apparel and home accents via Ross Dress for Less and dd’s DISCOUNTS brands.
- No explicit mention of technological disruption exposure or initiatives in available data.
The TJX Companies, Inc. vs Ross Stores, Inc. Positioning
TJX operates a diversified business model with multiple segments and international presence, offering broader revenue streams. Ross focuses on a concentrated apparel and home fashion segment aimed at moderate-income households, limiting diversification but focusing on specific customer bases.
Which has the best competitive advantage?
Both companies show a very favorable moat with growing ROIC above WACC, indicating durable competitive advantages and increasing profitability based on efficient capital use and strong value creation.
Stock Comparison
The past year has seen significant bullish movements for both The TJX Companies, Inc. and Ross Stores, Inc., with accelerating trends and notable price gains highlighting dynamic trading activity.

Trend Analysis
The TJX Companies, Inc. experienced a 60.96% price increase over the past 12 months, marking a bullish trend with accelerating momentum and a high volatility level, reflected by a standard deviation of 15.86.
Ross Stores, Inc. showed a 32.87% price rise over the same period, also bullish and accelerating, but with lower volatility at a 13.0 standard deviation compared to TJX.
Comparing both, TJX delivered the highest market performance with a stronger overall price appreciation, despite Ross Stores exhibiting a steeper recent trend slope and higher buyer dominance in volume.
Target Prices
The consensus target prices from verified analysts show promising upside potential for both The TJX Companies, Inc. and Ross Stores, Inc.
| Company | Target High | Target Low | Consensus |
|---|---|---|---|
| The TJX Companies, Inc. | 193 | 150 | 170.33 |
| Ross Stores, Inc. | 221 | 160 | 193.6 |
Analysts expect TJX shares to rise moderately above the current price of $157.81, while Ross Stores could see a notable increase from its current $191.44 level. Both show favorable outlooks with upside potential near 10–15%.
Analyst Opinions Comparison
This section compares analysts’ ratings and financial scores for The TJX Companies, Inc. (TJX) and Ross Stores, Inc. (ROST):
Rating Comparison
TJX Rating
- Rating: B, classified as Very Favorable by analysts.
- Discounted Cash Flow Score: 3, indicating a moderate valuation status.
- Return on Equity Score: 5, reflecting very favorable profit generation.
- Return on Assets Score: 5, showing very efficient asset utilization.
- Debt To Equity Score: 1, indicating a very unfavorable financial risk level.
- Overall Score: 3, representing a moderate overall financial standing.
ROST Rating
- Rating: B+, also considered Very Favorable.
- Discounted Cash Flow Score: 3, indicating a moderate valuation status.
- Return on Equity Score: 5, reflecting very favorable profit generation.
- Return on Assets Score: 5, showing very efficient asset utilization.
- Debt To Equity Score: 2, indicating a moderate financial risk level.
- Overall Score: 3, representing a moderate overall financial standing.
Which one is the best rated?
ROST holds a slightly higher rating of B+ versus TJX’s B, both rated Very Favorable. While both share identical overall and profitability scores, ROST’s moderate debt-to-equity score contrasts with TJX’s very unfavorable financial risk rating, making ROST the better-rated stock by analysts.
Scores Comparison
Here is a comparison of the financial scores for The TJX Companies, Inc. and Ross Stores, Inc.:
TJX Scores
- Altman Z-Score: 6.73, indicating a safe zone from bankruptcy risk.
- Piotroski Score: 7, reflecting strong financial health.
ROST Scores
- Altman Z-Score: 6.24, also signaling a safe zone from bankruptcy risk.
- Piotroski Score: 7, reflecting strong financial health.
Which company has the best scores?
Both TJX and ROST have Altman Z-Scores well above 3, placing them in the safe zone, and identical Piotroski Scores of 7, indicating strong financial health. TJX has a slightly higher Altman Z-Score than ROST.
Grades Comparison
Here is a comparison of the recent grades assigned to The TJX Companies, Inc. and Ross Stores, Inc.:
The TJX Companies, Inc. Grades
The following table shows recent grades from credible grading companies for The TJX Companies, Inc.:
| Grading Company | Action | New Grade | Date |
|---|---|---|---|
| UBS | Maintain | Buy | 2026-01-08 |
| Wells Fargo | Maintain | Equal Weight | 2025-12-16 |
| Barclays | Maintain | Overweight | 2025-12-04 |
| Telsey Advisory Group | Maintain | Outperform | 2025-12-04 |
| Baird | Maintain | Outperform | 2025-12-04 |
| Barclays | Maintain | Overweight | 2025-11-20 |
| BTIG | Maintain | Buy | 2025-11-20 |
| JP Morgan | Maintain | Overweight | 2025-11-20 |
| B of A Securities | Maintain | Buy | 2025-11-20 |
| Goldman Sachs | Maintain | Buy | 2025-11-20 |
Overall, TJX has consistently received positive grades, predominantly “Buy,” “Overweight,” and “Outperform,” indicating strong analyst confidence.
Ross Stores, Inc. Grades
The following table presents recent grades from reputable grading firms for Ross Stores, Inc.:
| Grading Company | Action | New Grade | Date |
|---|---|---|---|
| UBS | Maintain | Neutral | 2026-01-08 |
| Wells Fargo | Maintain | Overweight | 2025-12-16 |
| Baird | Maintain | Outperform | 2025-11-21 |
| UBS | Maintain | Neutral | 2025-11-21 |
| Evercore ISI Group | Maintain | Outperform | 2025-11-21 |
| Telsey Advisory Group | Maintain | Market Perform | 2025-11-21 |
| B of A Securities | Maintain | Buy | 2025-11-21 |
| Barclays | Maintain | Overweight | 2025-11-21 |
| JP Morgan | Maintain | Overweight | 2025-11-21 |
| Bernstein | Maintain | Market Perform | 2025-11-21 |
Ross Stores shows a mixed pattern with grades ranging from “Buy” and “Outperform” to more cautious “Neutral” and “Market Perform.”
Which company has the best grades?
The TJX Companies, Inc. has received stronger and more consistent positive grades compared to Ross Stores, Inc., whose ratings show more variability and some neutral stances. For investors, this may imply a higher analyst confidence level in TJX’s outlook relative to Ross Stores.
Strengths and Weaknesses
Below is a comparison of key strengths and weaknesses for The TJX Companies, Inc. (TJX) and Ross Stores, Inc. (ROST) based on the most recent data.
| Criterion | The TJX Companies, Inc. (TJX) | Ross Stores, Inc. (ROST) |
|---|---|---|
| Diversification | Broad product range with strong international segments including HomeGoods, Marmaxx, Canada, and International divisions | Focused product categories such as apparel, accessories, and home accents, with less international presence |
| Profitability | High ROIC of 21.13% with strong ROE at 57.95%, indicating efficient capital use and value creation | Solid ROIC of 16.83% and ROE of 37.95%, also creating value but at a slightly lower scale |
| Innovation | Demonstrates durable competitive advantage with very favorable moat and growing profitability | Also has a very favorable moat with growing ROIC, but innovation scope appears narrower |
| Global presence | Strong international presence contributing over $7B in revenue from TJX International segment | Limited international exposure, primarily focused on U.S. markets |
| Market Share | Large market share with diversified geographic and product reach | Strong within its niche discount retail market but less diversified |
Key takeaways: TJX stands out for its broader diversification and stronger global footprint, coupled with superior profitability metrics. ROST maintains a durable competitive advantage with solid profitability but is more concentrated in product range and geography, which could limit growth opportunities compared to TJX. Both companies show strong value creation and growing returns on invested capital.
Risk Analysis
Below is a comparison of key risks for The TJX Companies, Inc. (TJX) and Ross Stores, Inc. (ROST) as of the most recent fiscal years.
| Metric | The TJX Companies, Inc. (TJX) | Ross Stores, Inc. (ROST) |
|---|---|---|
| Market Risk | Beta 0.75 (lower volatility) | Beta 1.01 (market average) |
| Debt level | Debt-to-Equity 1.52 (high) | Debt-to-Equity 1.03 (moderate) |
| Regulatory Risk | Moderate; retail regulations | Moderate; retail regulations |
| Operational Risk | High; large store network complexity | Moderate; fewer stores, simpler operations |
| Environmental Risk | Moderate; sustainability efforts ongoing | Moderate; gradual ESG integration |
| Geopolitical Risk | Low; mostly US and Western markets | Low; primarily US market presence |
TJX’s higher leverage and operational complexity pose notable risks, despite a stable market beta. Ross Stores shows moderate debt and market risk but benefits from a leaner operation. Debt levels and operational risks are the most impactful factors to monitor for these retailers in 2026.
Which Stock to Choose?
The TJX Companies, Inc. shows a favorable income statement with strong revenue and net income growth over 2021-2025, a very favorable return on equity (58%) and invested capital (21%), but some unfavorable valuation ratios and higher debt levels. Its competitive moat is very favorable with a growing ROIC well above WACC, indicating durable value creation.
Ross Stores, Inc. exhibits a favorable income statement with steady growth and a slightly higher net margin (9.9%) than TJX, solid return on equity (38%) and invested capital (17%), better liquidity ratios, and moderate debt levels. Its competitive moat is also very favorable due to a growing ROIC exceeding WACC, signaling efficient capital use.
Investors seeking strong growth and high profitability might find TJX’s robust ROE and expanding economic moat appealing, while those prioritizing liquidity and stability may view Ross Stores’ healthier balance sheet and consistent margin growth as advantageous. Both companies present slightly favorable financial ratios and strong economic moats, suggesting their suitability depends on individual risk tolerance and investment focus.
Disclaimer: Investment carries a risk of loss of initial capital. The past performance is not a reliable indicator of future results. Be sure to understand risks before making an investment decision.
Go Further
I encourage you to read the complete analyses of The TJX Companies, Inc. and Ross Stores, Inc. to enhance your investment decisions: