Home > Comparison > Industrials > ROP vs XYL
The strategic rivalry between Roper Technologies, Inc. and Xylem Inc. shapes the competitive landscape of the industrial machinery sector. Roper operates as a diversified technology-driven solutions provider, blending software and engineered products. In contrast, Xylem focuses on water-centric engineered systems with strong infrastructure orientation. This analysis evaluates their differing growth models to identify which offers superior risk-adjusted returns for a diversified industrial portfolio in 2026.
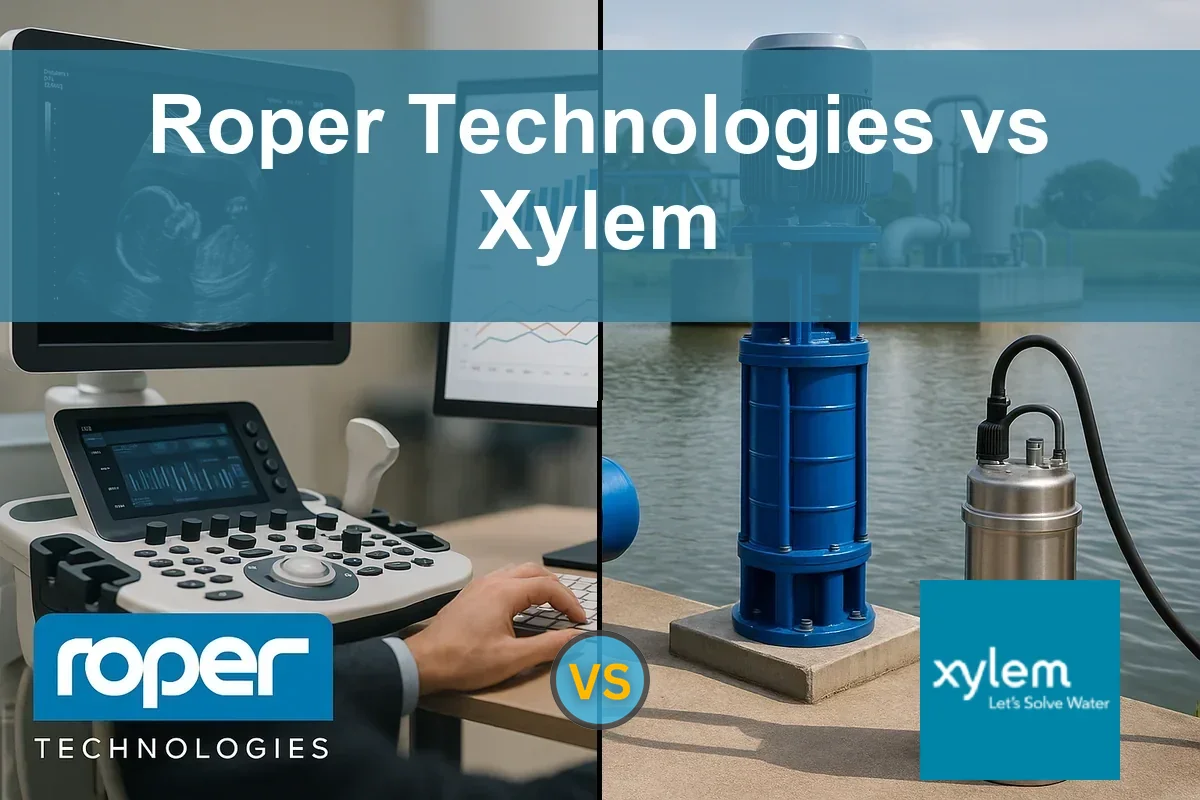
Table of contents
Companies Overview
Roper Technologies and Xylem stand as key industrial machinery players shaping essential infrastructure sectors.
Roper Technologies, Inc.: Diverse Industrial Software & Equipment Leader
Roper Technologies commands the industrial machinery sector with a diverse portfolio spanning software and engineered products. Its core revenue flows from cloud-based management software, diagnostic tools, and precision instruments across multiple industries. In 2026, Roper emphasizes expanding cloud analytics and specialized equipment, reinforcing its competitive advantage in technology-driven industrial solutions.
Xylem Inc.: Water Technology and Infrastructure Specialist
Xylem Inc. focuses on engineered products for water and wastewater treatment, delivering innovative pumps, controls, and smart measurement solutions. Its revenue primarily derives from Water Infrastructure and Applied Water segments, coupled with advanced analytics and asset management services. Xylem’s 2026 strategy centers on enhancing digital water management and expanding its global footprint in sustainable water solutions.
Strategic Collision: Similarities & Divergences
Both companies target industrial machinery but differ strategically: Roper pursues a broad technology-driven platform, while Xylem concentrates on a water-centric ecosystem. They compete chiefly in infrastructure and operational efficiency markets. Roper’s diversified software-heavy model contrasts with Xylem’s focused water infrastructure innovation, defining distinct risk-return profiles for investors seeking industrial exposure.
Income Statement Comparison
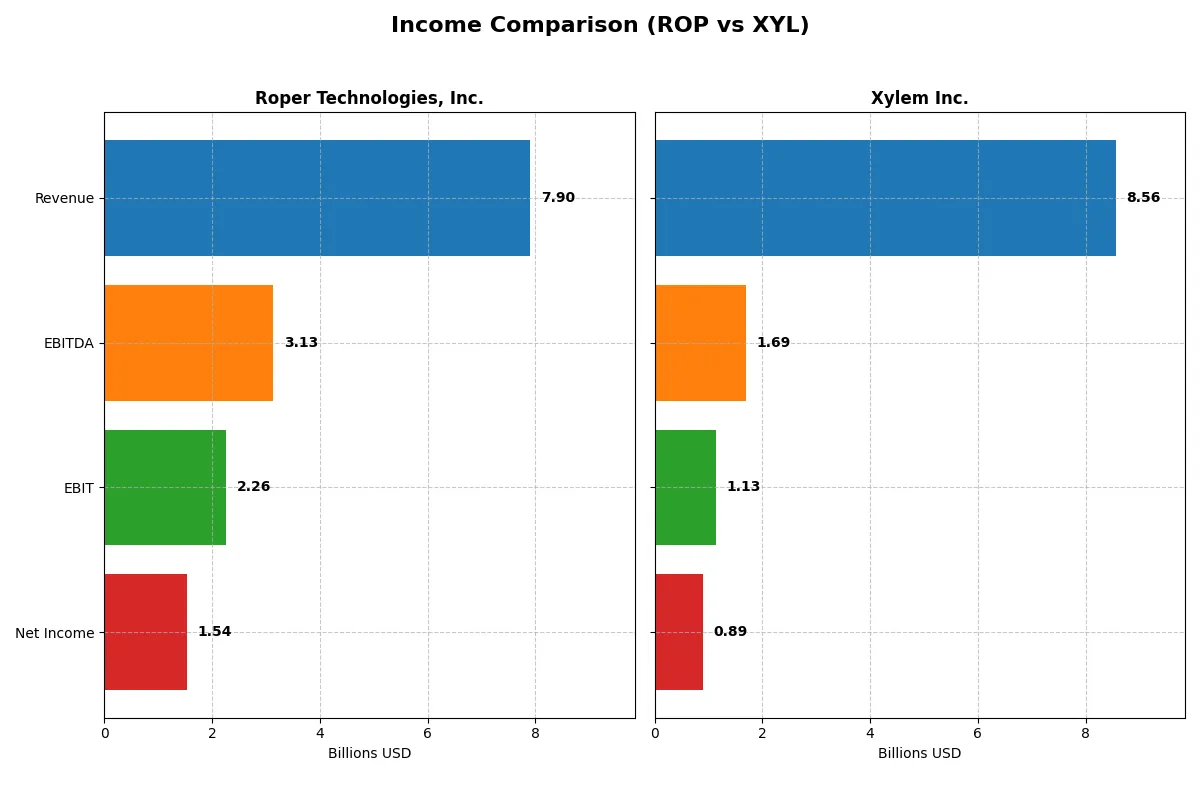
This data dissects the core profitability and scalability of both corporate engines to reveal who dominates the bottom line:
| Metric | Roper Technologies, Inc. (ROP) | Xylem Inc. (XYL) |
|---|---|---|
| Revenue | 7.90B | 8.56B |
| Cost of Revenue | 2.43B | 5.35B |
| Operating Expenses | 3.24B | 2.20B |
| Gross Profit | 5.47B | 3.21B |
| EBITDA | 3.13B | 1.69B |
| EBIT | 2.26B | 1.13B |
| Interest Expense | 325M | 44M |
| Net Income | 1.54B | 890M |
| EPS | 14.31 | 3.67 |
| Fiscal Year | 2025 | 2024 |
Income Statement Analysis: The Bottom-Line Duel
The income statement comparison reveals each company’s operational efficiency and profit generation over recent years.
Roper Technologies, Inc. Analysis
Roper’s revenue grew steadily from $4.8B in 2021 to $7.9B in 2025, with net income climbing from $1.1B to $1.5B. Its gross margin remains robust at 69.2%, signaling strong cost control. However, net margin slipped slightly to 19.4% in 2025. Operating expenses grew in line with revenue, showing consistent but cautious efficiency.
Xylem Inc. Analysis
Xylem posted revenue growth from $5.2B in 2021 to $8.6B in 2024, with net income surging from $427M to $890M. Gross margin holds at a favorable 37.5%, while net margin improved to 10.4%. Operating leverage improved sharply in 2024, driving EBIT and net income growth over 25%, reflecting accelerating profitability and scalable cost management.
Margin Strength vs. Earnings Momentum
Roper delivers superior margins and stable net income growth, demonstrating disciplined operational control. Xylem, meanwhile, shows faster top- and bottom-line growth with expanding margins, indicating rising operational leverage. For investors, Roper’s profile suits those prioritizing margin stability, while Xylem appeals to growth-focused portfolios chasing momentum.
Financial Ratios Comparison
These vital ratios act as a diagnostic tool to expose the underlying fiscal health, valuation premiums, and capital efficiency of the companies compared below:
| Ratios | Roper Technologies, Inc. (ROP) | Xylem Inc. (XYL) |
|---|---|---|
| ROE | 7.7% | 8.4% |
| ROIC | 5.6% | 5.8% |
| P/E | 31.1 | 31.6 |
| P/B | 2.4 | 2.6 |
| Current Ratio | 0.52 | 1.75 |
| Quick Ratio | 0.48 | 1.33 |
| D/E | 0.47 | 0.20 |
| Debt-to-Assets | 27.0% | 12.9% |
| Interest Coverage | 6.9 | 22.9 |
| Asset Turnover | 0.23 | 0.52 |
| Fixed Asset Turnover | 50.4 | 7.4 |
| Payout ratio | 23.1% | 39.3% |
| Dividend yield | 0.74% | 1.24% |
| Fiscal Year | 2025 | 2024 |
Efficiency & Valuation Duel: The Vital Signs
Financial ratios serve as a company’s DNA, exposing hidden risks and operational strengths essential for investor decision-making.
Roper Technologies, Inc.
ROP shows a modest ROE of 7.73% with a strong net margin of 19.44%, signaling operational efficiency but subdued shareholder returns. The P/E ratio at 31.06 suggests the stock trades at a premium, while dividends yield a low 0.74%. The company appears to reinvest earnings cautiously, balancing growth and risk.
Xylem Inc.
XYL delivers a slightly higher ROE of 8.36% but with a lower net margin of 10.39%, indicating moderate profitability. Its P/E ratio of 31.63 is similarly stretched, but stronger liquidity ratios and a 1.24% dividend yield support shareholder returns. The firm maintains a conservative debt profile with favorable interest coverage.
Premium Valuation vs. Operational Safety
ROP offers higher operational margins but weaker liquidity and a lower dividend yield, creating a riskier profile. XYL balances profitability with stronger current ratios and shareholder income, presenting a more stable risk-reward tradeoff. Investors seeking income and financial safety may prefer XYL’s profile.
Which one offers the Superior Shareholder Reward?
I observe Roper Technologies (ROP) maintains a modest 0.74% dividend yield with a sustainable payout ratio near 23%. Its free cash flow covers dividends 6.3x, supporting steady distributions. ROP also executes aggressive buybacks, enhancing total returns. Xylem (XYL) offers a higher 1.24% yield but pays out nearly 40% of earnings, stressing cash flow coverage at 1.9x. XYL’s buybacks are less intense, limiting total shareholder return. ROP’s balanced dividend and share repurchase strategy delivers a more durable and attractive total return profile in 2026.
Comparative Score Analysis: The Strategic Profile
The radar chart reveals the fundamental DNA and trade-offs of Roper Technologies, Inc. and Xylem Inc., highlighting their strategic financial strengths and weaknesses:
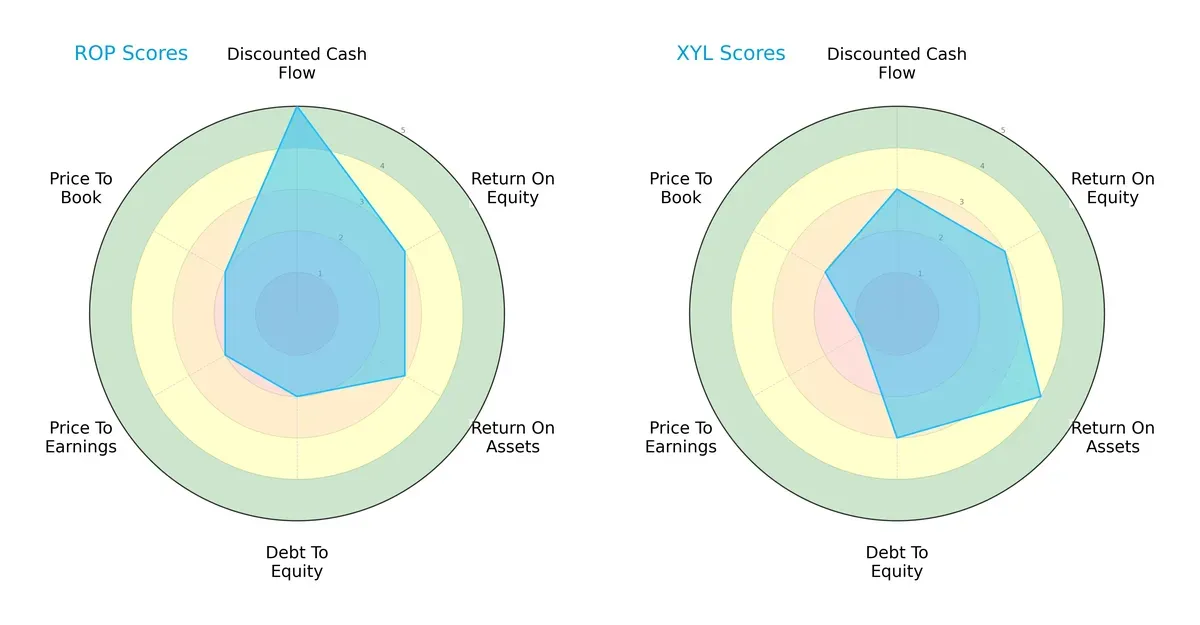
Roper shows strength in discounted cash flow with a very favorable score of 5, indicating robust valuation based on future cash flows. Xylem leads in return on assets with a favorable score of 4, signaling better asset utilization. Both firms share moderate scores in return on equity and overall rating at 3. Roper has a slightly weaker debt-to-equity profile (score 2) compared to Xylem’s 3, suggesting higher leverage risk. Valuation metrics favor Roper modestly but remain moderate for both. Overall, Roper relies on cash flow strength while Xylem presents a more balanced operational efficiency.
Bankruptcy Risk: Solvency Showdown
The Altman Z-Score comparison shows a clear solvency advantage for Xylem at 4.62, firmly in the safe zone, versus Roper’s 2.65 in the grey zone:
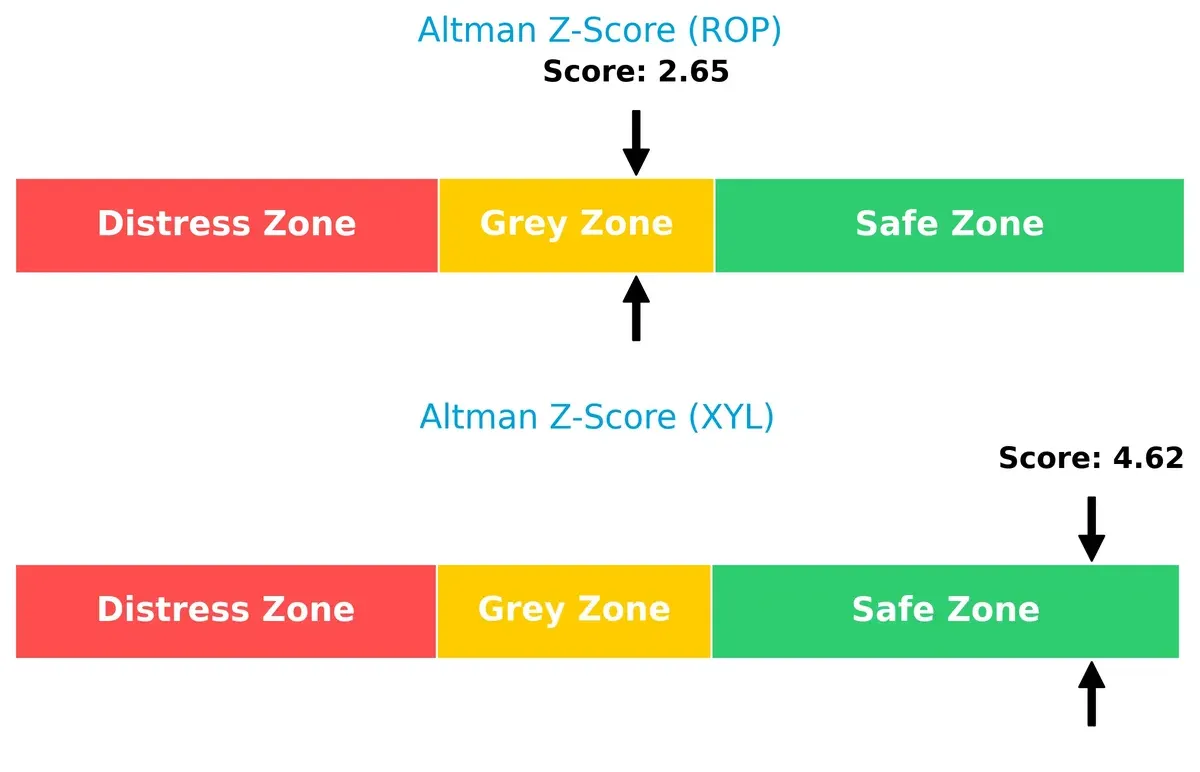
Xylem’s stronger Z-Score signals lower bankruptcy risk amid economic cycles. Roper’s grey zone status warns of moderate financial distress potential if market conditions worsen, underscoring caution.
Financial Health: Quality of Operations
Both companies score an 8 on the Piotroski F-Score, indicating very strong financial health and operational quality:
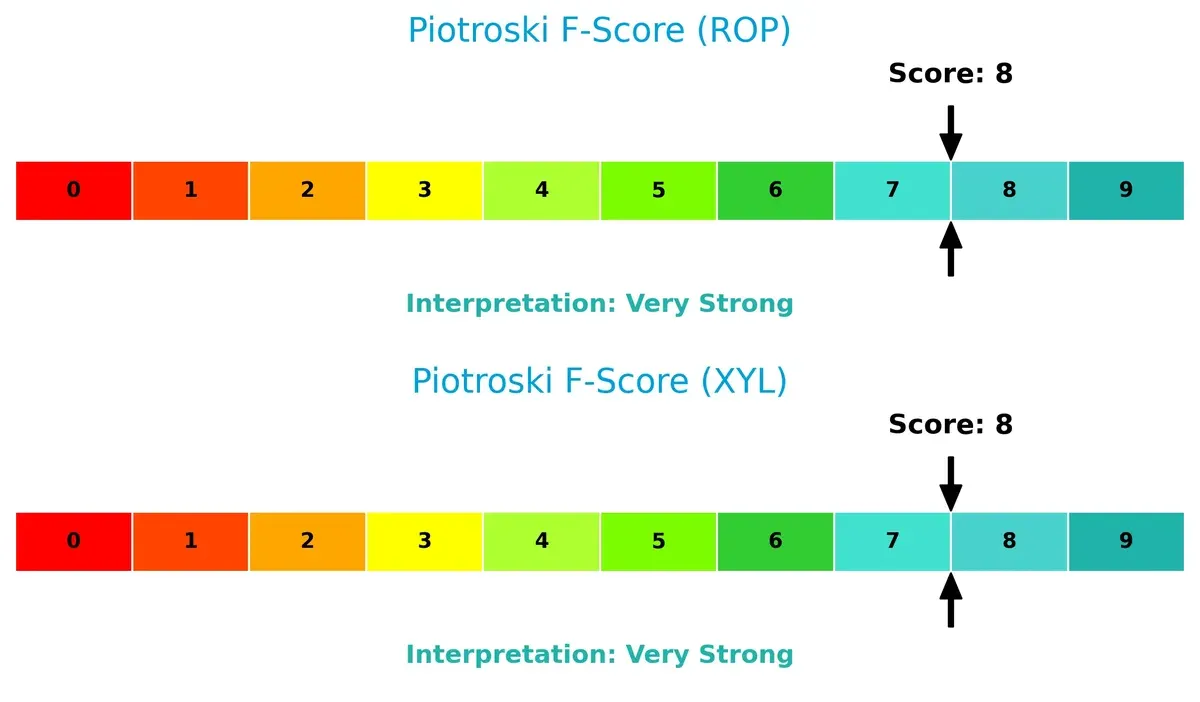
This parity suggests both firms maintain robust internal metrics in profitability, leverage, liquidity, and efficiency. Neither shows red flags, supporting confidence in their fundamental stability.
How are the two companies positioned?
This section dissects ROP and XYL’s operational DNA by comparing revenue distribution and internal dynamics—strengths and weaknesses. The goal is to confront their economic moats to reveal which business model offers the most resilient, sustainable competitive advantage today.
Revenue Segmentation: The Strategic Mix
This comparison dissects how Roper Technologies, Inc. and Xylem Inc. diversify their income streams and reveals where their primary sector bets lie:
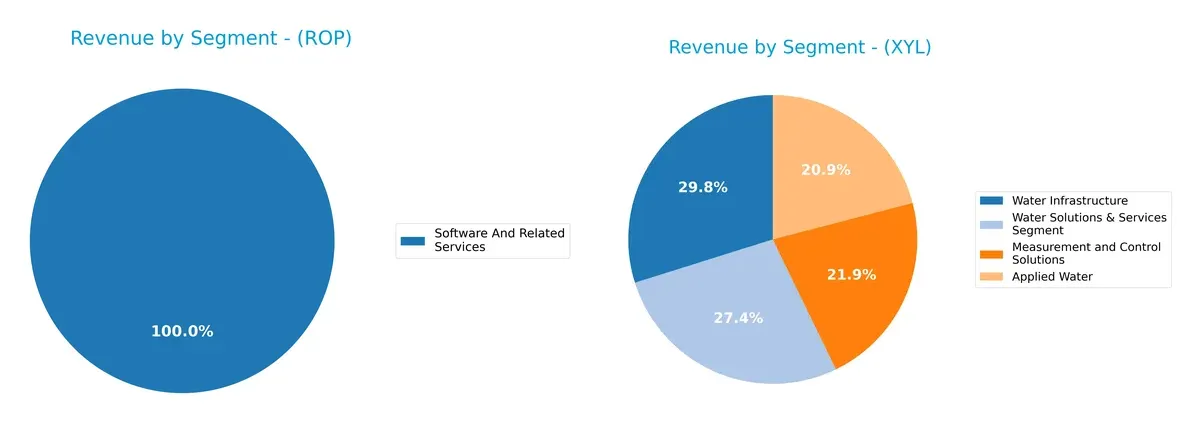
Roper Technologies anchors its revenue heavily in Software and Related Services, generating $10.7B in 2024, showing a strong software ecosystem lock-in. In contrast, Xylem Inc. exhibits a more balanced portfolio with Water Infrastructure at $2.55B and related segments collectively nearing $6.7B. Roper’s concentration risks contrast with Xylem’s infrastructure dominance and diversified water solutions, positioning each differently against market volatility and sector cycles.
Strengths and Weaknesses Comparison
This table compares the Strengths and Weaknesses of Roper Technologies, Inc. and Xylem Inc.:
ROP Strengths
- High net margin at 19.44%
- Favorable debt-to-assets at 26.9%
- Strong fixed asset turnover at 50.37
- Diversified software and technology segments
- Solid U.S. revenue base at 6.06B
XYL Strengths
- Favorable net margin at 10.39%
- Strong current and quick ratios (1.75, 1.33)
- Low debt-to-assets at 12.88%
- Diverse water infrastructure and services
- Global presence with strong Europe and Asia Pacific sales
ROP Weaknesses
- Low current and quick ratios (0.52, 0.48) raise liquidity concerns
- Unfavorable ROE at 7.73%
- Asset turnover at 0.23 is low
- High P/E ratio at 31.06 may limit upside
- Lower global revenue diversification
XYL Weaknesses
- Unfavorable ROE at 8.36%
- Elevated P/E ratio at 31.63
- Moderate asset turnover at 0.52
- ROIC slightly above WACC but still neutral
- Dividend yield moderate at 1.24%
ROP leverages strong profitability and fixed asset efficiency but faces liquidity constraints and modest ROE. XYL shows better liquidity and slightly more favorable capital structure, though profitability metrics suggest room for improvement. Both firms exhibit solid diversification within their industries but must manage valuation and efficiency risks carefully.
The Moat Duel: Analyzing Competitive Defensibility
A structural moat is the only reliable shield protecting a company’s long-term profits from relentless competitive pressures:
Roper Technologies, Inc.: Diversified Intangible Asset Moat
Roper’s competitive edge stems from its broad portfolio of specialized software and engineered products. Its consistently high gross margin (69%) signals strong pricing power. In 2026, ongoing innovation in cloud-based analytics could deepen this intangible asset moat but rising opex growth poses margin pressure risks.
Xylem Inc.: Operational Efficiency and Market Penetration Moat
Xylem leverages advanced water technology and smart infrastructure solutions, contrasting Roper’s software-heavy moat. Its improving EBIT margin (13%) and accelerating net income growth demonstrate operational strength. Expansion in global water infrastructure markets in 2026 offers significant runway for disruption and moat widening.
Specialized Software Intangibles vs. Water Infrastructure Scale
Both firms show growing profitability but fail to clear ROIC above WACC, signaling value destruction despite improving returns. I see Roper’s moat as more intangible and innovation-driven, while Xylem’s rests on operational scale and market penetration. Xylem’s faster ROIC growth and broader global footprint make it better equipped to defend and expand its market share in 2026.
Which stock offers better returns?
The past year shows contrasting stock price trajectories: Roper Technologies, Inc. declines sharply, while Xylem Inc. gains steadily, reflecting differing market sentiment and trading volumes.
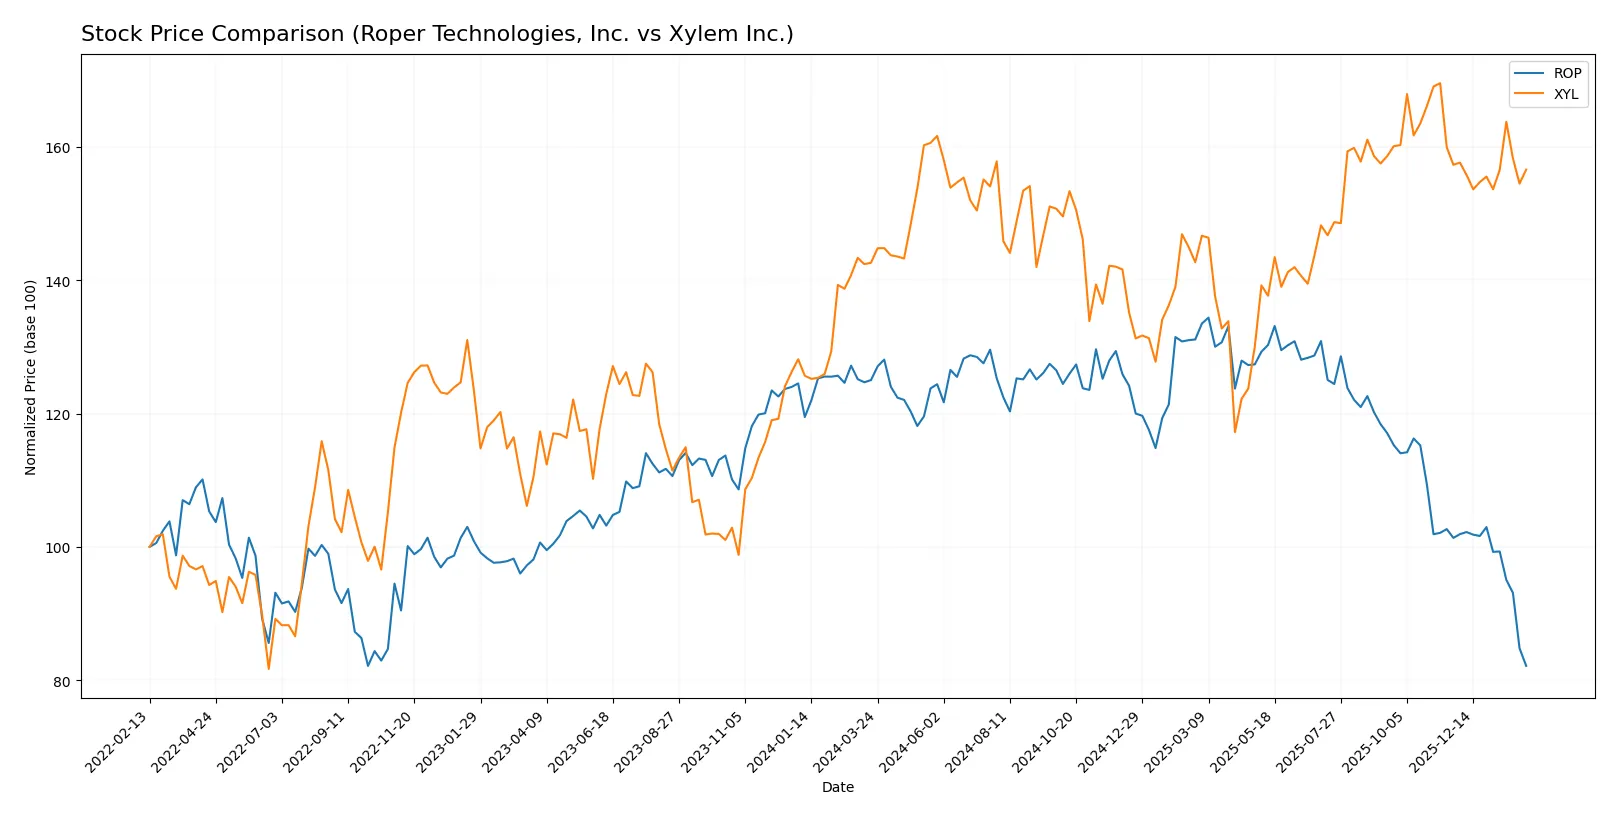
Trend Comparison
Roper Technologies’ stock fell 34.28% over the past year, signaling a bearish trend with decelerating losses and high volatility, peaking at 588.38 and bottoming at 359.71.
Xylem’s stock rose 9.8%, marking a bullish trend with accelerating gains and low volatility, reaching a high of 151.31 and a low of 104.6 during the period.
Xylem outperformed Roper clearly, delivering positive returns versus a steep decline for Roper, reflecting stronger market momentum and buyer interest.
Target Prices
Analysts show a bullish consensus for both Roper Technologies, Inc. and Xylem Inc., reflecting confidence in industrial machinery leaders.
| Company | Target Low | Target High | Consensus |
|---|---|---|---|
| Roper Technologies, Inc. | 365 | 575 | 475.5 |
| Xylem Inc. | 150 | 178 | 169.43 |
The consensus targets for Roper and Xylem exceed their current prices by 32% and 21%, respectively, indicating potential upside against today’s market levels.

Don’t Let Luck Decide Your Entry Point
Optimize your entry points with our advanced ProRealTime indicators. You’ll get efficient buy signals with precise price targets for maximum performance. Start outperforming now!
How do institutions grade them?
Here are the latest institutional grades for Roper Technologies, Inc. and Xylem Inc.:
Roper Technologies, Inc. Grades
The following table summarizes recent grade actions from major grading companies for Roper Technologies, Inc.:
| Grading Company | Action | New Grade | Date |
|---|---|---|---|
| Goldman Sachs | maintain | Neutral | 2026-01-29 |
| Argus Research | downgrade | Hold | 2026-01-28 |
| Mizuho | maintain | Underperform | 2026-01-28 |
| RBC Capital | maintain | Sector Perform | 2026-01-28 |
| Stifel | downgrade | Hold | 2026-01-28 |
| Citigroup | maintain | Buy | 2026-01-28 |
| JP Morgan | maintain | Underweight | 2026-01-28 |
| Truist Securities | maintain | Buy | 2026-01-28 |
| Barclays | maintain | Underweight | 2026-01-28 |
| Oppenheimer | downgrade | Perform | 2026-01-28 |
Xylem Inc. Grades
Below is a summary of recent grade actions from respected grading firms for Xylem Inc.:
| Grading Company | Action | New Grade | Date |
|---|---|---|---|
| Barclays | maintain | Overweight | 2026-01-07 |
| Mizuho | maintain | Neutral | 2026-01-05 |
| TD Cowen | maintain | Hold | 2025-12-05 |
| UBS | maintain | Buy | 2025-11-06 |
| Stifel | maintain | Buy | 2025-10-29 |
| Citigroup | maintain | Buy | 2025-10-29 |
| Barclays | maintain | Overweight | 2025-10-29 |
| RBC Capital | maintain | Outperform | 2025-10-29 |
| Citigroup | maintain | Buy | 2025-10-09 |
| Mizuho | maintain | Neutral | 2025-09-12 |
Which company has the best grades?
Xylem Inc. consistently receives more positive ratings, including multiple Buy and Outperform grades, compared to Roper Technologies’ mixed Hold and Underperform grades. This difference may influence investor sentiment and risk assessment.
Risks specific to each company
The following categories identify the critical pressure points and systemic threats facing both firms in the 2026 market environment:
1. Market & Competition
Roper Technologies, Inc.
- Faces pressure from high P/E ratio and modest ROE, suggesting valuation risk amid competitive tech innovation.
Xylem Inc.
- Higher beta indicates more market sensitivity; moderate ROE and favorable asset turnover support competitive positioning.
2. Capital Structure & Debt
Roper Technologies, Inc.
- Debt-to-equity at 0.47 is moderate but manageable; interest coverage strong at 6.96, showing solid debt servicing.
Xylem Inc.
- Lower debt-to-equity of 0.20 and superior interest coverage of 25.7 reflect conservative leverage and financial strength.
3. Stock Volatility
Roper Technologies, Inc.
- Beta of 0.93 signals slightly below-market volatility, offering relative stability for risk-averse investors.
Xylem Inc.
- Beta at 1.163 suggests higher volatility, exposing investors to more market swings and potential returns.
4. Regulatory & Legal
Roper Technologies, Inc.
- Operates globally in highly regulated industrial software and machinery sectors, facing compliance cost pressures.
Xylem Inc.
- Water infrastructure focus subjects it to evolving environmental regulations and water quality standards worldwide.
5. Supply Chain & Operations
Roper Technologies, Inc.
- Complex product portfolio implies supply chain risk but benefits from diversified revenue streams and operational controls.
Xylem Inc.
- Relies on global supply chains for pumps and smart technologies, vulnerable to raw material cost inflation and logistics delays.
6. ESG & Climate Transition
Roper Technologies, Inc.
- ESG pressures rising due to exposure in precision instruments and energy-intensive tech segments.
Xylem Inc.
- Positioned favorably with water sustainability solutions, aligning with climate transition trends and regulatory incentives.
7. Geopolitical Exposure
Roper Technologies, Inc.
- Primarily US-based with global sales; geopolitical tensions could disrupt international contracts and supply chains.
Xylem Inc.
- More international footprint increases geopolitical risk but also diversifies revenue sources across stable and emerging markets.
Which company shows a better risk-adjusted profile?
Xylem’s lower leverage, stronger liquidity, and superior Altman Z-Score place it in a safer financial zone. However, its higher market volatility and regulatory exposure in water infrastructure present notable risks. Roper’s stable beta and diversified operations balance its weaker liquidity ratios but raise concerns over valuation and operational efficiency. I see Xylem as having a slightly better risk-adjusted profile, given its stronger balance sheet and safer bankruptcy score, despite market sensitivity. The divergent liquidity profiles and Altman Z-Scores highlight where investors should prioritize caution.
Final Verdict: Which stock to choose?
Roper Technologies, Inc. (ROP) wields unmatched operational efficiency, turning intangible assets into strong cash flow. Its point of vigilance lies in a low liquidity buffer, signaling potential short-term strain. ROP fits well in an aggressive growth portfolio seeking durable cash generation amid cyclical volatility.
Xylem Inc. (XYL) commands a strategic moat through solid recurring revenue and conservative leverage. Its balance sheet strength and healthier liquidity profile offer a cushion against macroeconomic headwinds compared to ROP. XYL suits a GARP investor aiming for steady growth paired with financial resilience.
If you prioritize operational cash flow and are comfortable navigating liquidity risks, ROP is the compelling choice due to its strong intangible asset utilization and growth momentum. However, if you seek better stability and lower financial risk, XYL offers superior balance sheet health and consistent earnings expansion. Both present slightly unfavorable moats but improving profitability trajectories.
Disclaimer: Investment carries a risk of loss of initial capital. The past performance is not a reliable indicator of future results. Be sure to understand risks before making an investment decision.
Go Further
I encourage you to read the complete analyses of Roper Technologies, Inc. and Xylem Inc. to enhance your investment decisions: