Home > Comparison > Industrials > ROP vs PATH
The strategic rivalry between Roper Technologies, Inc. and UiPath Inc. shapes the evolving landscape of industrial and technology sectors. Roper excels as a capital-intensive industrial machinery conglomerate with diversified engineered products. UiPath leads as a high-growth software infrastructure innovator specializing in robotic process automation. This analysis evaluates their distinct corporate models to uncover which offers superior risk-adjusted returns for a diversified portfolio navigating sector leadership and technological integration.
Table of contents
Companies Overview
Roper Technologies and UiPath both hold pivotal roles in their respective industrial and technology markets.
Roper Technologies, Inc.: Diversified Industrial Technology Leader
Roper Technologies dominates the industrial machinery sector by designing and developing software and engineered products. Its revenue stems from a broad portfolio, including cloud-based software for financial services, healthcare, and supply chain management, alongside precision instruments and control systems. In 2026, Roper focuses on expanding its cloud analytics and automation capabilities to strengthen its technology-driven industrial solutions.
UiPath Inc.: Robotic Process Automation Innovator
UiPath leads the software infrastructure sector with its end-to-end automation platform. It generates revenue by offering robotic process automation (RPA) solutions that combine AI, low-code development, and centralized management tools. The company’s 2026 strategic focus centers on enhancing its AI-powered automation and expanding its reach in banking, healthcare, and government sectors.
Strategic Collision: Similarities & Divergences
Roper pursues a diversified industrial technology model integrating software with hardware, while UiPath champions a pure-play software automation platform. Both compete in automation, but Roper targets industrial efficiency, whereas UiPath focuses on enterprise workflow automation. Their distinct approaches create unique investment profiles—Roper as a broad industrial innovator and UiPath as a specialized technology disruptor.
Income Statement Comparison
This data dissects the core profitability and scalability of both corporate engines to reveal who dominates the bottom line:
| Metric | Roper Technologies, Inc. (ROP) | UiPath Inc. (PATH) |
|---|---|---|
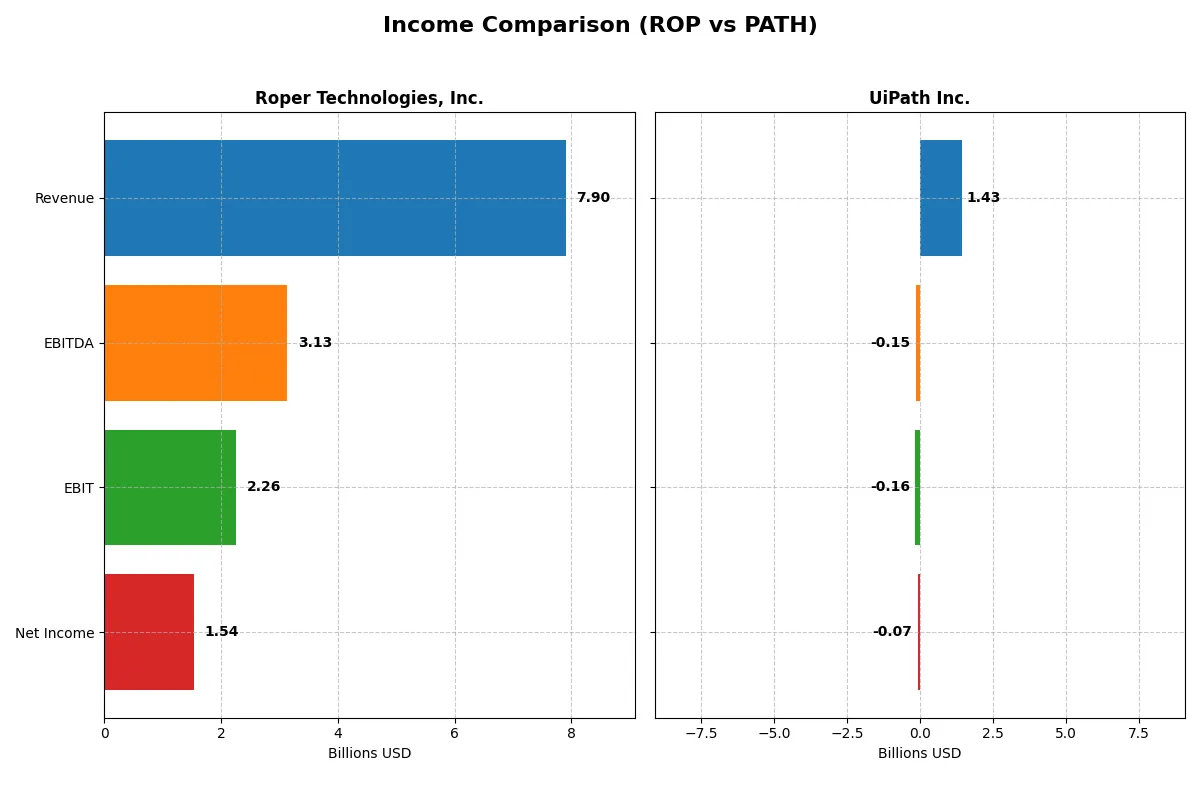
| Revenue | 7.9B | 1.43B |
| Cost of Revenue | 2.43B | 247M |
| Operating Expenses | 3.24B | 1.35B |
| Gross Profit | 5.47B | 1.18B |
| EBITDA | 3.13B | -145M |
| EBIT | 2.26B | -163M |
| Interest Expense | 325M | 0 |
| Net Income | 1.54B | -74M |
| EPS | 14.31 | -0.13 |
| Fiscal Year | 2025 | 2025 |
Income Statement Analysis: The Bottom-Line Duel
This income statement comparison reveals which company operates with greater efficiency and delivers stronger profitability amidst growth.
Roper Technologies, Inc. Analysis
Roper shows a steady revenue climb from 4.8B in 2021 to 7.9B in 2025, with net income rising from 1.1B to 1.5B. Its gross margin stands robust at 69.2%, and net margin remains healthy near 19.4%. Despite slight net margin contraction recently, Roper maintains solid profitability and operational strength.
UiPath Inc. Analysis
UiPath grew revenue from 608M in 2021 to 1.43B in 2025, nearly doubling its top line. However, it still posts negative net income, though losses narrowed from -92M to -74M. The company boasts an impressive gross margin of 82.7% but struggles with an unfavorable -5.1% net margin, reflecting ongoing investment and scaling costs.
Margin Strength vs. Growth Trajectory
Roper dominates with consistent positive net income and strong margins, reflecting disciplined capital allocation and operational efficiency. UiPath impresses with high gross margins and rapid revenue growth but remains unprofitable as it invests heavily to scale. For investors, Roper offers stable profitability, while UiPath presents a higher-growth, higher-risk profile.
Financial Ratios Comparison
These vital ratios act as a diagnostic tool to expose the underlying fiscal health, valuation premiums, and capital efficiency of the companies compared below:
| Ratios | Roper Technologies, Inc. (ROP) | UiPath Inc. (PATH) |
|---|---|---|
| ROE | 7.73% | -3.99% |
| ROIC | 5.62% | -7.41% |
| P/E | 31.1 | -108.0 |
| P/B | 2.40 | 4.31 |
| Current Ratio | 0.52 | 2.93 |
| Quick Ratio | 0.48 | 2.93 |
| D/E (Debt-to-Equity) | 0.47 | 0.04 |
| Debt-to-Assets | 26.9% | 2.7% |
| Interest Coverage | 6.88 | 0 |
| Asset Turnover | 0.23 | 0.50 |
| Fixed Asset Turnover | 50.37 | 14.41 |
| Payout ratio | 23.1% | 0 |
| Dividend yield | 0.74% | 0 |
| Fiscal Year | 2025 | 2025 |
Efficiency & Valuation Duel: The Vital Signs
Financial ratios act as a company’s DNA, exposing hidden risks and revealing operational strengths critical for investors’ decisions.
Roper Technologies, Inc.
Roper shows a favorable net margin of 19.44% but an unfavorable ROE of 7.73%, indicating modest profitability despite operational efficiency. Its P/E ratio of 31.06 suggests the stock is relatively expensive. Shareholders receive a small 0.74% dividend yield, reflecting a cautious return strategy amid stable but unspectacular returns.
UiPath Inc.
UiPath posts negative profitability metrics: net margin at -5.15% and ROE at -3.99%, signaling ongoing losses and inefficiency. The P/E ratio is negative, implying no earnings to value, but a favorable current ratio of 2.93 highlights strong liquidity. It pays no dividends, prioritizing reinvestment in R&D to fuel growth.
Mature Stability vs. Growth Challenges
Roper balances operational efficiency with a stretched valuation and modest shareholder returns. UiPath offers strong liquidity but suffers from losses and an unfavorable capital return profile. Investors seeking stability might lean toward Roper, while those favoring growth and risk tolerance may consider UiPath’s reinvestment strategy.
Which one offers the Superior Shareholder Reward?
Roper Technologies, Inc. (ROP) pays a consistent dividend with a 0.74% yield and a sustainable 23% payout ratio, supported by strong free cash flow of 23.3/share. Its steady buyback program enhances total returns. UiPath Inc. (PATH) pays no dividends but reinvests aggressively in R&D and growth. PATH’s buybacks remain modest, reflecting its early-stage growth focus. I believe ROP’s balanced distribution via dividends and buybacks offers a more attractive and sustainable total shareholder reward in 2026 compared to PATH’s zero-yield, reinvestment-heavy approach.
Comparative Score Analysis: The Strategic Profile
The radar chart reveals the fundamental DNA and trade-offs of both firms, highlighting their core financial strengths and vulnerabilities:
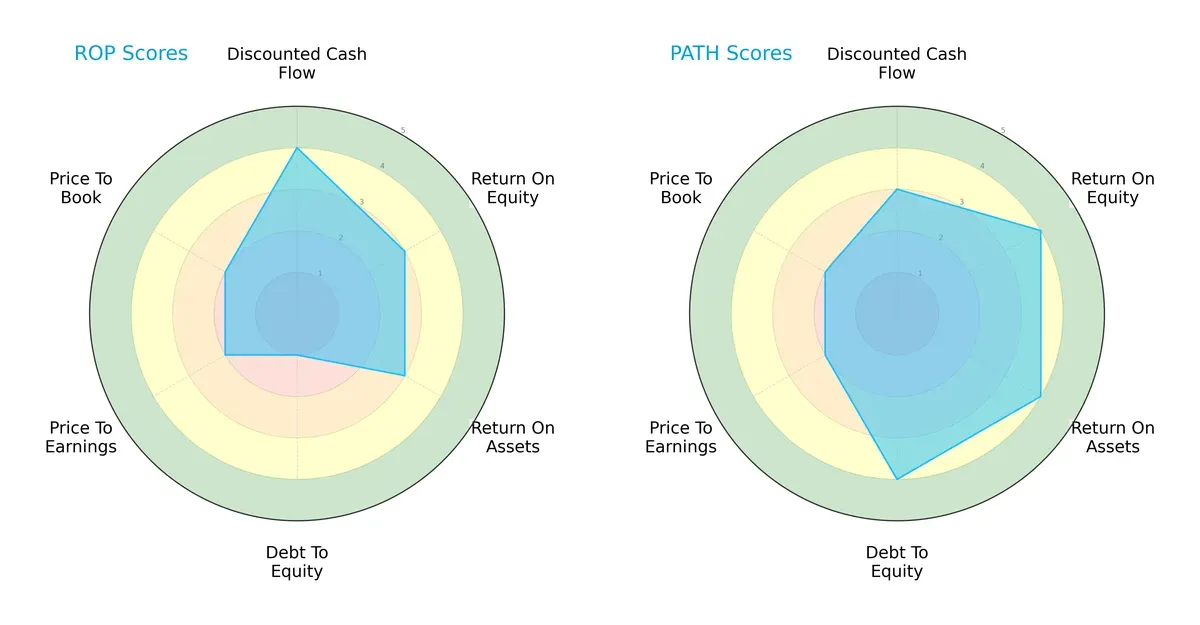
Roper Technologies shows a strong discounted cash flow score (4) but struggles with debt management (1), indicating financial leverage risk. UiPath excels in return on equity (4), return on assets (4), and debt-to-equity (4), presenting a more balanced risk-return profile. UiPath’s higher operational efficiency contrasts with Roper’s reliance on cash flow strength, making UiPath the more diversified performer.
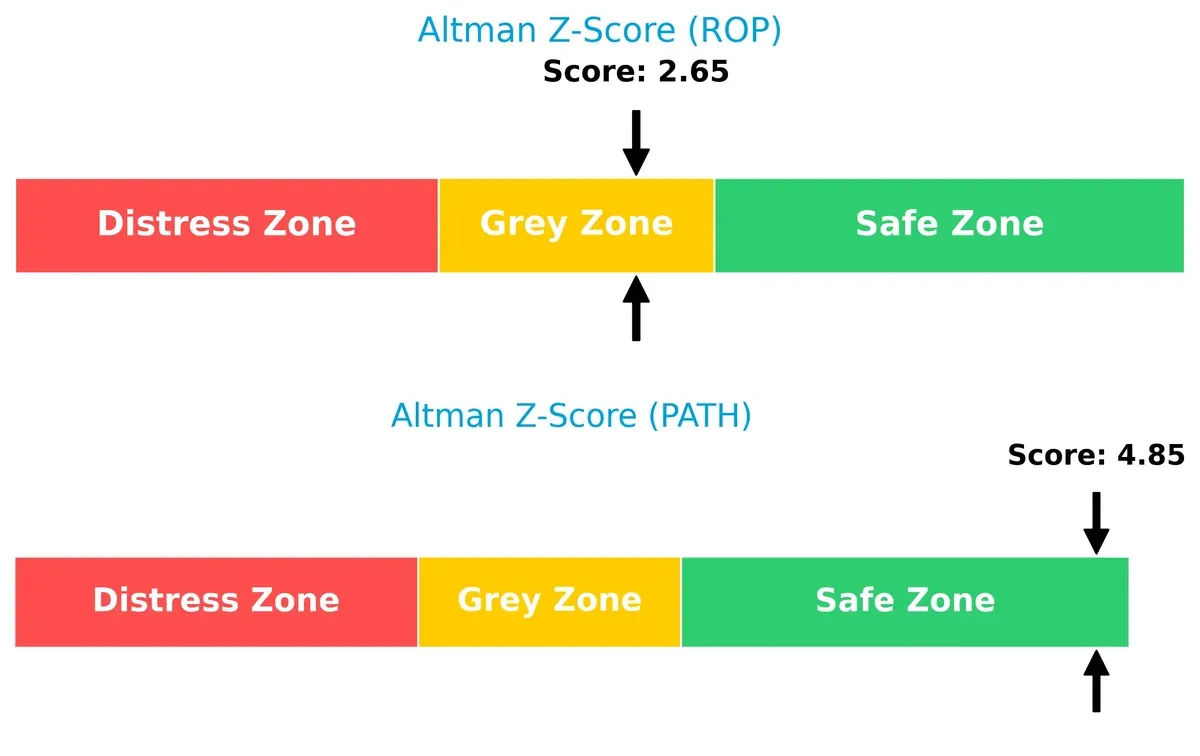
Bankruptcy Risk: Solvency Showdown
UiPath’s Altman Z-Score of 4.85 places it safely above distress thresholds, signaling robust long-term solvency. Roper’s 2.65 score situates it in the grey zone, suggesting moderate bankruptcy risk under economic stress:
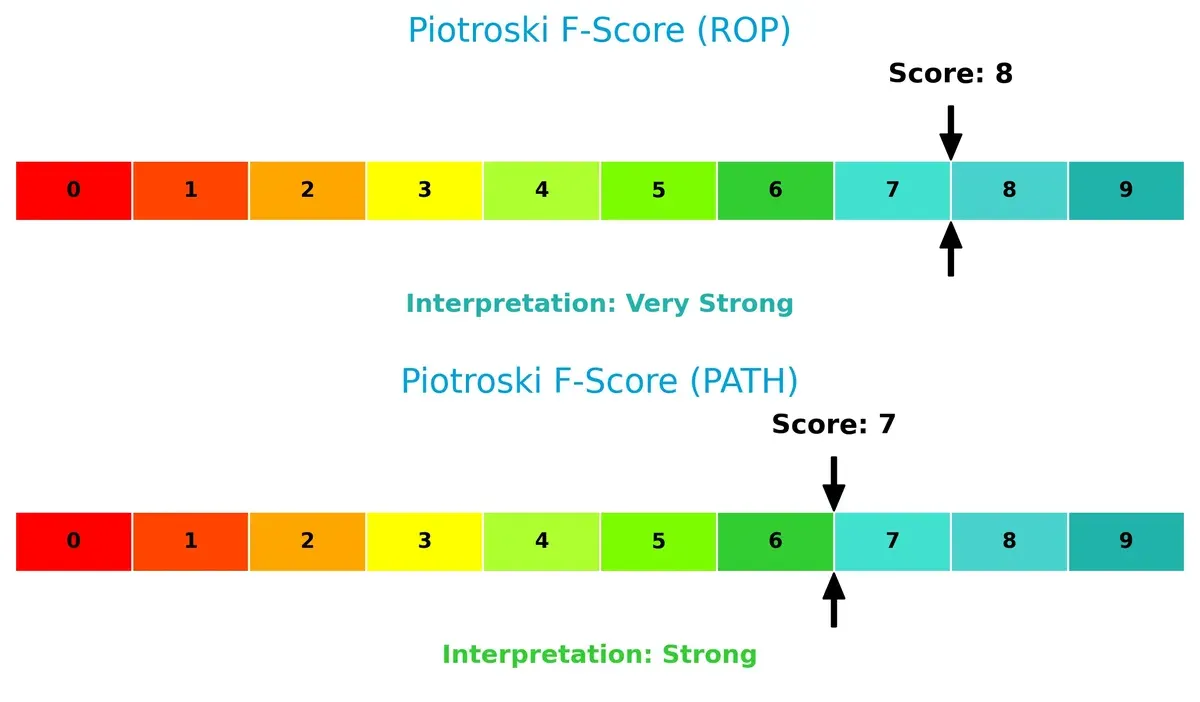
Financial Health: Quality of Operations
Roper scores an 8, indicating very strong financial health with efficient operations and profitability. UiPath’s 7 is strong but shows slightly more internal risk than Roper, reflecting minor red flags in its financial metrics:
How are the two companies positioned?
This section dissects the operational DNA of Roper Technologies and UiPath by comparing their revenue distribution and internal strengths and weaknesses. The goal is to confront their economic moats to reveal which business model offers the most resilient, sustainable competitive advantage in today’s market.
Revenue Segmentation: The Strategic Mix
This visual comparison dissects how Roper Technologies and UiPath diversify their income streams and where their primary sector bets lie:
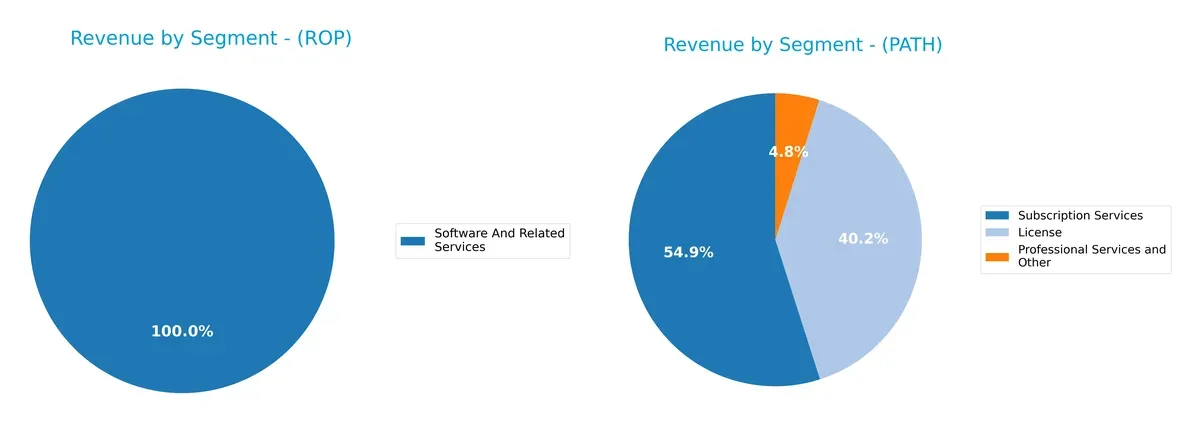
Roper Technologies anchors its revenue in software and related services, with $10.7B in 2024, showing a concentrated but strong focus. In contrast, UiPath balances its mix across licenses ($587M), subscription services ($802M), and professional services ($71M) in 2025, reflecting a more diversified SaaS ecosystem. Roper’s concentration signals infrastructure dominance but raises concentration risk. UiPath’s spread supports recurring revenue and ecosystem lock-in, reducing volatility.
Strengths and Weaknesses Comparison
This table compares the Strengths and Weaknesses of Roper Technologies, Inc. and UiPath Inc.:
ROP Strengths
- Diversified revenue streams across software and technology segments
- Strong net margin at 19.44%
- Favorable debt-to-assets ratio at 26.9%
- High fixed asset turnover at 50.37
- Significant US and global presence with billions in revenue
- Favorable interest coverage ratio at 6.96
PATH Strengths
- Strong liquidity with current and quick ratios at 2.93
- Low debt-to-assets ratio at 2.72%
- Favorable price-to-earnings ratio despite losses
- Growing global footprint in Americas, Asia Pacific, EMEA
- Favorable fixed asset turnover at 14.41
- Focus on subscription and license revenue
ROP Weaknesses
- Low current and quick ratios at 0.52 and 0.48
- Unfavorable return on equity at 7.73% below WACC
- Unfavorable price-to-earnings ratio at 31.06
- Low asset turnover at 0.23
- Low dividend yield at 0.74%
- Mixed profitability vs. cost of capital
PATH Weaknesses
- Negative net margin at -5.15% and negative ROE
- Negative ROIC at -7.41% below WACC
- Unfavorable price-to-book ratio at 4.31
- Zero interest coverage ratio indicating risk
- Negative earnings reflected in valuation
- No dividend yield
Roper demonstrates strong profitability and asset efficiency with diversified revenue, but struggles with liquidity and returns below cost of capital. UiPath shows robust liquidity and low leverage but faces profitability challenges and weak returns. These contrasts highlight differing strategic priorities and financial profiles in their sectors.
The Moat Duel: Analyzing Competitive Defensibility
A structural moat is the only true shield protecting long-term profits from relentless competitive erosion in any industry:
Roper Technologies, Inc.: Diversified Industrial Intangible Assets Moat
Roper’s moat stems from its portfolio of specialized software and engineered products, reflected in stable 28.6% EBIT margins. Expansion into cloud analytics deepens this advantage in 2026 but margin pressure risks remain.
UiPath Inc.: Rapidly Scaling Network Effects Moat
UiPath leverages network effects via its RPA platform, with 83% gross margins but negative EBIT margins. Its accelerating revenue growth and AI integration signal a strengthening moat, though profitability lags behind Roper’s.
Verdict: Intangible Assets Stability vs. Network Effect Potential
Roper offers a wider, more stable moat through diverse, high-margin industrial software and products. UiPath’s moat is narrower but rapidly deepening as it gains scale and AI capabilities. Roper is better positioned today to defend market share amid economic cycles.
Which stock offers better returns?
The past year showed significant price declines for both stocks, with Roper Technologies and UiPath experiencing sustained bearish trends and notable deceleration in their downtrends.
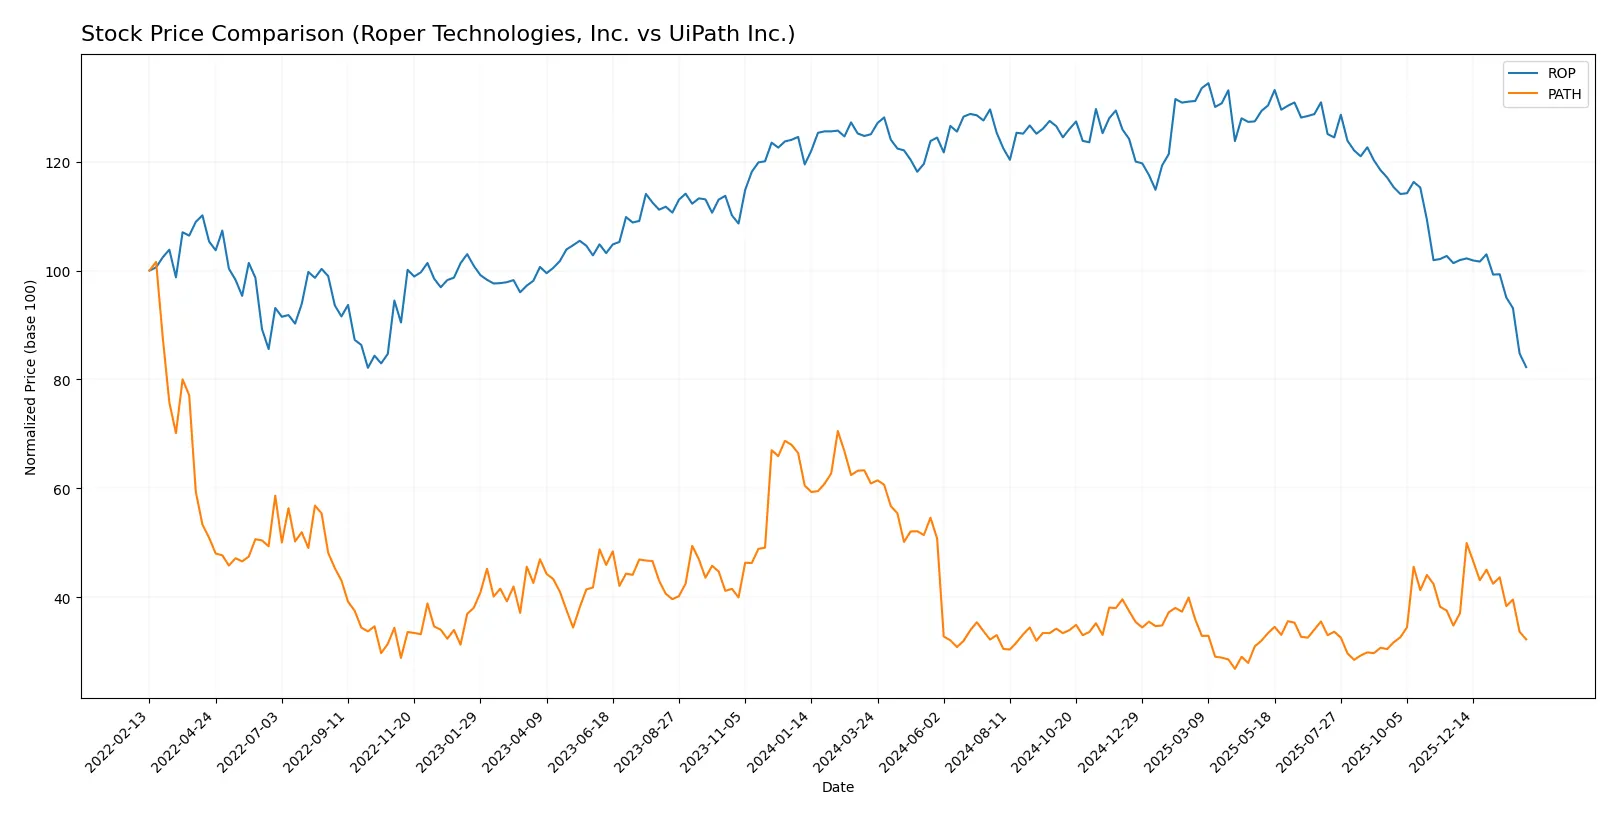
Trend Comparison
Roper Technologies, Inc. fell 34.2% over the last 12 months, showing a bearish trend with decelerating losses and a high volatility level at 47.9, ranging between 360.16 and 588.38.
UiPath Inc. dropped 46.97% in the same period, also bearish with deceleration, but far lower volatility at 2.9, with prices fluctuating between 10.04 and 22.97.
UiPath underperformed Roper Technologies, delivering the weakest market returns over the past year despite both showing sustained bearish momentum.
Target Prices
Analysts present a clear upward target consensus for both Roper Technologies and UiPath, signaling growth potential.
| Company | Target Low | Target High | Consensus |
|---|---|---|---|
| Roper Technologies, Inc. | 365 | 575 | 475.5 |
| UiPath Inc. | 14 | 19 | 16.6 |
Roper’s consensus target of 475.5 exceeds its current price of 359.97, implying a 32% upside. UiPath’s 16.6 target also suggests a 38% gain from its 12.05 price, reflecting robust analyst optimism.

Don’t Let Luck Decide Your Entry Point
Optimize your entry points with our advanced ProRealTime indicators. You’ll get efficient buy signals with precise price targets for maximum performance. Start outperforming now!
How do institutions grade them?
The latest institutional grades for Roper Technologies, Inc. and UiPath Inc. are as follows:
Roper Technologies, Inc. Grades
Below is the recent grade summary from notable grading companies for Roper Technologies, Inc.:
| Grading Company | Action | New Grade | Date |
|---|---|---|---|
| Goldman Sachs | Maintain | Neutral | 2026-01-29 |
| Argus Research | Downgrade | Hold | 2026-01-28 |
| Mizuho | Maintain | Underperform | 2026-01-28 |
| RBC Capital | Maintain | Sector Perform | 2026-01-28 |
| Stifel | Downgrade | Hold | 2026-01-28 |
| Citigroup | Maintain | Buy | 2026-01-28 |
| JP Morgan | Maintain | Underweight | 2026-01-28 |
| Truist Securities | Maintain | Buy | 2026-01-28 |
| Barclays | Maintain | Underweight | 2026-01-28 |
| Oppenheimer | Downgrade | Perform | 2026-01-28 |
UiPath Inc. Grades
Here are the recent institutional grades for UiPath Inc. from reputable sources:
| Grading Company | Action | New Grade | Date |
|---|---|---|---|
| Barclays | Maintain | Equal Weight | 2026-01-12 |
| RBC Capital | Maintain | Sector Perform | 2026-01-05 |
| RBC Capital | Maintain | Sector Perform | 2025-12-10 |
| Morgan Stanley | Maintain | Equal Weight | 2025-12-09 |
| DA Davidson | Maintain | Neutral | 2025-12-05 |
| Mizuho | Maintain | Neutral | 2025-12-04 |
| Evercore ISI Group | Maintain | In Line | 2025-12-04 |
| RBC Capital | Maintain | Sector Perform | 2025-12-04 |
| Barclays | Maintain | Equal Weight | 2025-12-04 |
| Wells Fargo | Maintain | Equal Weight | 2025-12-04 |
Which company has the best grades?
Roper Technologies shows a mix of Buy, Hold, and Underperform ratings with several downgrades. UiPath consistently holds Sector Perform and Equal Weight ratings without downgrades. This stability may indicate steadier institutional confidence in UiPath compared to Roper.
Risks specific to each company
The following categories identify the critical pressure points and systemic threats facing both firms in the 2026 market environment:
1. Market & Competition
Roper Technologies, Inc.
- Operates in industrial machinery with diversified software and engineered products, facing established industrial competitors.
UiPath Inc.
- Competes in fast-evolving software infrastructure, battling innovation-driven rivals in robotic process automation.
2. Capital Structure & Debt
Roper Technologies, Inc.
- Maintains moderate debt levels with debt-to-assets at 26.9%, interest coverage favorable at 6.96x.
UiPath Inc.
- Very low debt-to-assets at 2.72%, but zero interest coverage signals potential liquidity constraints.
3. Stock Volatility
Roper Technologies, Inc.
- Beta of 0.93 indicates slightly less volatility than market average, trading range wide at $343.92–595.17.
UiPath Inc.
- Beta of 1.07 shows higher volatility, with a tighter trading range between $9.38–19.84 but large volume swings.
4. Regulatory & Legal
Roper Technologies, Inc.
- Subject to industrial product regulations and compliance management software standards.
UiPath Inc.
- Faces regulatory scrutiny common in data-intensive software, including privacy and AI governance risks.
5. Supply Chain & Operations
Roper Technologies, Inc.
- Relies on complex manufacturing and distribution networks, vulnerable to raw material and logistic disruptions.
UiPath Inc.
- Software delivery reduces physical supply chain risk but depends heavily on cloud infrastructure and service uptime.
6. ESG & Climate Transition
Roper Technologies, Inc.
- Industrial footprint requires managing emissions and resource efficiency to meet rising ESG expectations.
UiPath Inc.
- Faces pressure on data center energy efficiency and ethical AI use, critical for sustainable growth.
7. Geopolitical Exposure
Roper Technologies, Inc.
- U.S.-based with global operations; exposed to trade tensions impacting manufacturing exports.
UiPath Inc.
- Operates mainly in U.S., Romania, Japan; geopolitical shifts could affect international contracts and data sovereignty laws.
Which company shows a better risk-adjusted profile?
Roper’s key risk lies in liquidity constraints, as reflected by its unfavorable current and quick ratios. UiPath’s greatest threat is persistent unprofitability and fragile interest coverage despite a strong balance sheet. Overall, UiPath presents a better risk-adjusted profile, bolstered by a safe Altman Z-Score and stronger financial ratings. However, its negative margins flag ongoing operational challenges. The contrast in liquidity positions and bankruptcy risk underlines the divergent risk landscapes of these two firms in 2026.
Final Verdict: Which stock to choose?
Roper Technologies, Inc. (ROP) shines as a cash-generating powerhouse with solid operating margins and a steadily improving ROIC. Its main point of vigilance lies in its weak liquidity ratios, which could constrain agility during downturns. ROP suits investors seeking steady income and moderate growth in balanced portfolios.
UiPath Inc. (PATH) boasts a strategic moat in its cloud-based automation platform, driving strong revenue growth and recurring revenue safety. Its robust liquidity and low leverage offer greater financial stability than ROP. PATH fits well within GARP portfolios targeting high growth at a reasonable price, despite ongoing profitability challenges.
If you prioritize resilient cash flow and operational efficiency, ROP is the compelling choice thanks to its expanding profitability and value-creation trajectory. However, if you seek rapid top-line growth with a scalable business model and stronger balance sheet safety, PATH offers better stability and growth potential. Both stocks carry risks, making alignment with your risk tolerance essential.
Disclaimer: Investment carries a risk of loss of initial capital. The past performance is not a reliable indicator of future results. Be sure to understand risks before making an investment decision.
Go Further
I encourage you to read the complete analyses of Roper Technologies, Inc. and UiPath Inc. to enhance your investment decisions: