Home > Comparison > Industrials > ROP vs SYM
The strategic rivalry between Roper Technologies, Inc. and Symbotic Inc. shapes the future of industrial machinery. Roper embodies a diversified industrial conglomerate with a broad portfolio of software and engineered products. In contrast, Symbotic focuses on high-technology warehouse automation, driving efficiency in retail supply chains. This analysis will dissect their operational models and growth trajectories to identify which offers the superior risk-adjusted return for a balanced portfolio.
Table of contents
Companies Overview
Roper Technologies and Symbotic stand as pivotal players in the industrial machinery sector, each shaping operational efficiency through distinct technological approaches.
Roper Technologies, Inc.: Diversified Industrial Software and Instruments Leader
Roper Technologies commands a diversified portfolio in industrial machinery, generating revenue from software solutions and engineered products. Its core business includes cloud-based software for financial services, healthcare, and supply chain analytics, alongside precision instruments and control systems. In 2026, Roper sharpens its focus on expanding its software-as-a-service offerings and integrating advanced analytics to sustain its competitive edge.
Symbotic Inc.: Warehouse Automation Innovator
Symbotic positions itself as a cutting-edge automation technology company specializing in robotic systems that enhance retail and wholesale warehouse efficiency. Revenue streams hinge on its proprietary Symbotic System, which delivers cost reduction and inventory optimization for U.S. warehouses. In 2026, Symbotic emphasizes scaling deployment and refining its robotics to accelerate adoption across broader supply chain networks.
Strategic Collision: Similarities & Divergences
Both companies operate in industrial machinery but diverge sharply in philosophy: Roper pursues a broad, software-driven platform with multiple verticals, while Symbotic focuses on specialized robotics automation. Their primary battleground is operational efficiency, with Roper targeting diverse sectors and Symbotic zeroing in on warehouse automation. This contrast defines distinct investment profiles—Roper offers stability through diversification, Symbotic presents growth potential through innovation.
Income Statement Comparison
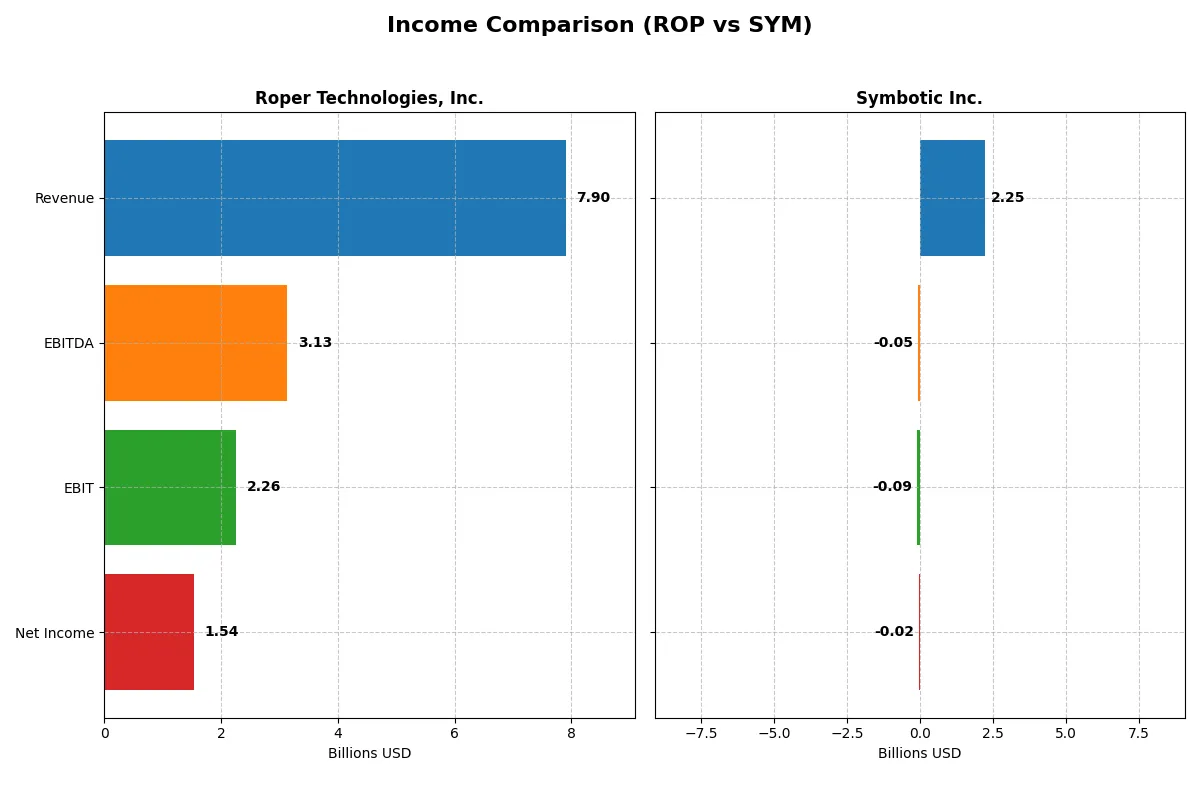
This data dissects the core profitability and scalability of both corporate engines to reveal who dominates the bottom line:
| Metric | Roper Technologies, Inc. (ROP) | Symbotic Inc. (SYM) |
|---|---|---|
| Revenue | 7.9B | 2.25B |
| Cost of Revenue | 2.43B | 1.82B |
| Operating Expenses | 3.24B | 538M |
| Gross Profit | 5.47B | 423M |
| EBITDA | 3.13B | -48M |
| EBIT | 2.26B | -92M |
| Interest Expense | 325M | 0 |
| Net Income | 1.54B | -17M |
| EPS | 14.31 | -0.16 |
| Fiscal Year | 2025 | 2025 |
Income Statement Analysis: The Bottom-Line Duel
The upcoming income statement comparison exposes how efficiently each company converts sales into profit, revealing their true corporate engine power.
Roper Technologies, Inc. Analysis
Roper Technologies steadily grew revenue from 4.8B in 2021 to 7.9B in 2025, with net income climbing from 1.1B to 1.5B. Its gross margin holds a robust 69%, and the net margin remains healthy near 19%. Despite slight margin contraction in 2025, Roper’s scale and margin efficiency underpin strong earnings momentum.
Symbotic Inc. Analysis
Symbotic’s revenue surged impressively from 251M in 2021 to 2.2B in 2025, reflecting rapid growth. However, it posted a net loss of 17M in 2025, with a slim gross margin below 19% and negative EBIT margin. While expanding revenue fast, Symbotic’s profitability remains challenged, with operating losses widening in the latest year.
Scale and Profitability: Established Strength vs. Growth Struggles
Roper Technologies clearly outperforms Symbotic in profitability and margin control, boasting stable net income and strong cash conversion. Symbotic shows impressive top-line growth but struggles to translate scale into profits. Investors seeking dependable earnings will find Roper’s mature profile more attractive, while Symbotic suits those prioritizing growth potential despite ongoing losses.
Financial Ratios Comparison
These vital ratios act as a diagnostic tool to expose the underlying fiscal health, valuation premiums, and capital efficiency of the companies compared below:
| Ratios | Roper Technologies, Inc. (ROP) | Symbotic Inc. (SYM) |
|---|---|---|
| ROE | 7.7% | -7.7% |
| ROIC | 5.6% | -16.6% |
| P/E | 31.1 | -334.5 |
| P/B | 2.4 | 25.6 |
| Current Ratio | 0.52 | 1.08 |
| Quick Ratio | 0.48 | 0.99 |
| D/E | 0.47 | 0.14 |
| Debt-to-Assets | 27.0% | 1.3% |
| Interest Coverage | 6.9 | 0 |
| Asset Turnover | 0.23 | 0.94 |
| Fixed Asset Turnover | 50.4 | 15.9 |
| Payout ratio | 23.1% | 0% |
| Dividend yield | 0.74% | 0% |
| Fiscal Year | 2025 | 2025 |
Efficiency & Valuation Duel: The Vital Signs
Financial ratios act as the company’s DNA, unveiling hidden risks and operational excellence that raw numbers alone cannot show.
Roper Technologies, Inc.
Roper shows solid profitability with a 19.44% net margin but a modest 7.73% ROE, which lags industry leaders. Its P/E of 31.06 signals a stretched valuation relative to earnings. The company offers a low 0.74% dividend yield, favoring reinvestment to sustain growth amid a mixed ratio profile.
Symbotic Inc.
Symbotic suffers from negative profitability with a -0.75% net margin and -7.65% ROE, reflecting operational challenges. Despite a highly unfavorable P/B of 25.6, its negative P/E ratio indicates losses. The firm pays no dividends, focusing heavily on R&D to fuel future expansion, but carries notable financial risks.
Balanced Stability vs. Growth Gambit
Roper combines favorable cash flow metrics and moderate leverage, offering a balanced risk-reward profile despite stretched valuation. Symbotic’s aggressive growth investments come with substantial losses and weaker financial health. Investors seeking steadiness may prefer Roper, while those embracing high risk for growth might consider Symbotic’s profile.
Which one offers the Superior Shareholder Reward?
I see Roper Technologies, Inc. (ROP) maintains a steady dividend yield near 0.7% with a sustainable payout ratio around 21-23%, supported by strong free cash flow coverage above 90%. Its consistent buyback activity enhances total return. Symbotic Inc. (SYM) pays no dividends but reinvests heavily in growth, with no buybacks yet. ROP’s distribution model balances income and capital appreciation, making it superior for long-term shareholders in 2026.
Comparative Score Analysis: The Strategic Profile
The radar chart exposes the fundamental DNA and trade-offs of Roper Technologies and Symbotic Inc., highlighting their financial strengths and weaknesses side by side:
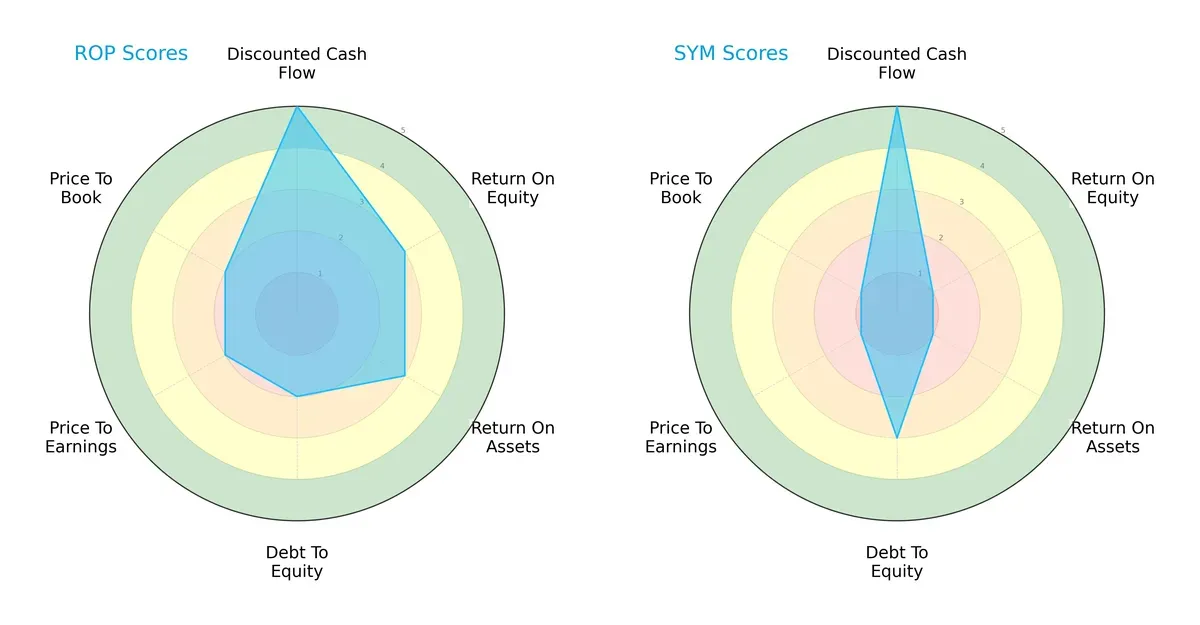
Roper shows a more balanced profile with moderate scores in ROE (3), ROA (3), and Debt/Equity (2), supported by a strong DCF score (5). Symbotic relies heavily on its DCF strength (5) but struggles with weak profitability metrics—ROE (1) and ROA (1)—and valuation scores (P/E and P/B at 1). Roper’s diversified strengths suggest steadier capital allocation, while Symbotic depends on future cash flow optimism.
—
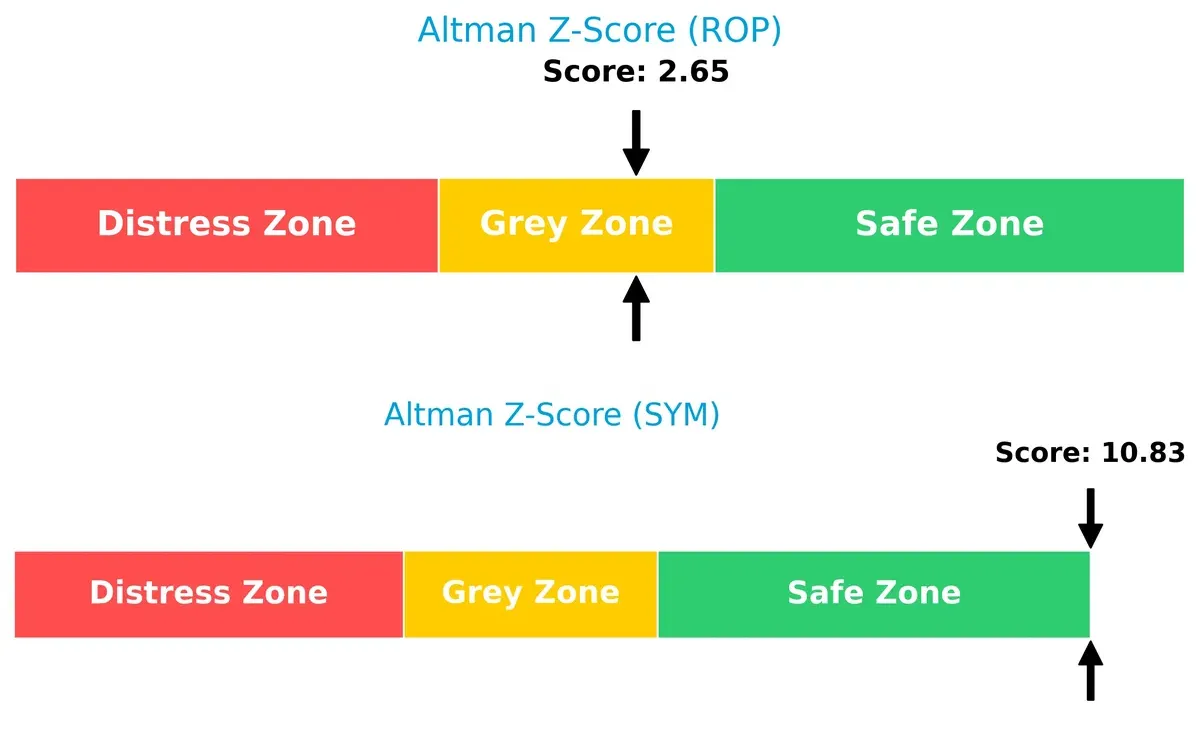
Bankruptcy Risk: Solvency Showdown
Roper’s Altman Z-Score of 2.65 places it in the grey zone, indicating moderate bankruptcy risk, while Symbotic’s 10.83 score signals a robust safe zone. This gap implies Symbotic currently holds a stronger financial cushion for long-term survival in this cycle:
—
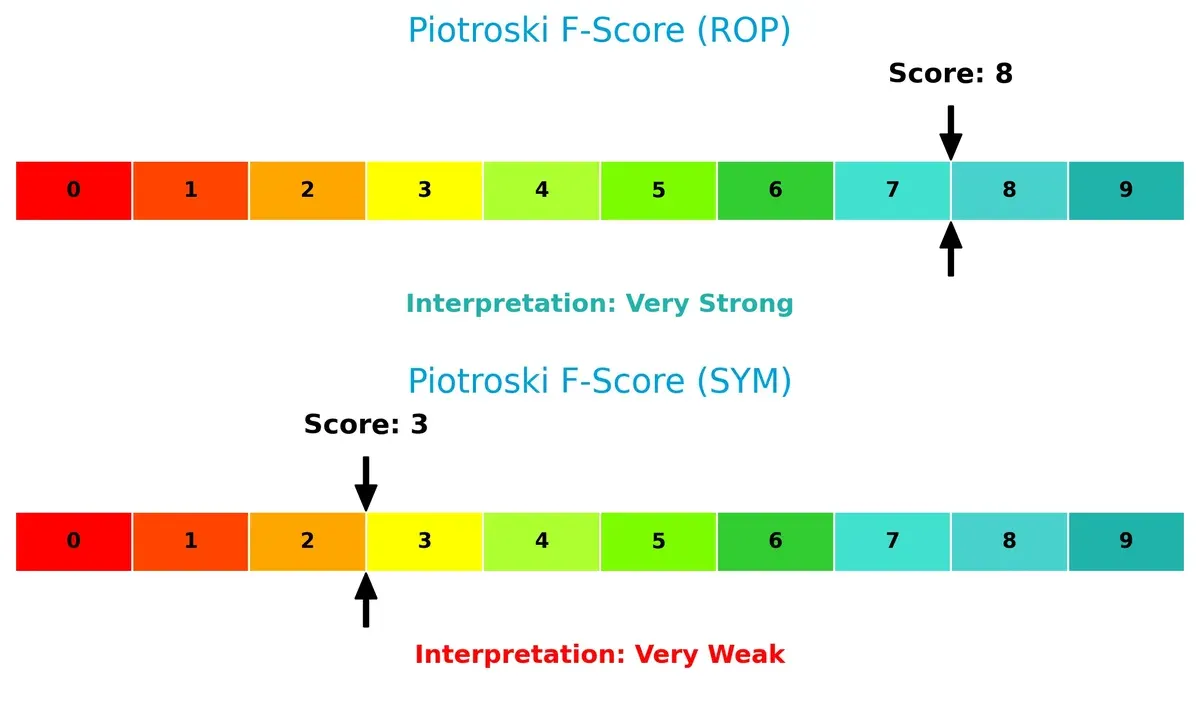
Financial Health: Quality of Operations
Roper’s Piotroski F-Score of 8 reflects very strong financial health, with solid internal metrics and operational quality. Symbotic’s low score of 3 flags potential internal weaknesses and operational risks to monitor closely:
How are the two companies positioned?
This section dissects the operational DNA of ROP and SYM by comparing their revenue distribution by segment and internal dynamics. The goal is to confront their economic moats to identify which model offers the most resilient, sustainable competitive advantage today.
Revenue Segmentation: The Strategic Mix
This comparison dissects how Roper Technologies and Symbotic diversify their income streams and reveals their primary sector bets:
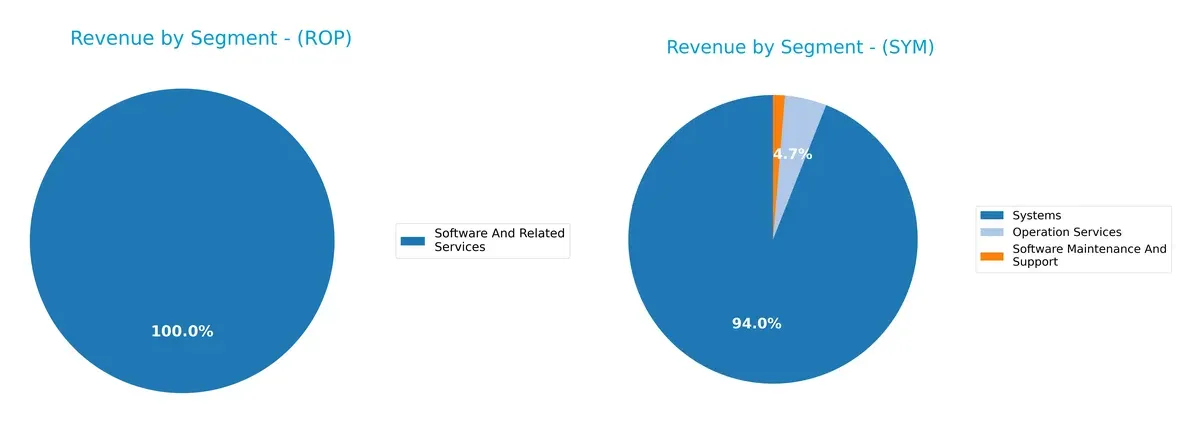
Roper Technologies displays a more diversified revenue mix, with key segments like Application Software ($3.19B), Network Software ($1.44B), and Technology-Enabled Products ($1.55B) anchoring growth. Symbotic, by contrast, pivots heavily on its Systems segment, which dwarfs its smaller Operation Services ($105M) and Software Maintenance ($30M) streams. Roper’s approach reduces concentration risk, while Symbotic’s dominance in Systems signals infrastructure focus but heightens vulnerability to sector shifts.
Strengths and Weaknesses Comparison
This table compares the Strengths and Weaknesses of Roper Technologies, Inc. and Symbotic Inc.:
ROP Strengths
- Diversified software and technology segments
- Favorable net margin at 19.44%
- Strong debt management with 27% debt-to-assets
- High fixed asset turnover at 50.37
- Significant US and global presence with billions in US revenue
SYM Strengths
- Favorable debt levels with 14% debt-to-equity and low debt-to-assets
- Neutral liquidity ratios near 1.0
- Moderate asset turnover at 0.94
- Growing US revenue base exceeding 2B
- Favorable PE metric despite negative earnings
ROP Weaknesses
- Low liquidity with current ratio at 0.52 and quick ratio at 0.48
- Unfavorable ROE at 7.73% below WACC at 7.27%
- Unfavorable asset turnover at 0.23
- High P/E of 31.06 could indicate overvaluation
- Low dividend yield at 0.74%
SYM Weaknesses
- Negative profitability metrics: net margin -0.75%, ROE -7.65%, ROIC -16.63%
- High WACC at 13.86% indicating costly capital
- Interest coverage at zero signals risk in debt servicing
- Unfavorable PB ratio at 25.6
- No dividend yield
Roper shows strengths in profitability and asset efficiency but faces liquidity and valuation challenges. Symbotic’s financial health is more strained with losses and high capital costs, despite controlled leverage and growing revenues. These profiles imply contrasting strategic priorities: operational efficiency and market expansion for Roper, and financial stabilization for Symbotic.
The Moat Duel: Analyzing Competitive Defensibility
A structural moat is the only true shield protecting long-term profits from relentless competition erosion. Let’s dissect two distinct moats:
Roper Technologies, Inc.: Diverse Intangible Assets and Software Integration
Roper’s moat stems from its vast portfolio of specialized software and engineered products, driving steady high ROIC around 28.6%. Despite shedding value versus WACC, its ROIC trend grows, signaling improving profitability in 2026.
Symbotic Inc.: Automation Network Effects in Warehouse Robotics
Symbotic leverages network effects in warehouse automation, gaining rapid revenue growth of 25.6%. Yet, its negative ROIC trend and losses reflect early-stage scaling challenges unlike Roper’s more stable moat. Expansion into new retail automation markets could disrupt industry norms.
Verdict: Software-Driven Diversification vs. Emerging Automation Network
Roper owns a wider, more diversified moat with improving profitability despite slight value destruction. Symbotic’s moat remains narrow and fragile with declining returns. Roper is better positioned to defend market share amid competitive pressures.
Which stock offers better returns?
Over the past 12 months, Roper Technologies, Inc. showed significant price declines while Symbotic Inc. gained value, reflecting contrasting trading dynamics and market sentiment.
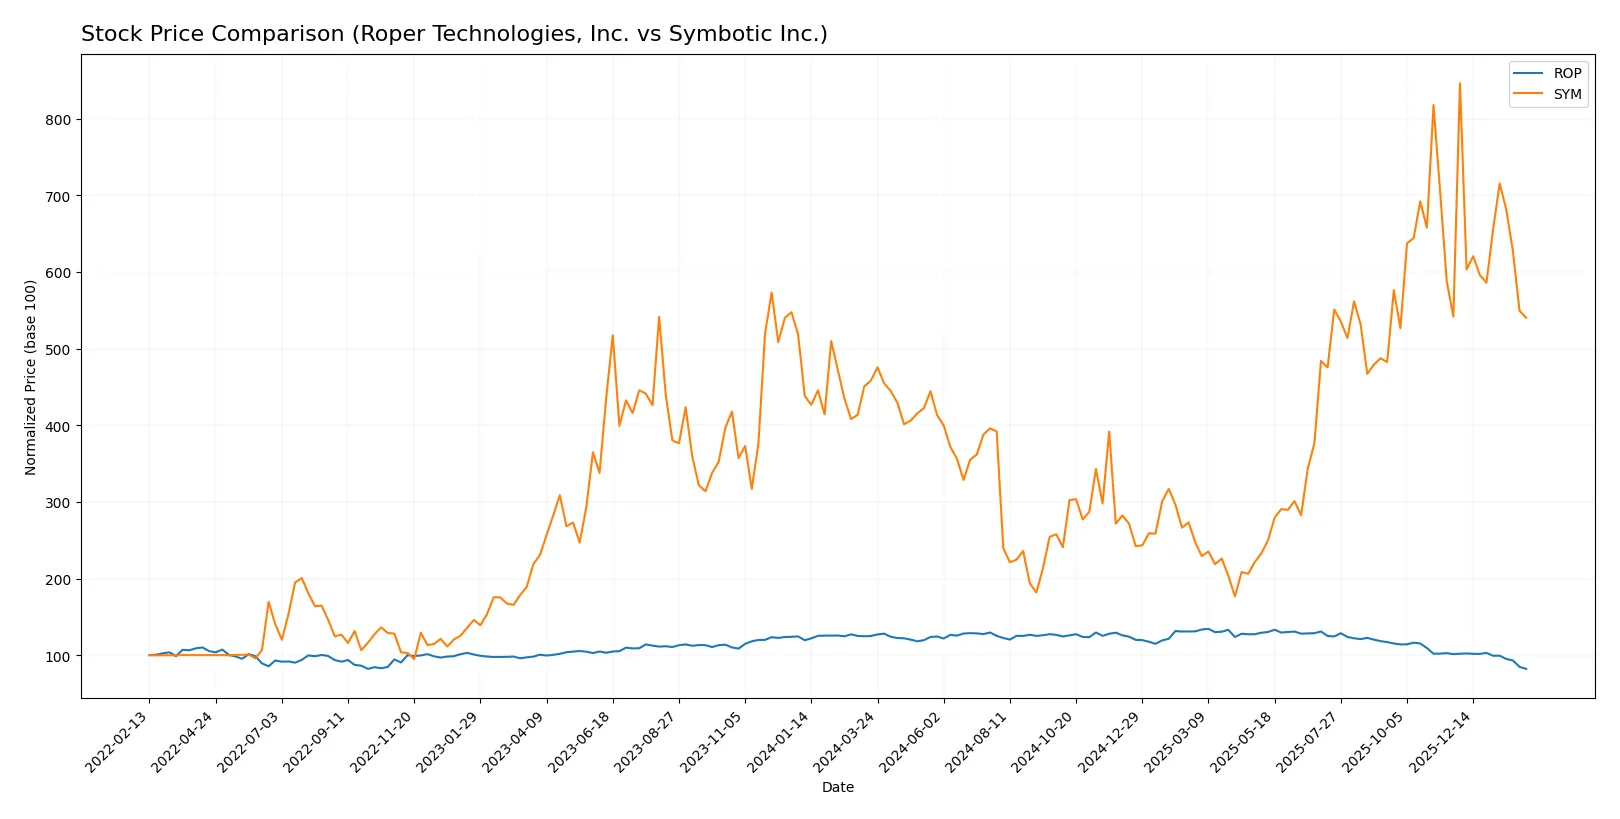
Trend Comparison
Roper Technologies, Inc. experienced a bearish trend with a -34.28% price decline over the past year, showing deceleration and a recent downward slope of -7.25. Volatility remains elevated at a 47.92% standard deviation.
Symbotic Inc. displayed a bullish trend with a 17.9% gain over the same period, though the trend decelerated recently with a slight -0.3% decline and low volatility at 15.71% standard deviation.
Symbotic outperformed Roper overall, delivering positive market returns while Roper suffered marked losses throughout the year.
Target Prices
Analysts present a balanced target price consensus for Roper Technologies, Inc. and Symbotic Inc.
| Company | Target Low | Target High | Consensus |
|---|---|---|---|
| Roper Technologies, Inc. | 365 | 575 | 475.5 |
| Symbotic Inc. | 42 | 83 | 65.56 |
The target consensus for Roper suggests a 32% upside from the current 360 price, signaling strong growth potential. Symbotic’s consensus implies a 23% upside, reflecting cautious optimism amid higher volatility.

Don’t Let Luck Decide Your Entry Point
Optimize your entry points with our advanced ProRealTime indicators. You’ll get efficient buy signals with precise price targets for maximum performance. Start outperforming now!
How do institutions grade them?
Institutional grades reflect the current analyst sentiment for Roper Technologies and Symbotic Inc.:
Roper Technologies, Inc. Grades
Below are the recent grades from leading financial institutions for Roper Technologies:
| Grading Company | Action | New Grade | Date |
|---|---|---|---|
| Goldman Sachs | maintain | Neutral | 2026-01-29 |
| Argus Research | downgrade | Hold | 2026-01-28 |
| Mizuho | maintain | Underperform | 2026-01-28 |
| RBC Capital | maintain | Sector Perform | 2026-01-28 |
| Stifel | downgrade | Hold | 2026-01-28 |
| Citigroup | maintain | Buy | 2026-01-28 |
| JP Morgan | maintain | Underweight | 2026-01-28 |
| Truist Securities | maintain | Buy | 2026-01-28 |
| Barclays | maintain | Underweight | 2026-01-28 |
| Oppenheimer | downgrade | Perform | 2026-01-28 |
Symbotic Inc. Grades
The following table summarizes institutional grades for Symbotic Inc.:
| Grading Company | Action | New Grade | Date |
|---|---|---|---|
| Barclays | maintain | Underweight | 2026-01-12 |
| Goldman Sachs | downgrade | Sell | 2025-12-02 |
| Barclays | maintain | Underweight | 2025-11-26 |
| Baird | maintain | Neutral | 2025-11-26 |
| DA Davidson | maintain | Neutral | 2025-11-25 |
| Cantor Fitzgerald | maintain | Overweight | 2025-11-25 |
| Needham | maintain | Buy | 2025-11-25 |
| Craig-Hallum | upgrade | Buy | 2025-11-25 |
| Citigroup | maintain | Buy | 2025-11-25 |
| Northland Capital Markets | maintain | Outperform | 2025-11-25 |
Which company has the best grades?
Roper Technologies mostly holds neutral to hold ratings with some buy support, reflecting moderate confidence. Symbotic’s grades show greater polarization, including several buy ratings but also notable sell and underweight opinions. This divergence may create varying risk perceptions for investors.
Risks specific to each company
The following categories identify the critical pressure points and systemic threats facing both firms in the 2026 market environment:
1. Market & Competition
Roper Technologies, Inc.
- Established with diverse industrial software and hardware, faces mature market competition.
Symbotic Inc.
- Newer player focused on warehouse automation, competes in a rapidly evolving tech niche.
2. Capital Structure & Debt
Roper Technologies, Inc.
- Moderate debt-to-equity ratio (0.47) with strong interest coverage (6.96).
Symbotic Inc.
- Low debt-to-equity (0.14) but zero interest coverage signals potential liquidity risk.
3. Stock Volatility
Roper Technologies, Inc.
- Beta of 0.93 suggests lower volatility than the market.
Symbotic Inc.
- High beta of 2.139 indicates high stock price volatility.
4. Regulatory & Legal
Roper Technologies, Inc.
- Operates in diversified industries with established compliance track record.
Symbotic Inc.
- Emerging tech firm subject to evolving automation and robotics regulations.
5. Supply Chain & Operations
Roper Technologies, Inc.
- Broad product lines may face complex supply chain risks but benefits from scale.
Symbotic Inc.
- Focused on warehouse automation, supply chain disruptions could heavily impact operations.
6. ESG & Climate Transition
Roper Technologies, Inc.
- Legacy industrial footprint may face pressure to improve ESG metrics.
Symbotic Inc.
- Innovative tech focus offers growth in sustainable automation solutions.
7. Geopolitical Exposure
Roper Technologies, Inc.
- Primarily US-based with moderate global exposure and related risks.
Symbotic Inc.
- Concentrated US operations reduce geopolitical complexity but limit global diversification.
Which company shows a better risk-adjusted profile?
Roper Technologies faces its biggest risk in liquidity, evidenced by a weak current ratio below 1. Symbotic’s chief threat lies in operational and profitability struggles, reflected in its negative margins and weak financial scores. Roper’s moderate stock volatility and stronger capital structure give it a better risk-adjusted profile. Notably, Symbotic’s high beta and poor interest coverage raise red flags about financial resilience amid market stress.
Final Verdict: Which stock to choose?
Roper Technologies, Inc. (ROP) excels as a cash generator with a resilient business model that steadily grows profitability despite macro pressures. Its main point of vigilance lies in a weak liquidity position, suggesting caution in downturns. ROP suits investors targeting stable, income-oriented growth within industrial sectors.
Symbotic Inc. (SYM) boasts a strategic moat in automation innovation and rapid revenue expansion. It carries greater financial risk with negative returns and volatile margins but offers a diversification edge. SYM fits growth-oriented portfolios willing to tolerate early-stage operational challenges for potential market disruption.
If you prioritize consistent cash flow and a proven operating model, ROP outshines as the safer choice due to its robust income generation and manageable leverage. However, if you seek aggressive growth with innovation upside and can accept elevated risk, SYM offers superior expansion potential despite current profitability headwinds.
Disclaimer: Investment carries a risk of loss of initial capital. The past performance is not a reliable indicator of future results. Be sure to understand risks before making an investment decision.
Go Further
I encourage you to read the complete analyses of Roper Technologies, Inc. and Symbotic Inc. to enhance your investment decisions: