Home > Comparison > Industrials > ROP vs PD
The strategic rivalry between Roper Technologies, Inc. and PagerDuty, Inc. shapes the future of industrial and technology sectors. Roper operates as a diversified industrial machinery and software powerhouse, while PagerDuty focuses on high-growth digital operations management software. This head-to-head pits industrial diversification against pure tech innovation. This analysis will reveal which corporate strategy offers the superior risk-adjusted return for a diversified portfolio in today’s dynamic market environment.

Table of contents
Companies Overview
Roper Technologies and PagerDuty stand as influential players in their respective industrial and technology markets.
Roper Technologies, Inc.: Diverse Industrial Software & Solutions Leader
Roper Technologies dominates the industrial machinery sector through a broad portfolio of software and engineered products. Its revenue derives from cloud-based software spanning financial analytics, healthcare, and supply chain, alongside precision instruments and control systems. In 2026, Roper focuses on expanding its cloud software ecosystem integrated with specialized hardware to enhance operational efficiency across industries.
PagerDuty, Inc.: Digital Operations Management Innovator
PagerDuty defines itself as a leading platform in digital operations management. It generates revenue by leveraging machine learning to process and predict issues from software-enabled systems across diverse sectors. In 2026, PagerDuty prioritizes refining its AI-driven predictive analytics to deepen customer engagement and expand its footprint in technology and telecommunications industries.
Strategic Collision: Similarities & Divergences
Both companies leverage software to solve complex operational challenges but diverge sharply in scope. Roper integrates hardware and software within industrial settings, whereas PagerDuty offers a purely digital, cloud-native platform. Their primary battleground is operational efficiency software, with Roper targeting industrial clients and PagerDuty focusing on tech-centric enterprises. This contrast shapes distinct investment profiles: Roper’s diversified industrial base versus PagerDuty’s high-growth, tech-focused model.
Income Statement Comparison
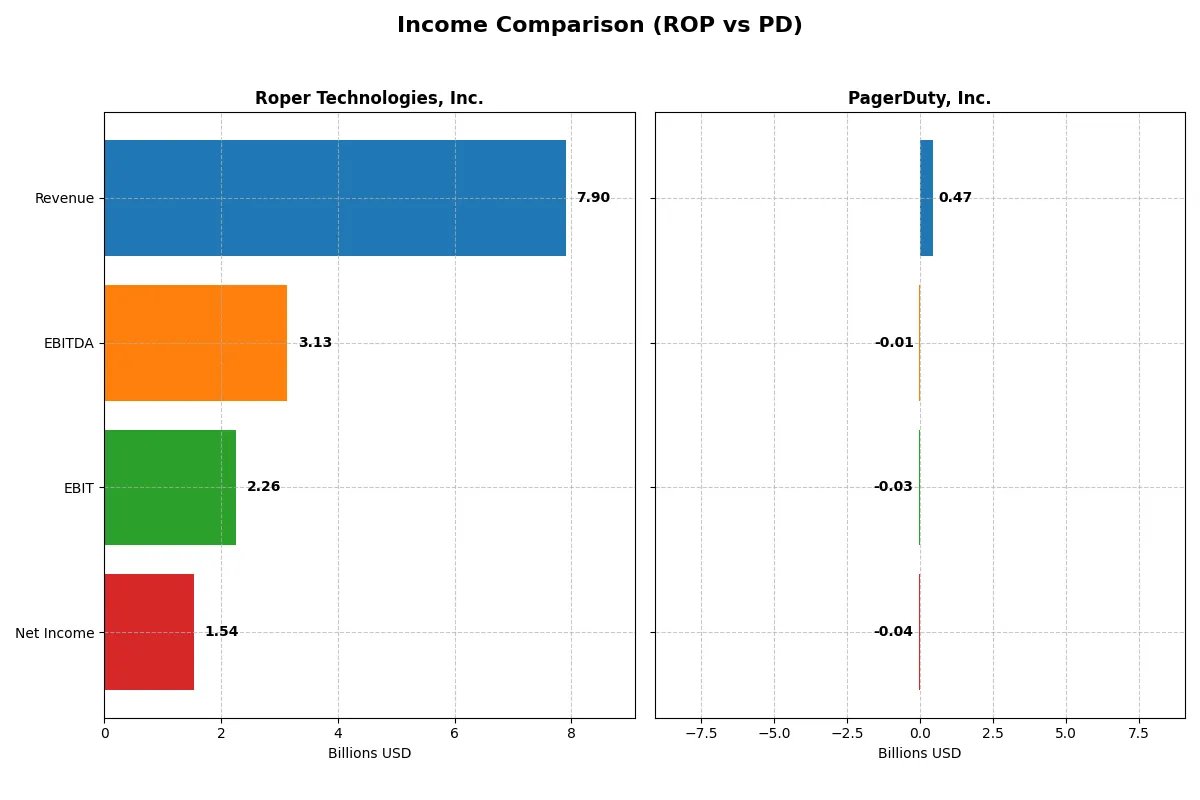
This data dissects the core profitability and scalability of both corporate engines to reveal who dominates the bottom line:
| Metric | Roper Technologies, Inc. (ROP) | PagerDuty, Inc. (PD) |
|---|---|---|
| Revenue | 7.9B | 467.5M |
| Cost of Revenue | 2.43B | 79.7M |
| Operating Expenses | 3.24B | 447.6M |
| Gross Profit | 5.47B | 387.8M |
| EBITDA | 3.13B | -11.9M |
| EBIT | 2.26B | -32.5M |
| Interest Expense | 325M | 9.3M |
| Net Income | 1.54B | -42.7M |
| EPS | 14.31 | -0.59 |
| Fiscal Year | 2025 | 2025 |
Income Statement Analysis: The Bottom-Line Duel
This income statement comparison reveals how efficiently Roper Technologies and PagerDuty convert sales into profits and manage costs over time.
Roper Technologies, Inc. Analysis
Roper Technologies steadily grows revenue from 4.8B in 2021 to 7.9B in 2025, with net income rising from 1.1B to 1.5B. Gross margin holds strong at 69%, and net margin beats 19%, signaling solid profitability. However, net margin declined slightly in 2025 despite revenue momentum, reflecting rising operating expenses.
PagerDuty, Inc. Analysis
PagerDuty expands revenue impressively from 213M in 2021 to 467M in 2025, nearly doubling over five years. Gross margin is high at 83%, but the company remains unprofitable, with negative net margins near -9%. Encouragingly, PagerDuty improved EBIT and net margins sharply in 2025, showing clear progress toward profitability.
Margin Strength vs. Growth Ambition
Roper Technologies delivers consistent profitability with wider margins and solid net income growth, outperforming PagerDuty in absolute earnings. PagerDuty exhibits faster revenue growth and improving margins but remains unprofitable. For investors, Roper’s established profit engine offers stability, while PagerDuty’s profile appeals to those seeking growth with improving operational efficiency.
Financial Ratios Comparison
These vital ratios act as a diagnostic tool to expose the underlying fiscal health, valuation premiums, and capital efficiency of the companies compared below:
| Ratios | Roper Technologies, Inc. (ROP) | PagerDuty, Inc. (PD) |
|---|---|---|
| ROE | 7.7% | -32.9% |
| ROIC | 5.6% | -9.7% |
| P/E | 31.1 | -39.9 |
| P/B | 2.4 | 13.1 |
| Current Ratio | 0.52 | 1.87 |
| Quick Ratio | 0.48 | 1.87 |
| D/E | 0.47 | 3.57 |
| Debt-to-Assets | 27.0% | 50.0% |
| Interest Coverage | 6.9 | -6.5 |
| Asset Turnover | 0.23 | 0.50 |
| Fixed Asset Turnover | 50.4 | 16.6 |
| Payout ratio | 23.1% | 0 |
| Dividend yield | 0.74% | 0 |
| Fiscal Year | 2025 | 2025 |
Efficiency & Valuation Duel: The Vital Signs
Financial ratios act as a company’s DNA, uncovering hidden operational strengths and risks that shape investment outcomes.
Roper Technologies, Inc.
Roper shows solid profitability with a 7.7% ROE and a robust 19.4% net margin, signaling operational efficiency. Its P/E of 31.1 suggests a stretched valuation, yet a reasonable P/B of 2.4. Shareholders receive a modest 0.74% dividend yield, reflecting a balanced approach between income and reinvestment.
PagerDuty, Inc.
PagerDuty struggles with deep losses and a negative 32.9% ROE, highlighting ongoing operational challenges. Despite a negative P/E, its EV/Sales of 3.9 indicates moderate valuation. The company pays no dividends, focusing heavily on R&D (30.3% of revenue) to fuel future growth, though debt levels and coverage ratios raise caution.
Operational Strength vs. Growth Risk
Roper delivers efficiency and modest income but trades at a premium, reflecting steady but limited upside. PagerDuty presents high growth potential with heavy reinvestment but carries significant financial risks. Investors preferring stability may lean towards Roper, while those seeking growth might consider PagerDuty’s riskier profile.
Which one offers the Superior Shareholder Reward?
I compare Roper Technologies, Inc. (ROP) and PagerDuty, Inc. (PD) on their shareholder reward policies. ROP offers a 0.74% dividend yield with a sustainable 23% payout ratio, backed by free cash flow of 23.3/share and active buybacks. PD pays no dividend, reinvesting heavily in growth, with modest buybacks implied by stable free cash flow of 1.18/share. ROP’s consistent dividends plus buybacks deliver steady total returns. PD’s reinvestment strategy targets long-term growth but carries higher risk given negative profit margins and high leverage. I conclude ROP offers the superior total shareholder reward in 2026, balancing income and capital return more sustainably.
Comparative Score Analysis: The Strategic Profile
The radar chart reveals the fundamental DNA and trade-offs of Roper Technologies, Inc. and PagerDuty, Inc., highlighting their distinct financial strengths and vulnerabilities:
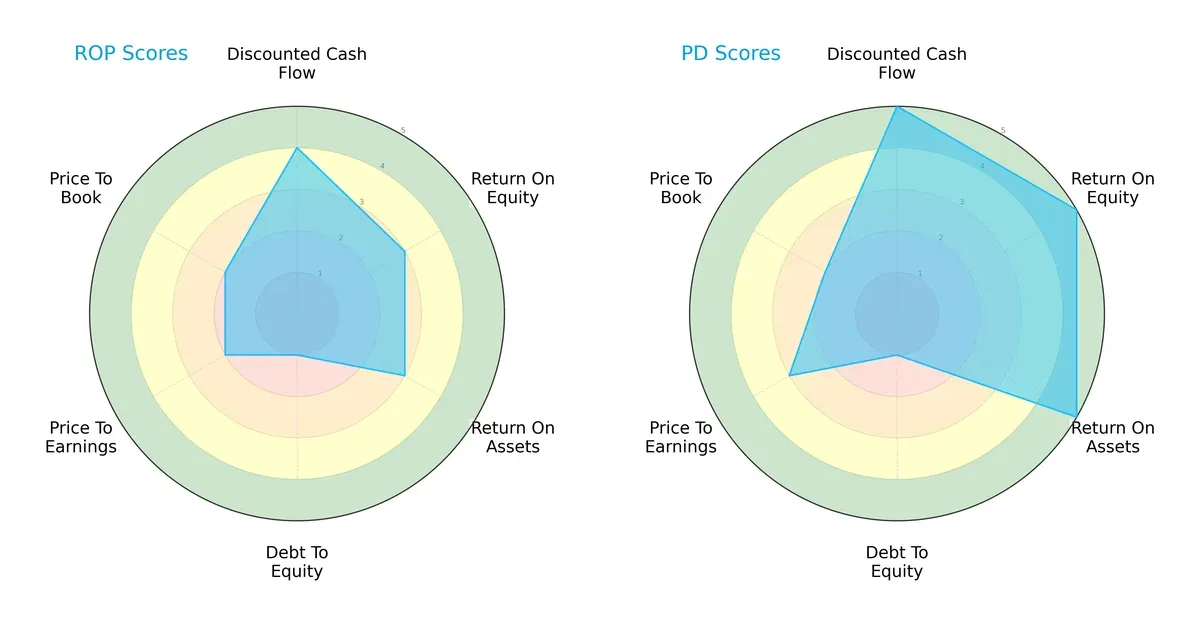
PagerDuty outperforms Roper with higher scores in DCF (5 vs. 4), ROE (5 vs. 3), and ROA (5 vs. 3), signaling superior profitability and asset efficiency. Both firms share a weak debt-to-equity score (1), indicating high leverage risk. Roper holds a slight edge in valuation metrics but shows a more moderate overall profile. PagerDuty relies on operational excellence, while Roper presents a more balanced, though less dynamic, financial stance.
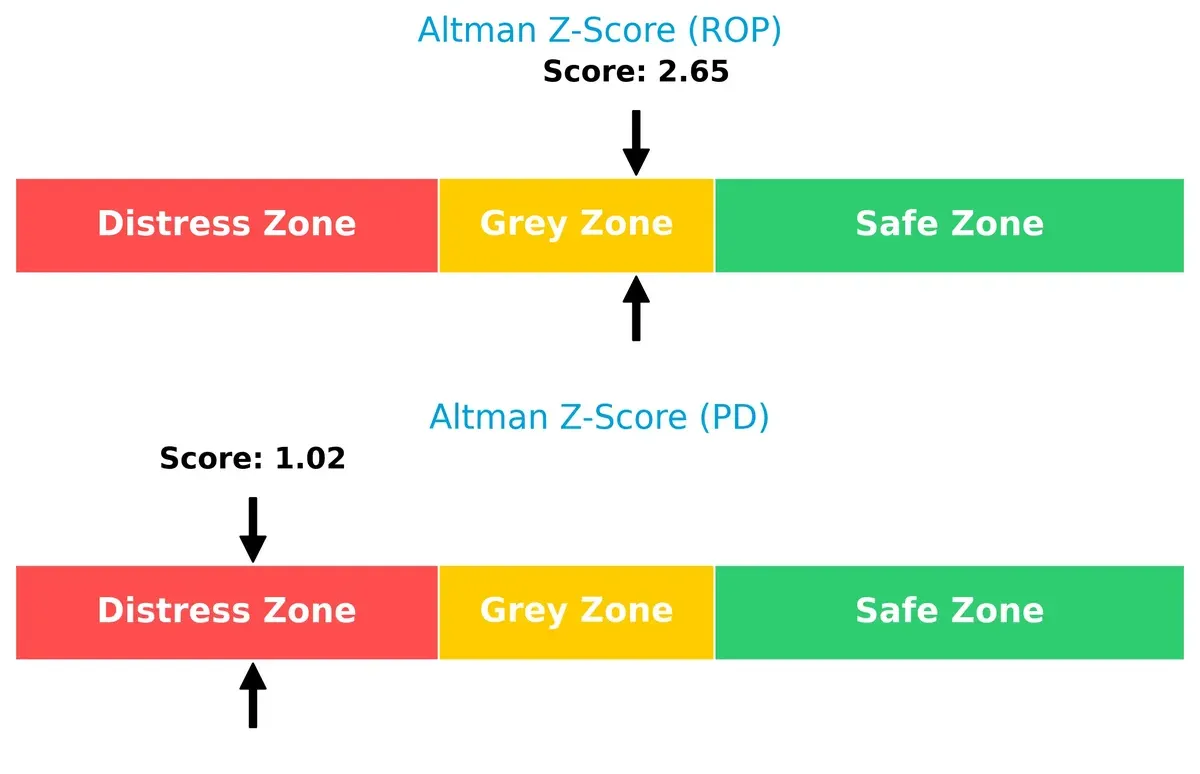
Bankruptcy Risk: Solvency Showdown
PagerDuty’s Altman Z-Score sits in the distress zone at 1.02, signaling serious bankruptcy risks. Roper, at 2.65 in the grey zone, faces moderate risk but holds a safer position for survival in the current economic cycle:
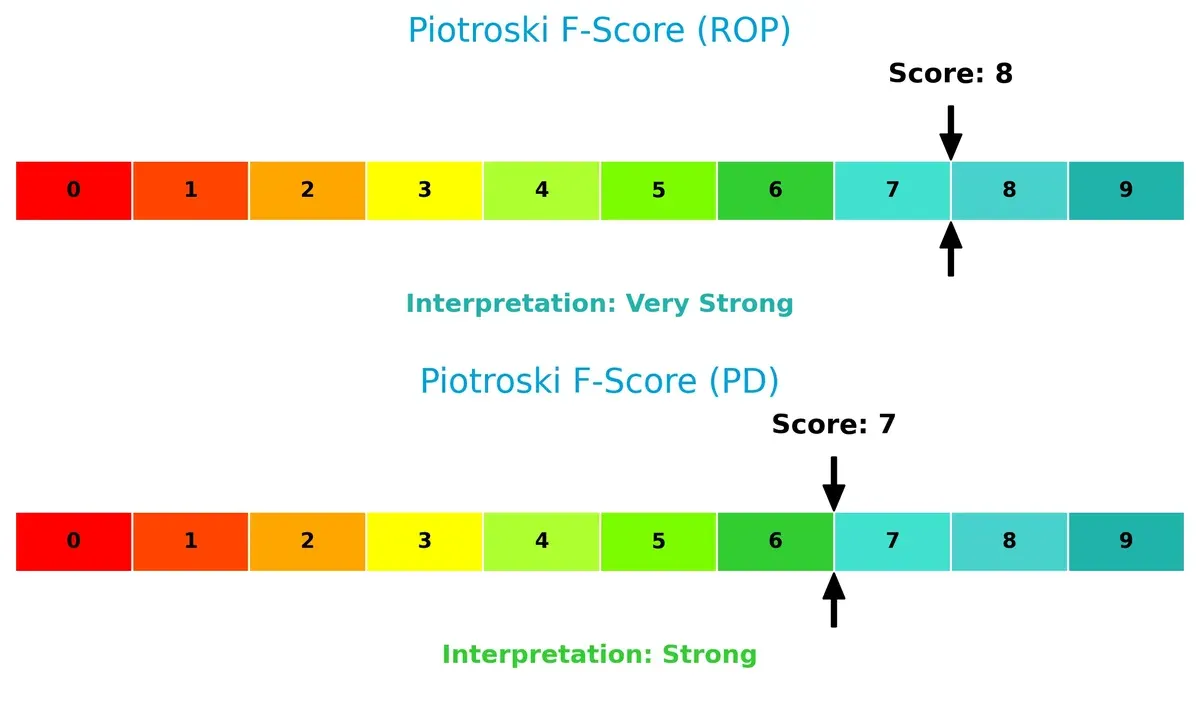
Financial Health: Quality of Operations
Roper scores an 8 on the Piotroski F-Score, reflecting very strong financial health and operational quality. PagerDuty follows closely with a 7, indicating strong but slightly less robust internal metrics:
How are the two companies positioned?
This section dissects the operational DNA of Roper and PagerDuty by comparing revenue distribution and internal dynamics, including strengths and weaknesses. The goal is to confront their economic moats and identify which business model offers the most resilient and sustainable competitive advantage today.
Revenue Segmentation: The Strategic Mix
The following visual comparison dissects how Roper Technologies, Inc. and PagerDuty, Inc. diversify their income streams and reveals their primary sector bets:
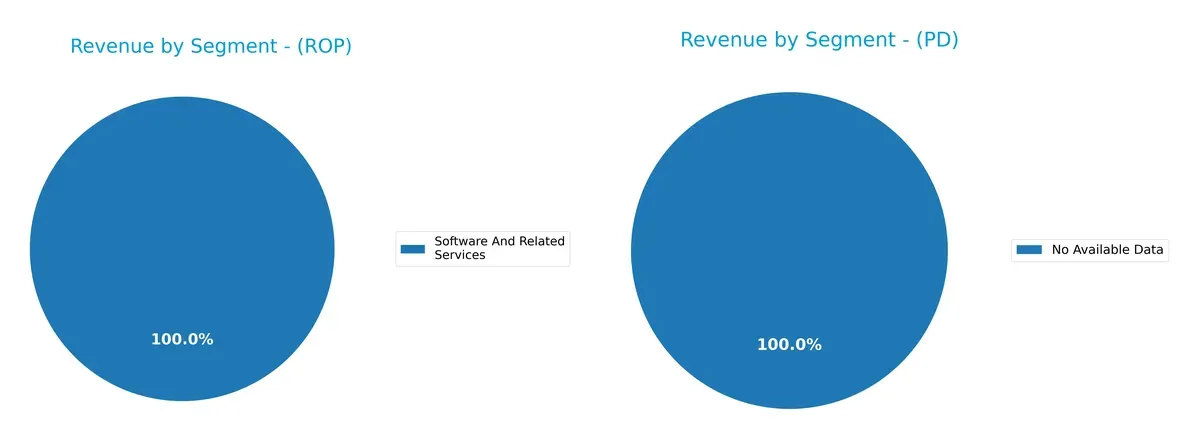
Roper Technologies shows a balanced revenue mix across Application Software ($3.19B), Network Software ($1.44B), and Technology Enabled Products ($1.55B) in 2023. This diversification contrasts sharply with PagerDuty, which lacks available segment data. Roper’s spread reduces concentration risk and signals a strategic pivot towards software ecosystems and infrastructure dominance. I see this as a competitive moat, anchoring Roper’s resilience in volatile markets. PagerDuty’s absence of segmentation data leaves its reliance and risk profile unclear.
Strengths and Weaknesses Comparison
This table compares the Strengths and Weaknesses of Roper Technologies, Inc. and PagerDuty, Inc.:
ROP Strengths
- Strong diversification across software and technology segments
- Robust net margin at 19.44%
- Favorable debt to equity and interest coverage ratios
- Significant US market presence with $6B+ revenue
- Consistent fixed asset turnover indicating efficiency
PD Strengths
- Favorable WACC at 5.82% indicating lower capital cost
- Strong liquidity with current and quick ratios at 1.87
- Growing international revenue with $130M non-US sales
- Favorable fixed asset turnover of 16.61
ROP Weaknesses
- Low liquidity ratios (current 0.52, quick 0.48) pose short-term risk
- Unfavorable ROE at 7.73% below WACC of 7.27%
- High P/E of 31.06 reflects valuation caution
- Low asset turnover at 0.23 limits asset efficiency
- Low dividend yield at 0.74%
PD Weaknesses
- Negative profitability ratios: net margin -9.14%, ROE -32.92%, ROIC -9.66%
- High leverage with debt to equity at 3.57 and debt to assets 50%
- Negative interest coverage ratio (-3.51) signals risk
- Elevated P/B ratio at 13.12 highlights valuation risk
- No dividend yield
Roper demonstrates diversified revenue streams and solid profitability but struggles with liquidity and asset efficiency. PagerDuty’s strengths lie in liquidity and cost of capital, yet it faces significant challenges in profitability and leverage. These contrasts highlight differing strategic priorities and financial health profiles.
The Moat Duel: Analyzing Competitive Defensibility
A structural moat is the only shield that protects long-term profits from relentless competition erosion. Let’s examine two distinct moats in action:
Roper Technologies, Inc.: Diversified Industrial Intangible Asset Moat
Roper’s moat stems from intangible assets across niche industrial software and engineered products. Its stable 28.6% EBIT margin reflects strong pricing power. Expansion into cloud analytics deepens competitive barriers in 2026.
PagerDuty, Inc.: Network Effect-Driven Digital Operations Platform
PagerDuty leverages network effects by integrating data signals across software ecosystems. Unlike Roper, PagerDuty’s moat relies on rapid revenue growth and machine learning innovation. Its expanding global footprint fuels disruption opportunities.
Industrial Intangibles vs. Network Effects: The Moat Showdown
Both firms show slightly unfavorable ROIC versus WACC but growing profitability trends. Roper’s diversified intangible assets create a wider moat, while PagerDuty’s network effect is narrower but rapidly evolving. Roper stands better positioned to defend its entrenched market share over the long haul.
Which stock offers better returns?
Over the past 12 months, both stocks exhibit notable declines, with Roper Technologies showing a steadier but still bearish descent, while PagerDuty experiences a sharper drop and lower volatility.
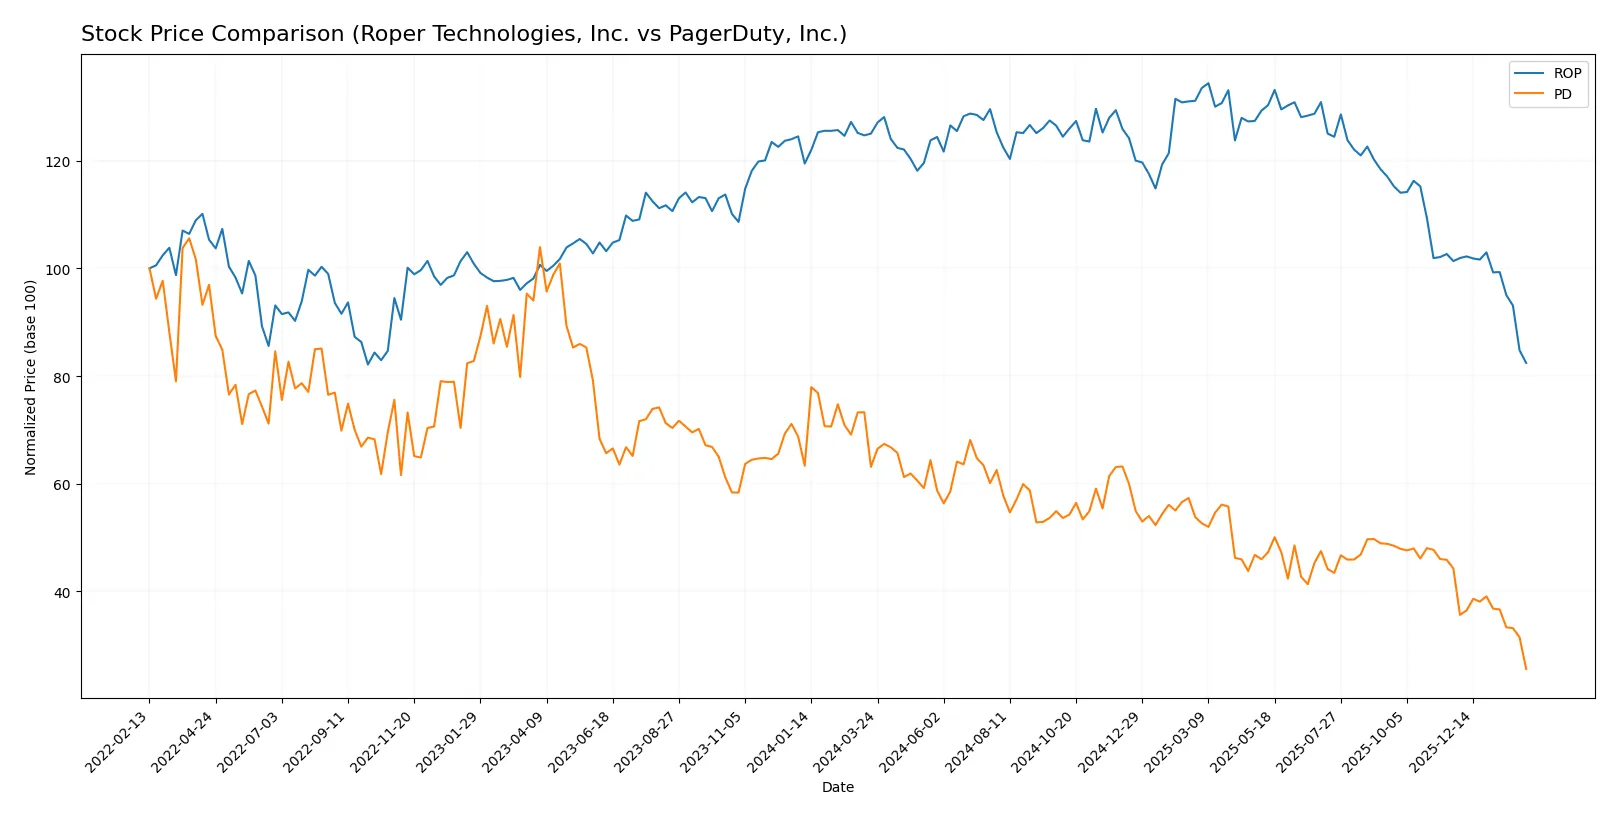
Trend Comparison
Roper Technologies, Inc. shows a 34.07% price decline over the past year, indicating a bearish trend with decelerating losses and a high volatility level of 47.87. The stock peaked at 588.38 and bottomed at 360.89.
PagerDuty, Inc. experienced a steeper 59.41% drop in the same period, also bearish with decelerating losses. Its volatility is much lower at 2.99, with a high of 22.93 and a low of 8.62.
PagerDuty’s stock has delivered the lower market performance, with a more pronounced decline compared to Roper Technologies, despite both showing bearish trends and deceleration.
Target Prices
Analysts present a clear target price consensus for Roper Technologies, Inc. and PagerDuty, Inc.
| Company | Target Low | Target High | Consensus |
|---|---|---|---|
| Roper Technologies, Inc. | 365 | 575 | 475.5 |
| PagerDuty, Inc. | 15 | 19 | 16.2 |
Roper’s target consensus at 475.5 suggests a roughly 32% upside from the current 360.5 stock price. PagerDuty’s consensus at 16.2 implies nearly 88% potential growth above the current 8.63 price.

Don’t Let Luck Decide Your Entry Point
Optimize your entry points with our advanced ProRealTime indicators. You’ll get efficient buy signals with precise price targets for maximum performance. Start outperforming now!
How do institutions grade them?
The following tables summarize recent grades assigned by major financial institutions for Roper Technologies, Inc. and PagerDuty, Inc.:
Roper Technologies, Inc. Grades
This table lists updated grades from several reputable grading companies for Roper Technologies, Inc.:
| Grading Company | Action | New Grade | Date |
|---|---|---|---|
| Goldman Sachs | Maintain | Neutral | 2026-01-29 |
| Argus Research | Downgrade | Hold | 2026-01-28 |
| Mizuho | Maintain | Underperform | 2026-01-28 |
| RBC Capital | Maintain | Sector Perform | 2026-01-28 |
| Stifel | Downgrade | Hold | 2026-01-28 |
| Citigroup | Maintain | Buy | 2026-01-28 |
| JP Morgan | Maintain | Underweight | 2026-01-28 |
| Truist Securities | Maintain | Buy | 2026-01-28 |
| Barclays | Maintain | Underweight | 2026-01-28 |
| Oppenheimer | Downgrade | Perform | 2026-01-28 |
PagerDuty, Inc. Grades
Below are recent credible grading updates for PagerDuty, Inc. from established financial firms:
| Grading Company | Action | New Grade | Date |
|---|---|---|---|
| Truist Securities | Maintain | Buy | 2026-01-07 |
| RBC Capital | Downgrade | Sector Perform | 2026-01-05 |
| Craig-Hallum | Downgrade | Hold | 2025-11-26 |
| Morgan Stanley | Maintain | Equal Weight | 2025-11-26 |
| RBC Capital | Maintain | Outperform | 2025-11-26 |
| TD Cowen | Maintain | Buy | 2025-11-26 |
| Truist Securities | Maintain | Buy | 2025-11-19 |
| RBC Capital | Maintain | Outperform | 2025-09-04 |
| Baird | Maintain | Neutral | 2025-09-04 |
| Canaccord Genuity | Maintain | Buy | 2025-09-04 |
Which company has the best grades?
PagerDuty, Inc. generally holds stronger grades, including multiple “Buy” and “Outperform” ratings. Roper Technologies, Inc. has more mixed reviews, with several downgrades and neutral or underweight assessments. Investors may perceive PagerDuty’s grades as more favorable signals.
Risks specific to each company
The following categories outline critical pressure points and systemic threats facing Roper Technologies, Inc. and PagerDuty, Inc. in the 2026 market environment:
1. Market & Competition
Roper Technologies, Inc.
- Faces mature industrial machinery competition with steady demand but limited growth bursts.
PagerDuty, Inc.
- Operates in fast-evolving software sector with intense competition and pressure to innovate rapidly.
2. Capital Structure & Debt
Roper Technologies, Inc.
- Maintains moderate debt with favorable interest coverage and balanced leverage.
PagerDuty, Inc.
- High debt-to-equity ratio (3.57) raises financial risk; negative interest coverage signals distress.
3. Stock Volatility
Roper Technologies, Inc.
- Beta near 0.93 indicates moderate volatility aligned with broader market trends.
PagerDuty, Inc.
- Lower beta (0.67) suggests less sensitivity to market swings but faces wide price range and trading volume.
4. Regulatory & Legal
Roper Technologies, Inc.
- Industrial regulations and compliance cost remain manageable but require vigilance.
PagerDuty, Inc.
- Software industry regulatory risks include data privacy and cross-border compliance challenges.
5. Supply Chain & Operations
Roper Technologies, Inc.
- Complex global supply chains for machinery parts vulnerable to disruptions.
PagerDuty, Inc.
- Cloud-based platform depends on stable internet infrastructure and data center operations.
6. ESG & Climate Transition
Roper Technologies, Inc.
- Industrial footprint demands ongoing adaptation to environmental regulations and sustainability norms.
PagerDuty, Inc.
- Software model has lower direct emissions but faces increasing scrutiny on data center energy use.
7. Geopolitical Exposure
Roper Technologies, Inc.
- US base with global sales; exposed to trade policy shifts and tariffs.
PagerDuty, Inc.
- International operations expose it to geopolitical risks affecting digital infrastructure access.
Which company shows a better risk-adjusted profile?
Roper Technologies’ most impactful risk is its unfavorable liquidity ratios, posing short-term operational strain. PagerDuty’s critical risk lies in its heavy leverage and negative interest coverage, threatening solvency. Despite PagerDuty’s growth potential, Roper’s balanced capital structure and stronger financial stability deliver a superior risk-adjusted profile. Recent 2025 data confirm PagerDuty’s distress-zone Altman Z-Score versus Roper’s grey-zone status, underscoring my caution.
Final Verdict: Which stock to choose?
Roper Technologies, Inc. (ROP) shines through its enduring operational cash flow strength and steady revenue growth. Its superpower lies in efficient capital allocation and a resilient business model. However, its low current ratio signals a liquidity point of vigilance. ROP suits investors seeking stable, long-term industrial exposure.
PagerDuty, Inc. (PD) commands a strategic moat rooted in its cloud-native platform and strong revenue momentum. Its recurring revenue model offers growth visibility, although profitability metrics remain under pressure, indicating higher risk. PD fits portfolios oriented toward growth at a reasonable price with a tolerance for volatility.
If you prioritize operational stability and cash flow resilience, Roper Technologies outshines as the compelling choice due to its proven capital efficiency and steady income. However, if you seek dynamic growth supported by a scalable cloud platform, PagerDuty offers superior revenue expansion and innovation potential despite current profitability challenges.
Disclaimer: Investment carries a risk of loss of initial capital. The past performance is not a reliable indicator of future results. Be sure to understand risks before making an investment decision.
Go Further
I encourage you to read the complete analyses of Roper Technologies, Inc. and PagerDuty, Inc. to enhance your investment decisions: