Home > Comparison > Industrials > ROP vs EPAM
The strategic rivalry between Roper Technologies, Inc. and EPAM Systems, Inc. shapes the future of their industries. Roper, an industrial conglomerate, blends precision machinery with software solutions. EPAM excels as a digital engineering powerhouse within technology services. This head-to-head pits traditional industrial diversification against pure-play digital innovation. This analysis will clarify which business model delivers superior risk-adjusted returns for a balanced portfolio in today’s evolving market landscape.
Table of contents
Companies Overview
Roper Technologies and EPAM Systems both hold pivotal roles in their respective industrial and technology markets.
Roper Technologies, Inc.: Diversified Industrial Technology Leader
Roper Technologies stands as a diversified industrial technology powerhouse. It generates revenue through software and engineered products spanning healthcare, energy, and measurement solutions. In 2026, Roper focuses strategically on expanding cloud-based analytics and automated operational tools, reinforcing its competitive edge in industrial machinery software and hardware integration.
EPAM Systems, Inc.: Global Digital Engineering Innovator
EPAM Systems commands a global presence in digital platform engineering and software development services. Its core revenue derives from engineering, infrastructure management, and smart automation solutions tailored for various sectors like finance and healthcare. The company’s 2026 strategy emphasizes enhancing software quality assurance and integrating AI-driven consulting to accelerate digital transformation for clients.
Strategic Collision: Similarities & Divergences
Roper pursues a broad industrial software-hardware integration, while EPAM champions digital engineering and platform services. Both compete in software-driven operational efficiency but target different client ecosystems. Roper’s strength lies in specialized industrial products; EPAM’s investment profile hinges on scalable digital innovation and consulting services, presenting distinct risk-return dynamics for investors.
Income Statement Comparison
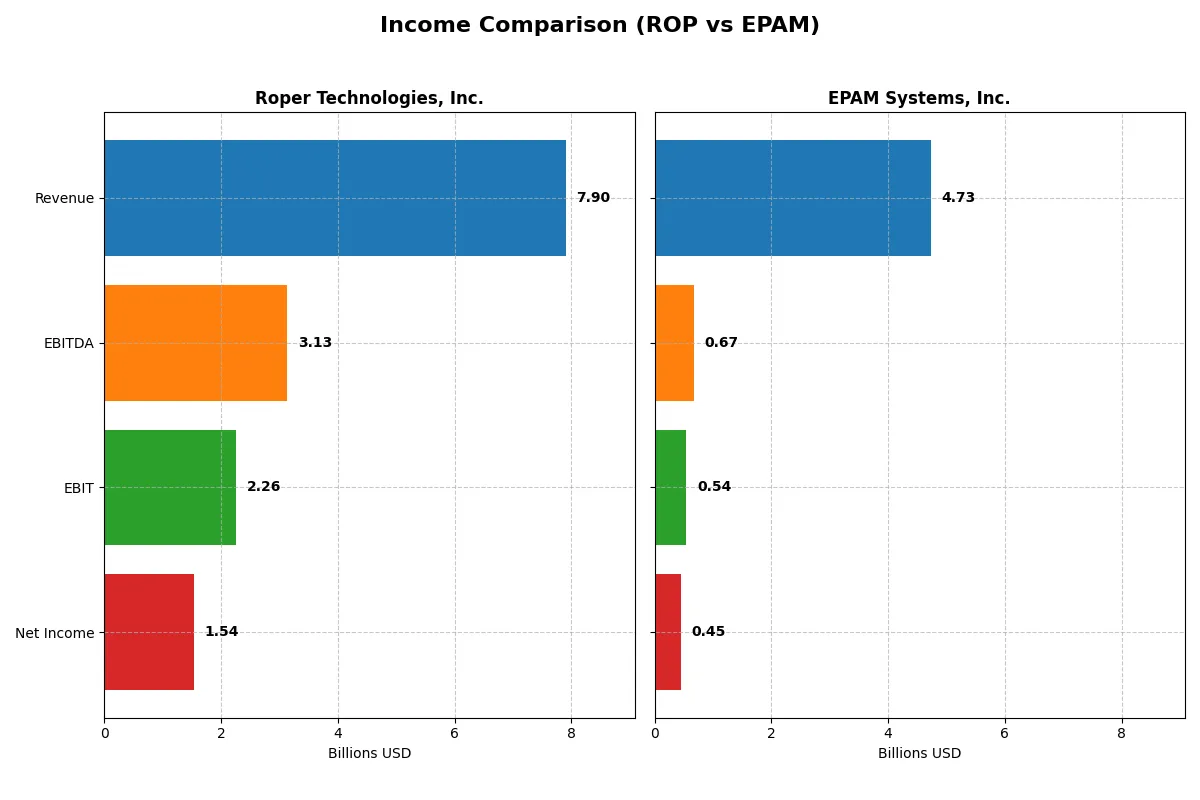
This data dissects the core profitability and scalability of both corporate engines to reveal who dominates the bottom line:
| Metric | Roper Technologies, Inc. (ROP) | EPAM Systems, Inc. (EPAM) |
|---|---|---|
| Revenue | 7.90B | 4.73B |
| Cost of Revenue | 2.43B | 3.28B |
| Operating Expenses | 3.24B | 906M |
| Gross Profit | 5.47B | 1.45B |
| EBITDA | 3.13B | 672M |
| EBIT | 2.26B | 545M |
| Interest Expense | 325M | 0 |
| Net Income | 1.54B | 455M |
| EPS | 14.31 | 7.93 |
| Fiscal Year | 2025 | 2024 |
Income Statement Analysis: The Bottom-Line Duel
The following income statement comparison reveals the true efficiency and profitability of each company’s business model over recent years.
Roper Technologies, Inc. Analysis
Roper’s revenue climbed steadily from $4.8B in 2021 to $7.9B in 2025, a 63% growth, while net income rose 40% to $1.54B. Gross margins remain robust near 69%, and net margins hold at a healthy 19%. Despite a slight dip in net margin growth last year, Roper demonstrates solid operational efficiency and consistent momentum.
EPAM Systems, Inc. Analysis
EPAM’s revenue grew 78% from $2.7B in 2020 to $4.7B in 2024, but last year’s growth slowed to under 1%. Net income increased 39% to $455M, with net margins improving to 9.6%. EPAM maintains favorable gross and EBIT margins, reflecting operational discipline, though its margin expansion lags behind revenue growth in the latest period.
Margin Strength vs. Revenue Growth Dynamism
Roper dominates with higher margins and stronger net profitability despite slightly slower recent top-line growth. EPAM shows impressive revenue expansion but at thinner margins and stalled recent sales momentum. Investors seeking durable profitability may favor Roper’s margin profile, while those valuing growth might watch EPAM’s evolving scale.
Financial Ratios Comparison
These vital ratios act as a diagnostic tool to expose the underlying fiscal health, valuation premiums, and capital efficiency of the companies compared below:
| Ratios | Roper Technologies, Inc. (ROP) | EPAM Systems, Inc. (EPAM) |
|---|---|---|
| ROE | 8.2% | 12.5% |
| ROIC | 5.5% | 10.7% |
| P/E | 35.9 | 29.5 |
| P/B | 2.95 | 3.69 |
| Current Ratio | 0.40 | 2.96 |
| Quick Ratio | 0.37 | 2.96 |
| D/E | 0.41 | 0.04 |
| Debt-to-Assets | 24.5% | 3.4% |
| Interest Coverage | 7.7 | 0 |
| Asset Turnover | 0.22 | 1.00 |
| Fixed Asset Turnover | 47.0 | 14.1 |
| Payout ratio | 20.8% | 0 |
| Dividend yield | 0.58% | 0% |
| Fiscal Year | 2024 | 2024 |
Efficiency & Valuation Duel: The Vital Signs
Ratios act as a company’s DNA, revealing hidden risks and operational excellence crucial for assessing investment quality.
Roper Technologies, Inc.
ROP shows a solid net margin of 19.44%, indicating strong profitability, but zero reported ROE and ROIC raise concerns. The stock trades at a stretched P/E of 31.06, suggesting expensive valuation. ROP offers a modest 0.74% dividend yield, signaling limited shareholder returns amid reinvestment in intangible assets and R&D.
EPAM Systems, Inc.
EPAM delivers a moderate net margin of 9.61% with a neutral ROE of 12.52%. Its P/E of 29.47 also signals a high valuation, though slightly lower than ROP’s. EPAM maintains a healthy current ratio near 3 and no dividend, instead focusing on growth via strong operational efficiency and reinvestment in innovation.
Premium Valuation vs. Operational Safety
ROP’s higher profitability contrasts with its lackluster return metrics and stretched valuation, while EPAM balances moderate returns with stronger liquidity and operational efficiency. EPAM offers a more favorable risk-reward profile for investors seeking growth and financial stability. ROP suits those prioritizing yield and margin strength despite valuation risks.
Which one offers the Superior Shareholder Reward?
I compare Roper Technologies, Inc. (ROP) and EPAM Systems, Inc. (EPAM) on shareholder distributions. ROP pays a consistent dividend with yields around 0.7% and payout ratios near 21-23%, well-covered by free cash flow (FCF) with dividend and capex coverage ratios above 5. They also have moderate buyback activity, enhancing total returns. EPAM, in contrast, pays no dividends but reinvests heavily in growth and acquisitions, maintaining robust free cash flow conversion (above 80%) and very low debt. Their share buybacks are less transparent but likely limited. ROP’s distribution, combining dividends and buybacks, offers a more sustainable and tangible shareholder reward in 2026. I conclude ROP delivers the superior total return profile for income-focused investors, while EPAM suits growth-focused portfolios willing to forgo immediate income.
Comparative Score Analysis: The Strategic Profile
The radar chart reveals the fundamental DNA and trade-offs of both firms, highlighting their financial strengths and valuation nuances:
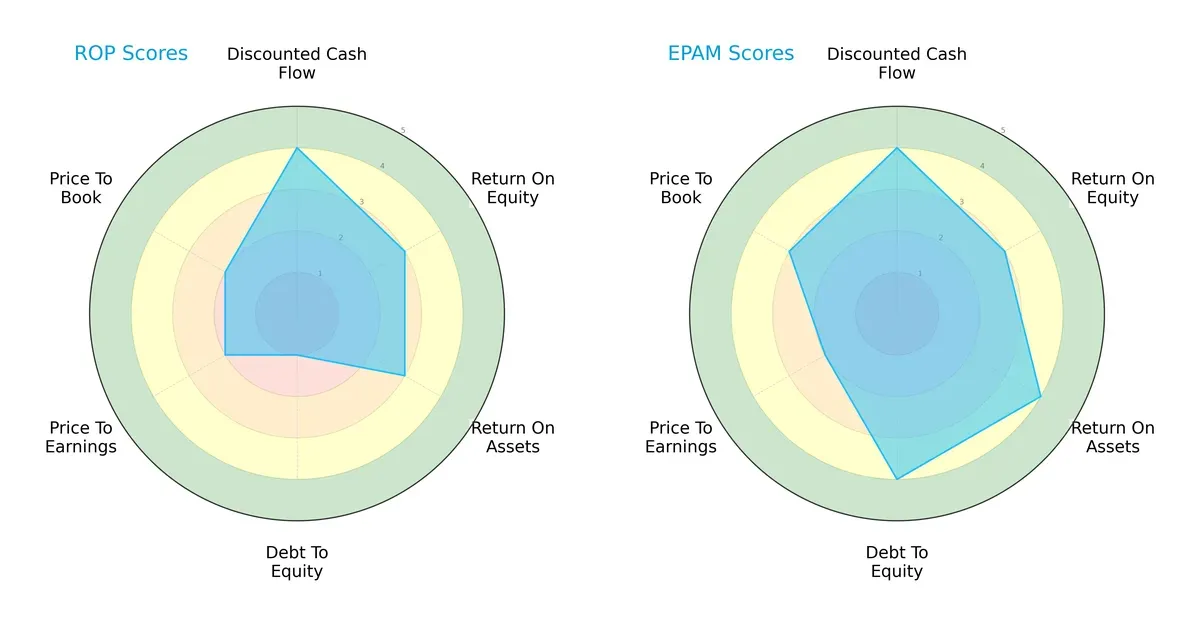
EPAM Systems, Inc. displays a more balanced profile with favorable scores in ROA (4) and debt-to-equity (4), signaling efficient asset use and financial stability. Roper Technologies, Inc. leans on a strong discounted cash flow score (4) but suffers from a very unfavorable debt-to-equity score (1), indicating higher leverage risk. EPAM’s modest valuation scores (P/E 2, P/B 3) complement its operational strengths, making it more resilient across metrics.
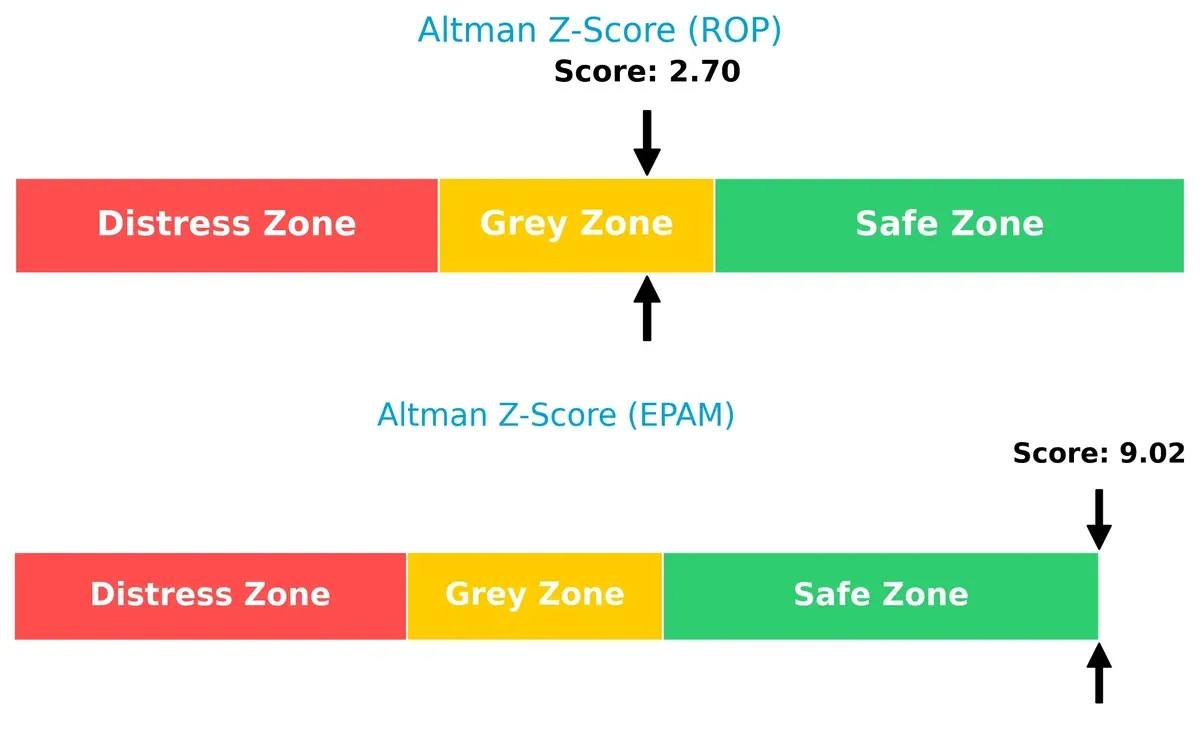
Bankruptcy Risk: Solvency Showdown
EPAM’s Altman Z-Score of 9.0 places it firmly in the safe zone, while Roper’s 2.7 situates it in the grey zone, suggesting moderate bankruptcy risk under current market conditions:
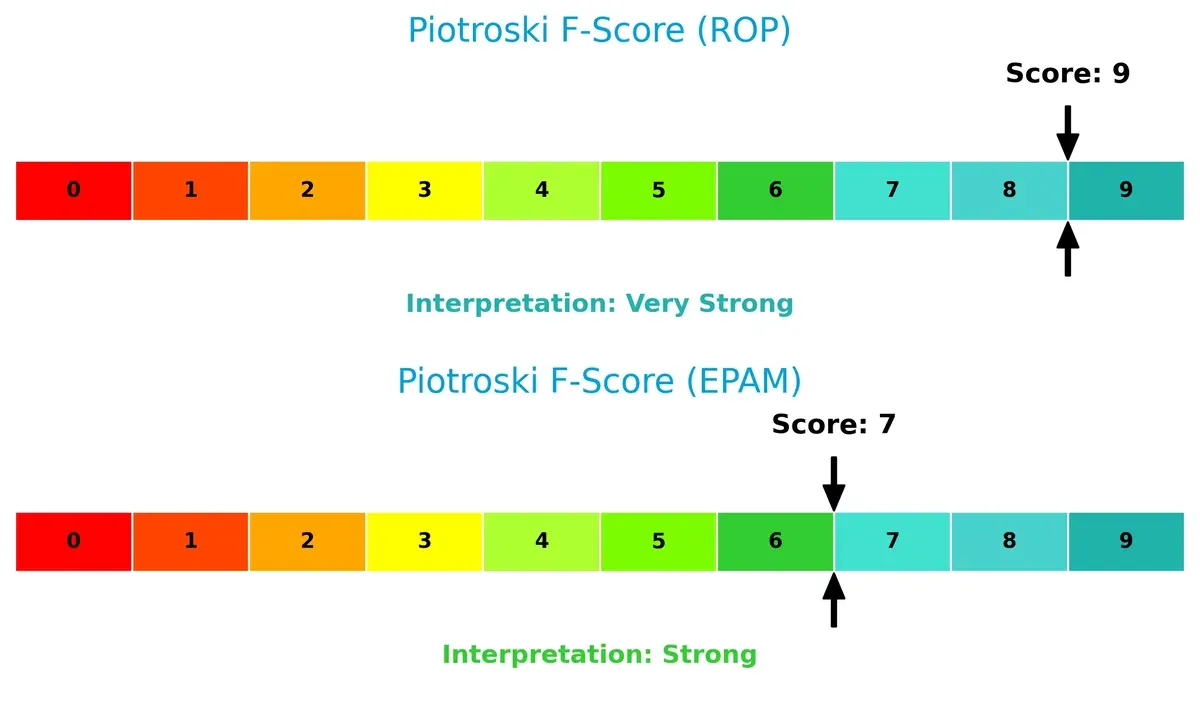
Financial Health: Quality of Operations
Roper’s Piotroski F-Score of 9 signals peak financial health, outperforming EPAM’s strong but lower score of 7, which may hint at some internal operational red flags:
How are the two companies positioned?
This section dissects the operational DNA of ROP and EPAM by comparing their revenue distribution and internal dynamics. The goal is to confront their economic moats and identify which business model offers the most resilient, sustainable competitive advantage today.
Revenue Segmentation: The Strategic Mix
This visual comparison dissects how Roper Technologies, Inc. and EPAM Systems, Inc. diversify their income streams and reveals their primary sector bets:
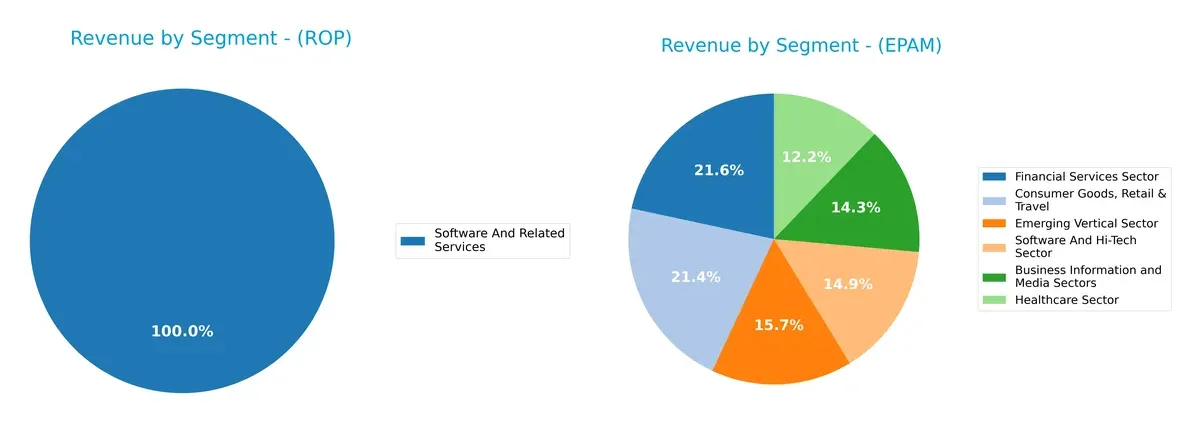
Roper anchors its revenue heavily in Application Software with $3.19B in 2023, supported by Network Software ($1.44B) and Technology Enabled Products ($1.55B). This mix suggests a tech-driven ecosystem with moderate diversification. EPAM, by contrast, spreads revenue more evenly across six sectors in 2024, including Consumer Goods ($1.01B) and Financial Services ($1.02B), signaling a diversified model that mitigates concentration risk but demands broad execution excellence.
Strengths and Weaknesses Comparison
This table compares the Strengths and Weaknesses of Roper Technologies, Inc. and EPAM Systems, Inc.:
Roper Technologies Strengths
- High net margin at 19.44%
- Favorable debt-to-equity and interest coverage ratios
- Diverse software and technology product segments
- Significant US revenue base supporting scale
EPAM Systems Strengths
- Favorable liquidity with current and quick ratios near 3.0
- Low debt levels with strong interest coverage
- Diversified sector exposure including healthcare and financial services
- Robust fixed asset turnover indicating asset efficiency
Roper Technologies Weaknesses
- Unfavorable ROE and ROIC indicating weak capital efficiency
- Unavailable WACC complicates cost of capital analysis
- Low current and quick ratios raise liquidity concerns
- High P/E ratio suggesting premium valuation
- Limited international revenue exposure
EPAM Systems Weaknesses
- ROIC and WACC both unfavorable, indicating potential value destruction
- P/E and P/B ratios relatively high, pressuring valuation
- Zero dividend yield may deter income-focused investors
- Net margin and ROE only neutral despite diversification
Both companies demonstrate strengths in diversification and financial health but differ in capital efficiency and geographic exposure. Roper’s strong profitability contrasts with its liquidity weaknesses, while EPAM’s liquidity and asset use excel despite more modest profitability metrics. This divergence will influence how each manages growth and risk in evolving market conditions.
The Moat Duel: Analyzing Competitive Defensibility
A structural moat is the only defense long-term profits have against relentless competition erosion. Here’s how Roper Technologies and EPAM Systems stack up:
Roper Technologies, Inc.: Diversified Industrial Moat with Intangible Assets
Roper’s moat stems from its portfolio of specialized software and engineered products. High gross (69%) and EBIT margins (29%) reflect strong pricing power and margin stability. Expansion into cloud analytics and healthcare software in 2026 could deepen its intangible asset moat.
EPAM Systems, Inc.: Digital Engineering Services with Client Stickiness
EPAM relies on client relationships and service customization as its moat, contrasting with Roper’s product focus. Despite a lower gross margin (31%), EPAM grows net margin and EPS steadily. Its digital transformation services position it well to capture new market disruptions in 2026.
Industrial Conglomerate Moat vs. Digital Service Stickiness
Roper’s broader product portfolio and margin strength suggest a wider moat than EPAM’s service-dependent model. However, EPAM’s adaptability to tech trends offers niche resilience. Roper stands better equipped to defend market share amid competitive pressure.
Which stock offers better returns?
Stock price movements over the past 12 months reveal contrasting dynamics between Roper Technologies, Inc. and EPAM Systems, Inc., with varying degrees of decline and recent momentum shifts.
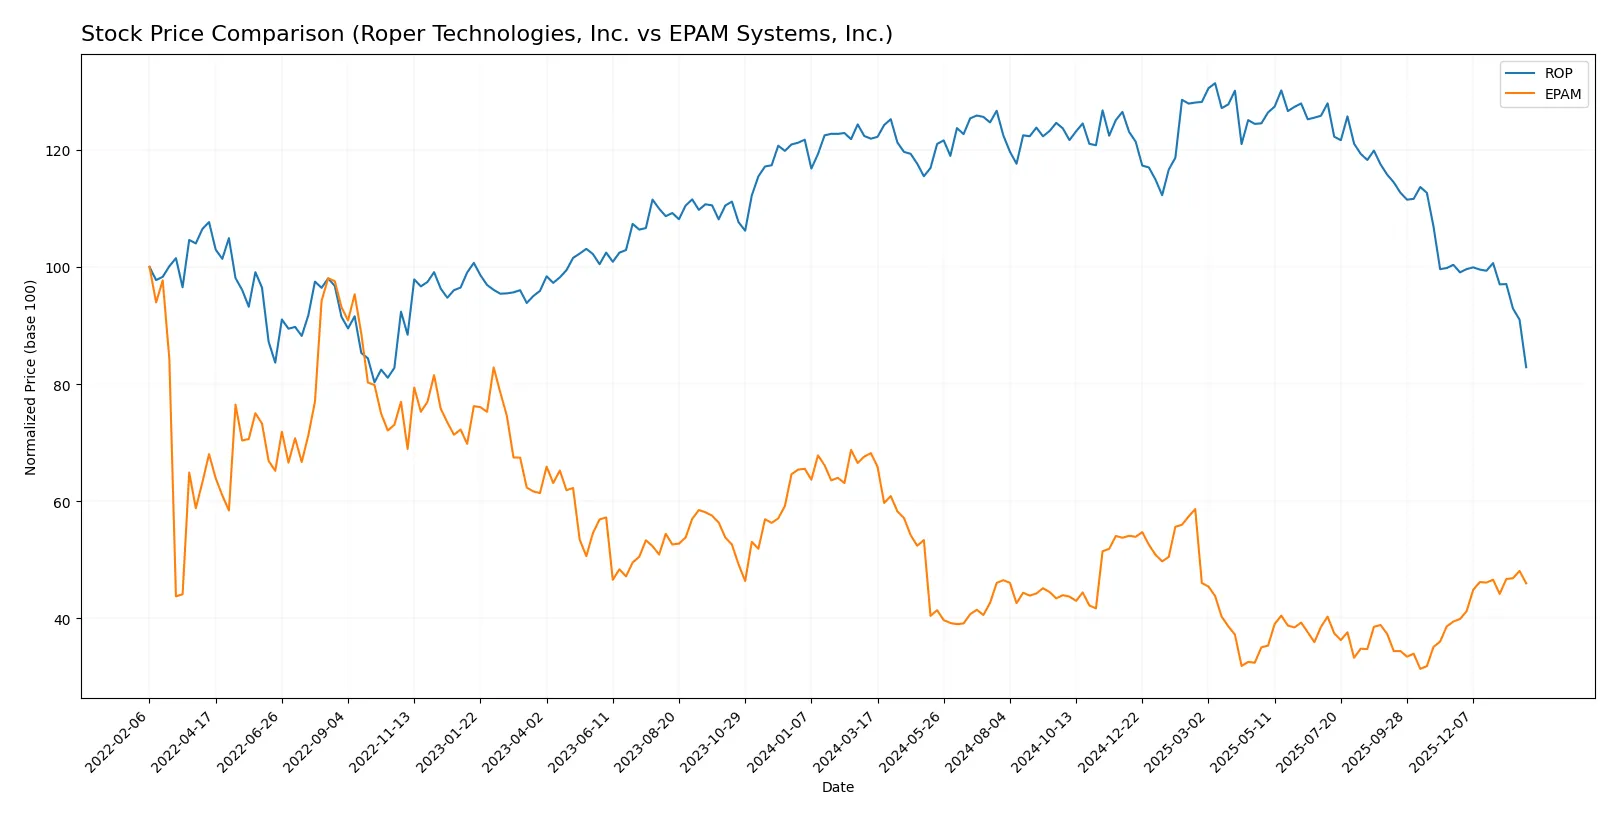
Trend Comparison
Roper Technologies, Inc. shows a 32.0% price decline over the past year, marking a bearish trend with decelerating losses and high volatility. The stock peaked at 588.38 and troughed at 371.23.
EPAM Systems, Inc. also exhibits a bearish trend with a 32.58% drop over the year but shows accelerating losses. The stock’s price ranged from 309.4 at its high to 142.38 at its low, with recent upward momentum.
While both stocks declined similarly overall, EPAM’s recent 16.52% gain outpaces Roper’s 17.41% drop, indicating stronger short-term performance for EPAM.
Target Prices
Analysts show a positive outlook with solid upside potential across both companies.
| Company | Target Low | Target High | Consensus |
|---|---|---|---|
| Roper Technologies, Inc. | 365 | 575 | 475.5 |
| EPAM Systems, Inc. | 175 | 247 | 214 |
Roper’s consensus target sits about 28% above its current price of 371, signaling strong growth expectations. EPAM’s target consensus exceeds its 209 share price by roughly 2.5%, indicating moderate upside amid tech sector volatility.

Don’t Let Luck Decide Your Entry Point
Optimize your entry points with our advanced ProRealTime indicators. You’ll get efficient buy signals with precise price targets for maximum performance. Start outperforming now!
How do institutions grade them?
Roper Technologies, Inc. Grades
The following table displays recent grade updates from major institutions for Roper Technologies:
| Grading Company | Action | New Grade | Date |
|---|---|---|---|
| Goldman Sachs | Maintain | Neutral | 2026-01-29 |
| Argus Research | Downgrade | Hold | 2026-01-28 |
| Truist Securities | Maintain | Buy | 2026-01-28 |
| Mizuho | Maintain | Underperform | 2026-01-28 |
| Oppenheimer | Downgrade | Perform | 2026-01-28 |
| RBC Capital | Maintain | Sector Perform | 2026-01-28 |
| Barclays | Maintain | Underweight | 2026-01-28 |
| Stifel | Downgrade | Hold | 2026-01-28 |
| Citigroup | Maintain | Buy | 2026-01-28 |
| JP Morgan | Maintain | Underweight | 2026-01-28 |
EPAM Systems, Inc. Grades
Below are the most recent institutional grades for EPAM Systems:
| Grading Company | Action | New Grade | Date |
|---|---|---|---|
| Citigroup | Maintain | Neutral | 2026-01-29 |
| Wells Fargo | Maintain | Overweight | 2026-01-14 |
| TD Cowen | Maintain | Buy | 2026-01-09 |
| Mizuho | Maintain | Outperform | 2025-11-11 |
| JP Morgan | Maintain | Overweight | 2025-11-07 |
| Morgan Stanley | Maintain | Equal Weight | 2025-09-09 |
| JP Morgan | Maintain | Overweight | 2025-08-20 |
| Barclays | Maintain | Overweight | 2025-05-12 |
| Needham | Maintain | Buy | 2025-05-09 |
| Piper Sandler | Maintain | Neutral | 2025-05-09 |
Which company has the best grades?
EPAM Systems consistently receives higher ratings, including multiple “Buy” and “Overweight” grades, compared to Roper Technologies’ mixed “Hold,” “Underperform,” and “Underweight” marks. This divergence signals stronger institutional confidence in EPAM, potentially influencing investor sentiment and capital flow.
Risks specific to each company
In the challenging 2026 market environment, these risk categories reveal critical pressure points and systemic threats facing Roper Technologies, Inc. and EPAM Systems, Inc.:
1. Market & Competition
Roper Technologies, Inc.
- Operates in diversified industrial machinery, facing cyclical demand and technological disruption risks.
EPAM Systems, Inc.
- Competes in fast-evolving IT services, exposed to rapid innovation and client concentration risks.
2. Capital Structure & Debt
Roper Technologies, Inc.
- Shows favorable debt ratios but moderate interest coverage signals cautious debt management.
EPAM Systems, Inc.
- Maintains very low debt with excellent interest coverage, supporting financial stability.
3. Stock Volatility
Roper Technologies, Inc.
- Beta near 0.94 indicates lower volatility than the market, offering relative stock stability.
EPAM Systems, Inc.
- High beta at 1.73 reflects elevated stock volatility, increasing investment risk.
4. Regulatory & Legal
Roper Technologies, Inc.
- Subject to industrial and environmental regulations impacting operations and compliance costs.
EPAM Systems, Inc.
- Faces IT data privacy and cybersecurity regulations that could affect service delivery and liabilities.
5. Supply Chain & Operations
Roper Technologies, Inc.
- Complex global supply chain risks include raw material costs and logistical disruptions.
EPAM Systems, Inc.
- Relies on skilled workforce and stable IT infrastructure; talent shortages and tech failures pose risks.
6. ESG & Climate Transition
Roper Technologies, Inc.
- Industrial sector pressure to reduce emissions and improve sustainability could raise costs.
EPAM Systems, Inc.
- Technology sector faces growing ESG demands but benefits from lower direct emissions footprint.
7. Geopolitical Exposure
Roper Technologies, Inc.
- Operations primarily US-based but global sales expose it to trade tensions and tariffs.
EPAM Systems, Inc.
- Global IT services face risks from geopolitical tensions affecting offshore delivery and data sovereignty.
Which company shows a better risk-adjusted profile?
Roper’s main risk is cyclical industrial demand and weaker profitability metrics. EPAM’s greatest pressure lies in its elevated stock volatility and regulatory complexities. EPAM’s stronger balance sheet, higher Altman Z-score (safe zone), and robust Piotroski score give it a better risk-adjusted profile. However, EPAM’s beta of 1.73 signals higher market sensitivity, requiring careful volatility management. Meanwhile, Roper’s moderate Altman score (grey zone) and dividend yield concerns highlight financial caution. Overall, EPAM balances risk with financial strength better than Roper in today’s market.
Final Verdict: Which stock to choose?
Roper Technologies, Inc. (ROP) excels as a cash-generating industrial powerhouse with a solid income quality and favorable net margins. Its main point of vigilance is a stretched liquidity position, reflected in a low current ratio, which could pressure short-term flexibility. ROP suits investors with an appetite for industrial cyclicality and aggressive growth potential.
EPAM Systems, Inc. (EPAM) benefits from a strategic moat rooted in its software engineering expertise and recurring revenue model. Its strong balance sheet and robust liquidity offer better safety compared to ROP. EPAM fits well within Growth at a Reasonable Price (GARP) portfolios seeking steady expansion with moderate risk.
If you prioritize industrial cash flow strength and can tolerate liquidity constraints, ROP is the compelling choice due to its superior margin profile and income quality. However, if you seek better financial stability and a strategic moat in digital services, EPAM offers better risk-adjusted growth and a healthier balance sheet. Both present distinct but viable analytical scenarios depending on your portfolio’s risk tolerance.
Disclaimer: Investment carries a risk of loss of initial capital. The past performance is not a reliable indicator of future results. Be sure to understand risks before making an investment decision.
Go Further
I encourage you to read the complete analyses of Roper Technologies, Inc. and EPAM Systems, Inc. to enhance your investment decisions: