Home > Comparison > Industrials > ROP vs ASAN
The strategic rivalry between Roper Technologies, Inc. and Asana, Inc. shapes key dynamics within Industrials and Technology sectors. Roper operates as a diversified industrial machinery and software powerhouse, while Asana focuses on high-growth application software for work management. This head-to-head highlights a contest between established capital-intensive industrial leadership and agile tech innovation. This analysis aims to identify which corporate model delivers superior risk-adjusted returns for a diversified portfolio.
Table of contents
Companies Overview
Roper Technologies and Asana stand as influential players in their distinct sectors, shaping industrial machinery and software landscapes.
Roper Technologies, Inc.: Diversified Industrial Innovator
Roper Technologies dominates the industrial machinery sector with a diversified portfolio spanning software and engineered products. Its core revenue stems from cloud-based analytics, management software, and precision instruments. In 2026, Roper focuses strategically on expanding its software-driven solutions across healthcare, utilities, and financial services to boost recurring revenue streams.
Asana, Inc.: Collaborative Work Management Platform
Asana leads in the software application space, offering a work management platform that orchestrates tasks and projects across industries. It generates revenue primarily through subscription fees for its cloud-based collaboration tools. In 2026, Asana emphasizes enhancing platform integration and scalability to capture enterprise clients and expand its global footprint.
Strategic Collision: Similarities & Divergences
Roper’s broad industrial software and hardware approach contrasts with Asana’s focused SaaS collaboration model. Their competition centers on enterprise customers seeking operational efficiency—Roper via integrated industrial solutions, Asana through agile work management. This divergence shapes their investment profiles: Roper offers industrial resilience and diversification, while Asana presents growth potential amid evolving digital workflows.
Income Statement Comparison
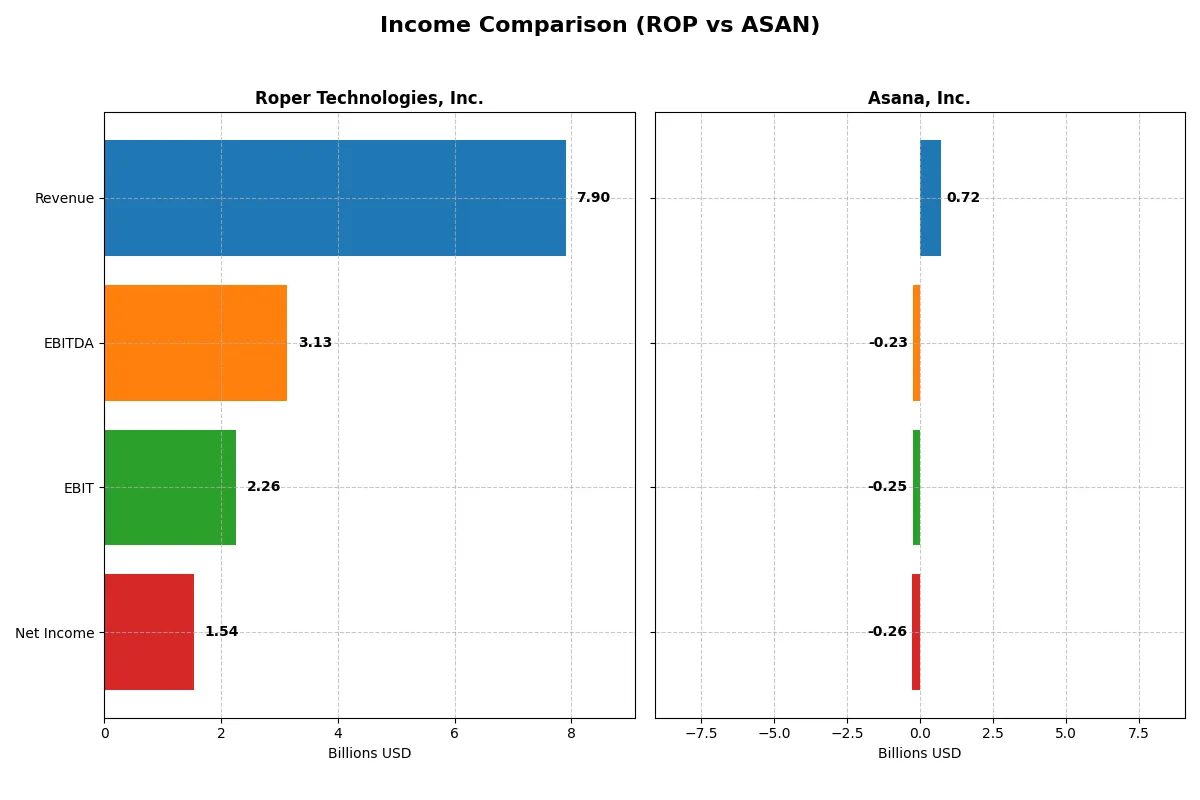
The following data dissects the core profitability and scalability of both corporate engines to reveal who dominates the bottom line:
| Metric | Roper Technologies, Inc. (ROP) | Asana, Inc. (ASAN) |
|---|---|---|
| Revenue | 7.90B | 724M |
| Cost of Revenue | 2.43B | 77M |
| Operating Expenses | 3.24B | 913M |
| Gross Profit | 5.47B | 647M |
| EBITDA | 3.13B | -230M |
| EBIT | 2.26B | -247M |
| Interest Expense | 325M | 4M |
| Net Income | 1.54B | -256M |
| EPS | 14.31 | -1.11 |
| Fiscal Year | 2025 | 2025 |
Income Statement Analysis: The Bottom-Line Duel
This income statement comparison reveals which company runs a more efficient and profitable corporate engine through their recent financial performance.
Roper Technologies, Inc. Analysis
Roper Technologies drives steady revenue growth, reaching $7.9B in 2025, up 12% from 2024. Net income rose slightly to $1.54B, though net margin contracted to 19.4%. The company maintains robust gross margins near 69%, showcasing solid cost control despite a slight dip in net margin and EPS growth signaling emerging margin pressure.
Asana, Inc. Analysis
Asana posts rapid revenue growth, climbing nearly 11% to $724M in 2025. However, it still reports a net loss of $256M, though improving net margin by over 10% year-over-year. The gross margin remains high at 89%, indicating strong product pricing and cost efficiency, but persistent losses reflect ongoing investments and operating expenses outpacing revenue.
Margin Strength vs. Growth Trajectory
Roper delivers consistent profitability with a strong gross and net margin profile, reflecting efficient capital allocation and industry-leading cost management. Asana impresses with explosive revenue growth and improving margins but remains unprofitable. For investors prioritizing stable earnings and margin resilience, Roper stands out. Growth-focused investors may find Asana’s momentum compelling despite its current losses.
Financial Ratios Comparison
These vital ratios act as a diagnostic tool to expose the underlying fiscal health, valuation premiums, and capital efficiency of the companies compared below:
| Ratios | Roper Technologies, Inc. (ROP) | Asana, Inc. (ASAN) |
|---|---|---|
| ROE | 8.2% | -112.3% |
| ROIC | 5.5% | -53.0% |
| P/E | 35.9 | -19.2 |
| P/B | 2.95 | 21.52 |
| Current Ratio | 0.40 | 1.44 |
| Quick Ratio | 0.37 | 1.44 |
| D/E (Debt-to-Equity) | 0.41 | 1.18 |
| Debt-to-Assets | 24.5% | 30.1% |
| Interest Coverage | 7.7 | -72.4 |
| Asset Turnover | 0.22 | 0.81 |
| Fixed Asset Turnover | 47.0 | 2.76 |
| Payout ratio | 20.8% | 0 |
| Dividend yield | 0.58% | 0 |
| Fiscal Year | 2024 | 2025 |
Efficiency & Valuation Duel: The Vital Signs
Financial ratios act as a company’s DNA, uncovering hidden risks and operational strengths that shape investment potential.
Roper Technologies, Inc.
Roper shows solid profitability with a favorable 19.44% net margin but a weak ROE of 0%. The P/E ratio at 31.06 signals a stretched valuation compared to sector norms. Dividend yield is low at 0.74%, reflecting modest shareholder returns amid reinvestment in R&D and growth initiatives.
Asana, Inc.
Asana suffers from steep losses, with a -35.3% net margin and a deeply negative ROE of -112%. Despite a negative P/E, this reflects valuation challenges rather than cheapness. Asana pays no dividends, focusing capital on aggressive R&D and scaling, which heightens risk but targets long-term growth.
Operational Strength vs. Growth Risk
Roper balances profitability and a stretched valuation, offering moderate returns with operational stability. Asana presents high growth potential but severe profitability and valuation concerns. Investors seeking steady income may prefer Roper, while those embracing growth volatility might consider Asana.
Which one offers the Superior Shareholder Reward?
I compare Roper Technologies, Inc. (ROP) and Asana, Inc. (ASAN) on dividend yield, payout ratio, and buyback activity. ROP pays a modest 0.74% dividend yield with a sustainable 23% payout ratio, backed by strong free cash flow (FCF) coverage near 100%. Its buybacks complement income returns, enhancing total shareholder reward. ASAN pays no dividends, focusing on reinvestment for growth, with negative margins and volatile cash flow. Its buyback activity is negligible, reflecting early-stage expansion risk. I find ROP’s disciplined distribution and buyback strategy offers a superior, more sustainable total return profile in 2026.
Comparative Score Analysis: The Strategic Profile
The radar chart reveals the fundamental DNA and trade-offs of Roper Technologies, Inc. and Asana, Inc., highlighting their financial strengths and vulnerabilities:
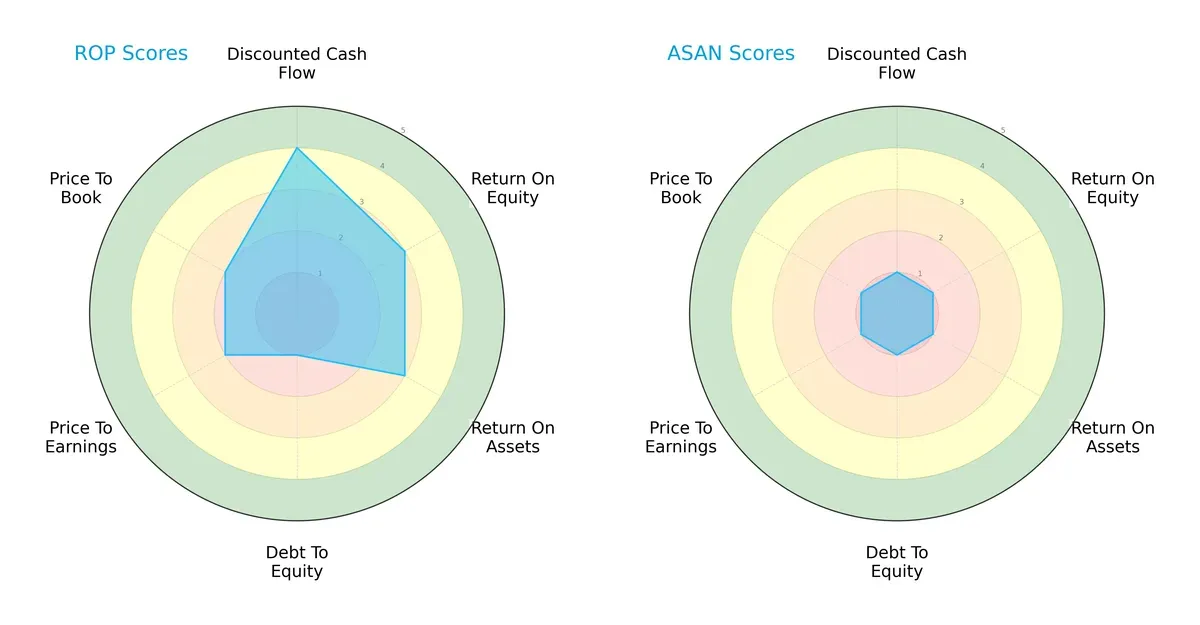
Roper demonstrates a more balanced profile with moderate scores in ROE (3), ROA (3), and valuation metrics (PE/PB at 2), supported by a favorable DCF score (4). However, its debt-to-equity score (1) is a red flag, indicating higher leverage risk. Asana trails significantly across all metrics, scoring uniformly low (1), reflecting operational and valuation challenges without a clear competitive edge.
—
Bankruptcy Risk: Solvency Showdown
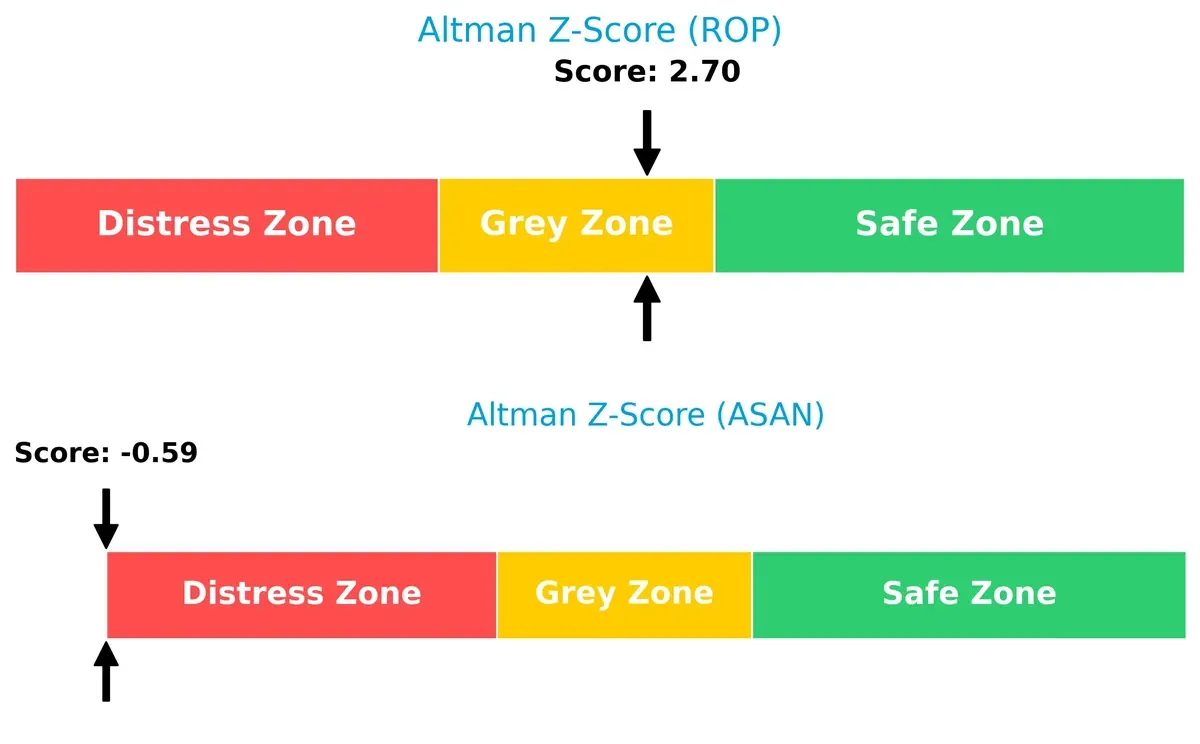
Roper’s Altman Z-Score of 2.7 places it in the grey zone, suggesting moderate bankruptcy risk. In contrast, Asana’s -0.6 score lands it firmly in the distress zone, signaling severe solvency concerns:
—
Financial Health: Quality of Operations
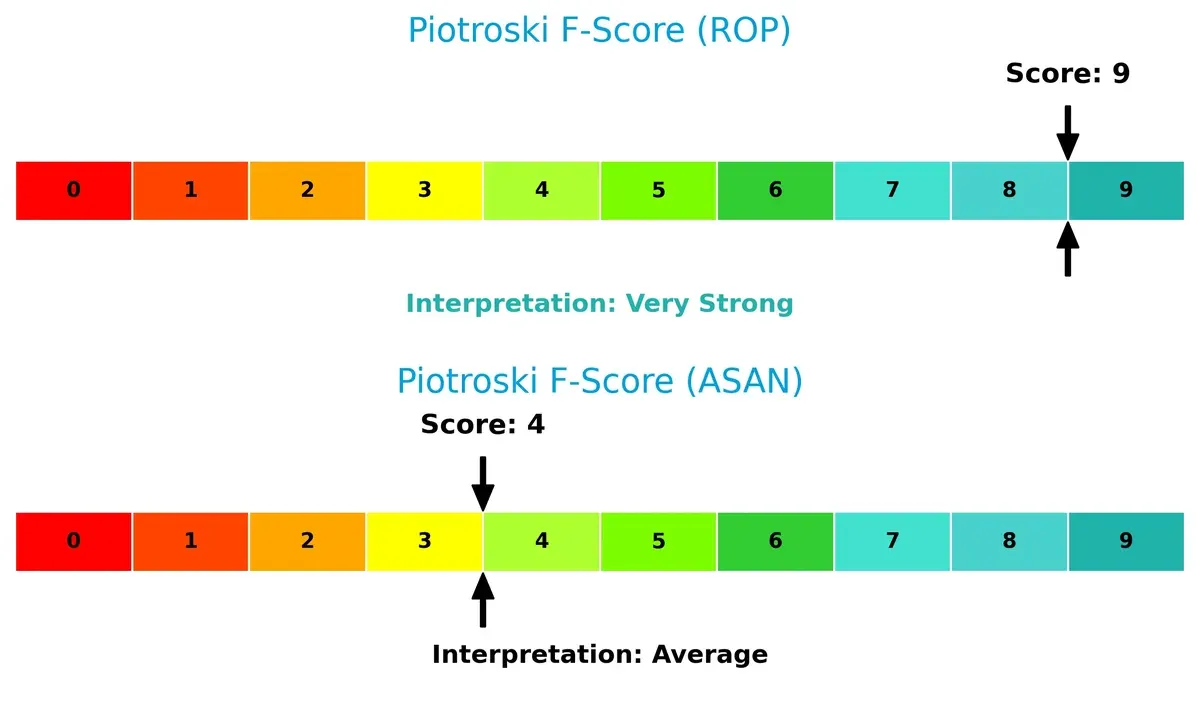
Roper’s Piotroski F-Score of 9 indicates peak financial health and operational strength. Meanwhile, Asana’s score of 4 flags internal weaknesses and potential red flags in profitability and efficiency:
How are the two companies positioned?
This section dissects Roper’s and Asana’s operational DNA by comparing their revenue distribution and internal strengths and weaknesses. The goal is to confront their economic moats to reveal which model offers the most resilient competitive advantage today.
Revenue Segmentation: The Strategic Mix
This visual comparison dissects how Roper Technologies, Inc. and Asana, Inc. diversify their income streams and reveals where their primary sector bets lie:
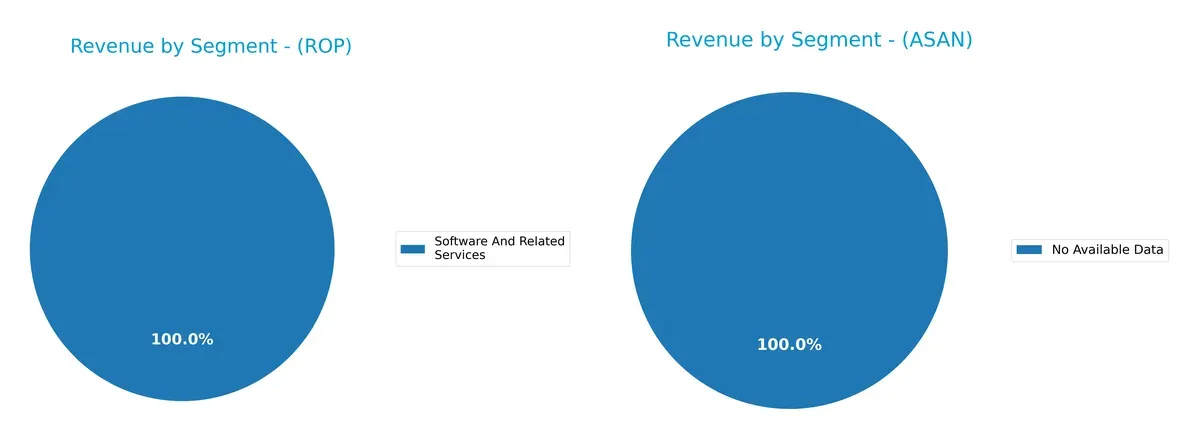
Roper Technologies leans heavily on its Software and Related Services segment, with $10.7B in 2024 revenue, dwarfing other segments. Its earlier years show a more balanced mix across Application Software, Network Software, and Technology Enabled Products. Asana lacks available segmentation data, preventing direct comparison. Roper’s concentration in software services signals strong ecosystem lock-in but raises concentration risk without segment diversification.
Strengths and Weaknesses Comparison
This table compares the key Strengths and Weaknesses of Roper Technologies and Asana, Inc.:
Roper Technologies Strengths
- Diversified revenue across software, technology products, and industrial segments
- Strong net margin at 19.44%
- Favorable debt to equity and interest coverage ratios
- Significant US and global presence with over 6B USD US revenue
- Established market share in multiple tech sectors
Asana Strengths
- Favorable weighted average cost of capital (7.67%)
- Positive quick ratio (1.44) indicating liquidity
- Growing international and US revenue base, reaching 724M USD combined
- Neutral asset turnover and fixed asset turnover ratios suggest operational efficiency potential
Roper Technologies Weaknesses
- Unfavorable return on equity and invested capital at 0%
- Unavailable WACC data limits full capital efficiency assessment
- Low current and quick ratios raise liquidity concerns
- High price-to-earnings ratio (31.06) may indicate valuation risk
- Unfavorable asset turnover metrics
- Low dividend yield at 0.74%
Asana Weaknesses
- Negative net margin (-35.3%) and returns on equity (-112.31%) and capital (-53.03%)
- Unfavorable debt to equity and high debt to assets (30.11%) ratios
- Negative interest coverage at -67.09 indicates risk in servicing debt
- Unfavorable price-to-book ratio (21.52) suggests overvaluation
- Zero dividend yield reflects no income distribution
Roper’s strengths lie in diversified product lines and solid profitability, despite some liquidity and valuation concerns. Asana faces challenges in profitability and debt management but shows promising operational liquidity and growth in revenues. Both companies display distinct profiles shaping their strategic focus.
The Moat Duel: Analyzing Competitive Defensibility
A structural moat is the only reliable barrier protecting long-term profits from relentless competitive erosion in dynamic markets:
Roper Technologies, Inc.: Diversified Industrial Conglomerate with Intangible Asset Moat
Roper’s moat stems from its broad portfolio of specialized software and engineered products. Its high gross margin (69%) and stable EBIT margin (29%) reflect durable pricing power. Expansion into cloud-based analytics deepens defensibility in 2026.
Asana, Inc.: Emerging SaaS Platform with Network Effects
Asana’s moat relies on network effects within its collaborative work management platform. Despite rapid revenue growth (11% last year), negative EBIT margin (-34%) and declining ROIC signal fragile profitability. Market expansion and product innovation are vital for its moat’s survival.
Industrial Diversification vs. Software Network Effects: Which Moat Holds Stronger?
Roper’s moat is wider and financially more resilient, backed by strong margins and diverse revenue streams. Asana’s network effect moat shows promise but suffers from value destruction. Roper is better positioned to defend market share amid economic cycles.
Which stock offers better returns?
Over the past 12 months, both Roper Technologies, Inc. and Asana, Inc. experienced notable price declines with decelerating bearish trends. Their trading volumes showed seller dominance in recent months.
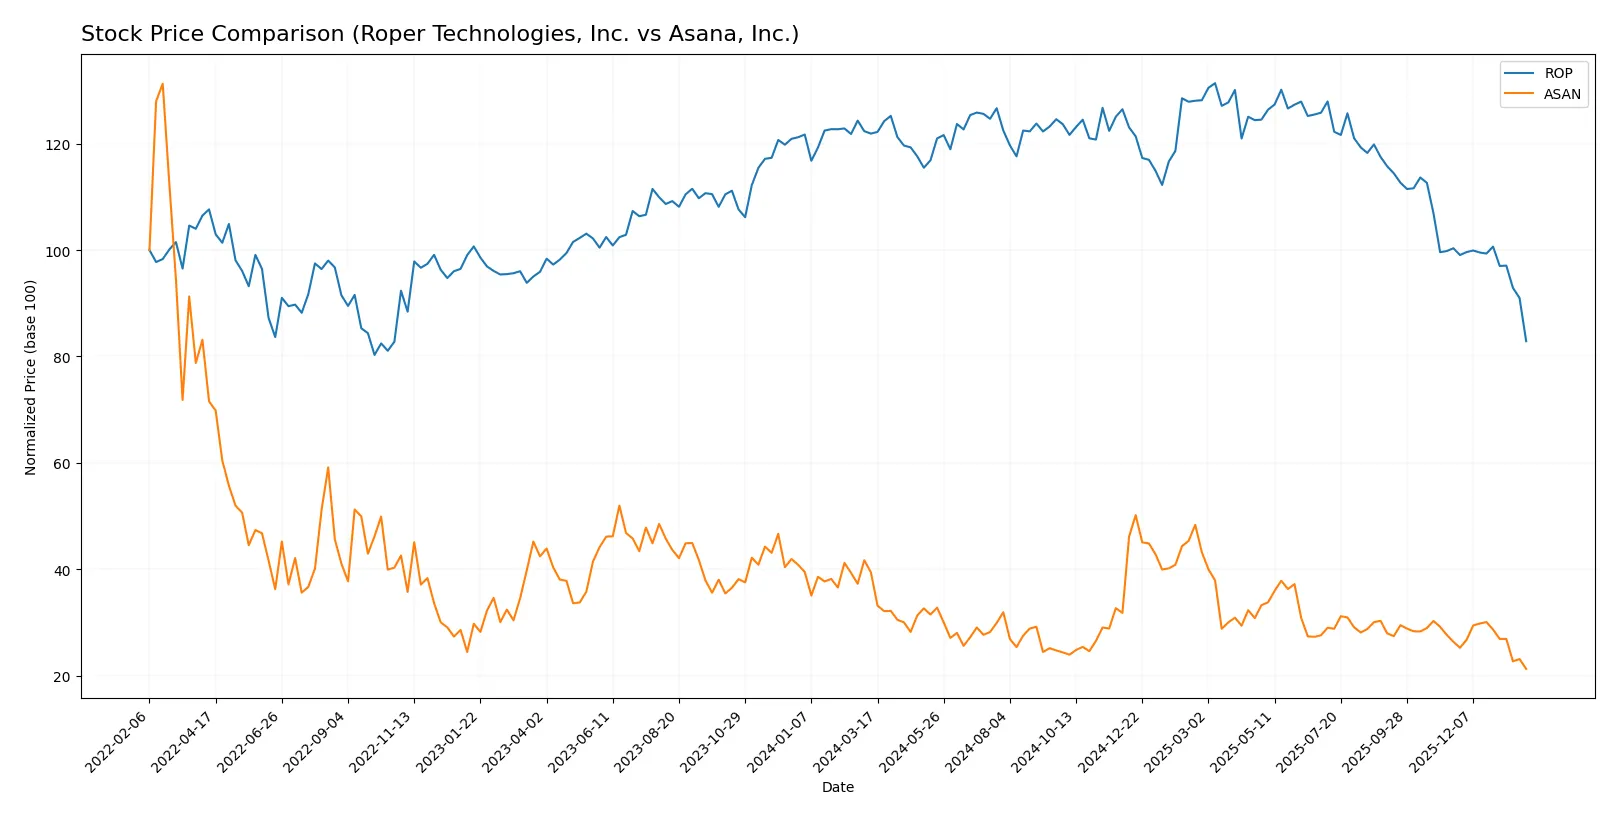
Trend Comparison
Roper Technologies, Inc. fell 32.0% over the past year, indicating a bearish trend with deceleration. The stock showed high volatility with a 44.8 std deviation and traded between 588.38 and 371.23.
Asana, Inc. declined 45.97% over the same period, confirming a bearish trend with deceleration. Volatility was low (2.88 std deviation), and the price ranged from 24.15 to 10.25.
Comparing both, Roper’s stock outperformed Asana’s with a smaller loss. Roper’s 32.0% drop contrasts with Asana’s steeper 45.97% decline over 12 months.
Target Prices
Analysts present a clear target price consensus for Roper Technologies and Asana, reflecting varied growth expectations.
| Company | Target Low | Target High | Consensus |
|---|---|---|---|
| Roper Technologies, Inc. | 365 | 575 | 475.5 |
| Asana, Inc. | 14 | 18 | 15.75 |
Roper’s consensus target price of 475.5 suggests a substantial upside from the current 371.23, signaling confidence in its industrial software and engineered products. Asana’s 15.75 target also exceeds its 10.25 market price, indicating optimism despite recent volatility.

Don’t Let Luck Decide Your Entry Point
Optimize your entry points with our advanced ProRealTime indicators. You’ll get efficient buy signals with precise price targets for maximum performance. Start outperforming now!
How do institutions grade them?
The following tables summarize recent institutional grades for Roper Technologies, Inc. and Asana, Inc.:
Roper Technologies, Inc. Grades
Institutional grades for Roper Technologies, Inc. from January 2026:
| Grading Company | Action | New Grade | Date |
|---|---|---|---|
| Goldman Sachs | Maintain | Neutral | 2026-01-29 |
| Argus Research | Downgrade | Hold | 2026-01-28 |
| Oppenheimer | Downgrade | Perform | 2026-01-28 |
| Mizuho | Maintain | Underperform | 2026-01-28 |
| Truist Securities | Maintain | Buy | 2026-01-28 |
| RBC Capital | Maintain | Sector Perform | 2026-01-28 |
| Barclays | Maintain | Underweight | 2026-01-28 |
| Stifel | Downgrade | Hold | 2026-01-28 |
| Citigroup | Maintain | Buy | 2026-01-28 |
| JP Morgan | Maintain | Underweight | 2026-01-28 |
Asana, Inc. Grades
Institutional grades for Asana, Inc. from late 2025 to early 2026:
| Grading Company | Action | New Grade | Date |
|---|---|---|---|
| Citigroup | Upgrade | Buy | 2026-01-15 |
| RBC Capital | Maintain | Underperform | 2026-01-05 |
| Keybanc | Upgrade | Overweight | 2025-12-15 |
| DA Davidson | Maintain | Neutral | 2025-12-04 |
| Citigroup | Maintain | Neutral | 2025-12-03 |
| UBS | Maintain | Neutral | 2025-12-03 |
| RBC Capital | Maintain | Underperform | 2025-12-03 |
| Baird | Maintain | Neutral | 2025-09-04 |
| Morgan Stanley | Maintain | Underweight | 2025-09-04 |
| Piper Sandler | Maintain | Overweight | 2025-09-04 |
Which company has the best grades?
Asana, Inc. holds several upgrades to Buy and Overweight, signaling growing institutional confidence. Roper Technologies mostly maintains or downgrades to Neutral or Hold, reflecting cautious sentiment. Investors may view Asana’s grades as more optimistic at this time.
Risks specific to each company
The following categories identify the critical pressure points and systemic threats facing both firms in the 2026 market environment:
1. Market & Competition
Roper Technologies, Inc.
- Operates in diverse industrial sectors with established client base, facing moderate competition.
Asana, Inc.
- Competes in a crowded software application market with rapid innovation and aggressive rivals.
2. Capital Structure & Debt
Roper Technologies, Inc.
- Shows favorable debt-to-assets and interest coverage ratios, indicating manageable leverage.
Asana, Inc.
- Exhibits high debt-to-equity ratio and negative interest coverage, signaling financial stress.
3. Stock Volatility
Roper Technologies, Inc.
- Beta of 0.94 suggests slightly below-market volatility, offering relative stability.
Asana, Inc.
- Beta of 0.92 indicates similar volatility, but price range and recent declines imply higher risk.
4. Regulatory & Legal
Roper Technologies, Inc.
- Industrial sector subject to standard compliance; no major regulatory red flags reported.
Asana, Inc.
- Software sector faces evolving data privacy and security regulations, increasing legal risks.
5. Supply Chain & Operations
Roper Technologies, Inc.
- Complex hardware and software products expose it to supply chain disruptions and operational risks.
Asana, Inc.
- Primarily cloud-based platform with less physical supply chain risk but dependent on infrastructure stability.
6. ESG & Climate Transition
Roper Technologies, Inc.
- Industrial operations likely face pressure on emissions and resource usage; transition costs possible.
Asana, Inc.
- Software company has lower direct emissions but must address data center energy consumption and governance.
7. Geopolitical Exposure
Roper Technologies, Inc.
- US-based with diversified global clients; exposed to trade tensions and foreign regulations.
Asana, Inc.
- US-headquartered with international users; geopolitical risks include data sovereignty and cross-border compliance.
Which company shows a better risk-adjusted profile?
Roper Technologies faces its greatest risk in operational complexity and moderate market competition but maintains strong financial health and debt control. Asana wrestles with severe capital structure weaknesses and negative profitability, elevating financial risk despite a growth market. The Altman Z-score places Roper in a grey zone of moderate risk, while Asana is in distress. Roper’s strong Piotroski score (9) contrasts sharply with Asana’s average (4), underpinning Roper’s superior risk-adjusted profile. The stark difference in debt management and profitability metrics justifies greater caution with Asana.
Final Verdict: Which stock to choose?
Roper Technologies, Inc. (ROP) wields unmatched operational efficiency and consistent free cash flow generation, making it a resilient cash machine. Its main point of vigilance is a stretched liquidity profile, evident in a very low current ratio. This stock fits well in portfolios seeking steady income and moderate growth with some risk tolerance.
Asana, Inc. (ASAN) benefits from a strategic moat rooted in its cloud-based collaboration platform and recurring revenue potential. It offers a comparatively safer liquidity position than ROP, thanks to a healthier current ratio. This stock suits investors focused on GARP (Growth at a Reasonable Price) with a tolerance for ongoing profitability challenges.
If you prioritize resilient cash flow and operational strength, Roper Technologies outshines due to its efficient capital use and solid income profile despite liquidity concerns. However, if you seek growth in innovative software with better short-term liquidity, Asana offers better stability but commands a premium amid ongoing value erosion. Both present distinct analytical scenarios depending on your risk and growth appetite.
Disclaimer: Investment carries a risk of loss of initial capital. The past performance is not a reliable indicator of future results. Be sure to understand risks before making an investment decision.
Go Further
I encourage you to read the complete analyses of Roper Technologies, Inc. and Asana, Inc. to enhance your investment decisions: