Home > Comparison > Industrials > ROK vs TER
The strategic rivalry between Rockwell Automation, Inc. and Teradyne, Inc. shapes the trajectory of industrial and technology sectors. Rockwell Automation stands as a capital-intensive industrial machinery leader specializing in automation and digital transformation. Teradyne operates as a high-tech semiconductor and testing equipment innovator. This analysis pits industrial robustness against technological agility to identify which company offers superior risk-adjusted returns for diversified portfolios.

Table of contents
Companies Overview
Rockwell Automation and Teradyne hold pivotal roles in industrial automation and semiconductor testing, respectively, shaping key technology sectors.
Rockwell Automation, Inc.: Industrial Automation Leader
Rockwell Automation dominates the industrial machinery sector with automated and digital transformation solutions. Its core revenue stems from intelligent devices, software, and lifecycle services. In 2026, Rockwell focuses strategically on integrating digital twin simulations and expanding its software & control segment to enhance operational efficiency across diverse industries.
Teradyne, Inc.: Semiconductor Test Innovator
Teradyne leads in semiconductor and system test equipment, generating revenue through advanced automatic test platforms and industrial automation robotics. In 2026, Teradyne emphasizes expanding its wireless test segment and collaborative robots, targeting growth in 5G technologies and smart manufacturing solutions.
Strategic Collision: Similarities & Divergences
Both companies prioritize automation but diverge in approach: Rockwell favors a broad industrial ecosystem with software integration, while Teradyne specializes in high-precision semiconductor test and robotics. Their primary battleground is manufacturing efficiency and digital transformation. Rockwell offers a diversified industrial play; Teradyne presents a focused technology growth profile with higher beta risk.
Income Statement Comparison
This data dissects the core profitability and scalability of both corporate engines to reveal who dominates the bottom line:
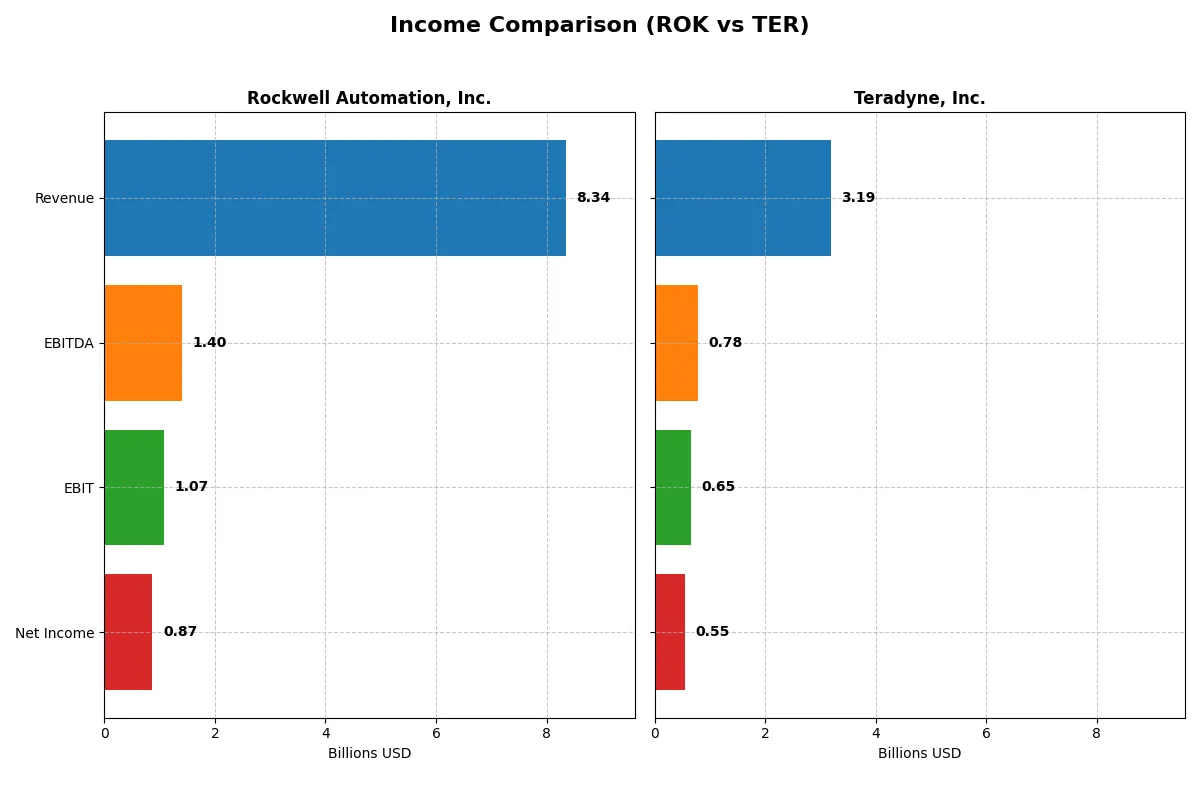
| Metric | Rockwell Automation (ROK) | Teradyne (TER) |
|---|---|---|
| Revenue | 8.34B | 3.19B |
| Cost of Revenue | 4.33B | 1.32B |
| Operating Expenses | 2.59B | 1.17B |
| Gross Profit | 4.02B | 1.87B |
| EBITDA | 1.40B | 780M |
| EBIT | 1.07B | 653M |
| Interest Expense | 156M | 8M |
| Net Income | 869M | 554M |
| EPS | 7.69 | 3.49 |
| Fiscal Year | 2025 | 2025 |
Income Statement Analysis: The Bottom-Line Duel
This income statement comparison reveals which company operates with greater efficiency and financial discipline, underpinning their core profitability.
Rockwell Automation, Inc. Analysis
Rockwell Automation’s revenue shows steady growth, reaching $8.3B in 2025, but net income declined to $867M, indicating margin pressures. Gross margin remains healthy at 48.1%, yet net margin fell to 10.4%, reflecting rising costs and weaker operational momentum in the latest year.
Teradyne, Inc. Analysis
Teradyne’s revenue advanced 13% to $3.2B in 2025, fueling a 6.6% EBIT growth to $653M. Its gross margin excels at 58.6%, and net margin at 17.4% outperforms peers, although net margin slightly contracted. Efficiency gains and robust R&D investment support Teradyne’s upward momentum.
Margin Strength vs. Growth Trajectory
Teradyne commands superior margin profiles, showcasing better cost control and operational leverage. Rockwell posts higher absolute revenues but suffers margin erosion and earnings decline. For investors prioritizing profitability and margin resilience, Teradyne’s model appears more compelling despite its smaller scale.
Financial Ratios Comparison
These vital ratios act as a diagnostic tool to expose the underlying fiscal health, valuation premiums, and capital efficiency for the companies compared below:
| Ratios | Rockwell Automation (ROK) | Teradyne (TER) |
|---|---|---|
| ROE | 23.78% | 19.82% |
| ROIC | 13.71% | 18.45% |
| P/E | 45.33 | 54.64 |
| P/B | 10.78 | 10.83 |
| Current Ratio | 1.14 | 1.76 |
| Quick Ratio | 0.77 | 1.41 |
| D/E | 1.00 | 0.12 |
| Debt-to-Assets | 32.51% | 8.32% |
| Interest Coverage | 9.12 | 86.44 |
| Asset Turnover | 0.74 | 0.76 |
| Fixed Asset Turnover | 6.95 | 4.99 |
| Payout ratio | 68.01% | 13.77% |
| Dividend yield | 1.50% | 0.25% |
| Fiscal Year | 2025 | 2025 |
Efficiency & Valuation Duel: The Vital Signs
Financial ratios act as the company’s DNA, unveiling hidden risks and operational excellence that drive investment decisions.
Rockwell Automation, Inc.
Rockwell Automation posts a robust 23.78% ROE and a solid 10.42% net margin, signaling efficient profitability. Its P/E of 45.33 and P/B of 10.78 mark the stock as stretched, reflecting high market expectations. Shareholders receive a 1.5% dividend yield, balancing returns while the firm invests in R&D at 8.14% of revenue.
Teradyne, Inc.
Teradyne delivers strong profitability with a 19.82% ROE and a superior 17.37% net margin. The stock trades at an elevated P/E of 54.64, indicating premium valuation. It maintains low leverage and high liquidity, but offers a low 0.25% dividend yield, instead channeling capital aggressively into R&D at 15.82% of sales for growth.
Premium Valuation vs. Operational Safety
Teradyne offers a more favorable ratio profile with higher margin efficiency and stronger balance sheet health despite its premium valuation. Rockwell shows solid profitability but faces valuation stretch and moderate liquidity. Growth-focused investors may prefer Teradyne’s aggressive reinvestment, while income seekers might lean toward Rockwell’s dividend yield.
Which one offers the Superior Shareholder Reward?
I compare Rockwell Automation (ROK) and Teradyne (TER) based on dividends, payout ratios, and buyback intensity. ROK offers a 1.5% dividend yield with a 68% payout ratio, supported by strong free cash flow (FCF) coverage near 1.9x, indicating a sustainable payout. TER yields only 0.25%, with a 14% payout ratio, prioritizing reinvestment over dividends. Both companies run buybacks, but ROK’s mature distribution model combines dividends and buybacks for consistent total return. TER’s low leverage and high operating margins suggest growth-focused reinvestment. However, ROK’s balanced cash return policy offers a more attractive and sustainable shareholder reward in 2026.
Comparative Score Analysis: The Strategic Profile
The radar chart reveals the fundamental DNA and trade-offs of Rockwell Automation and Teradyne, highlighting their core financial strengths and vulnerabilities:
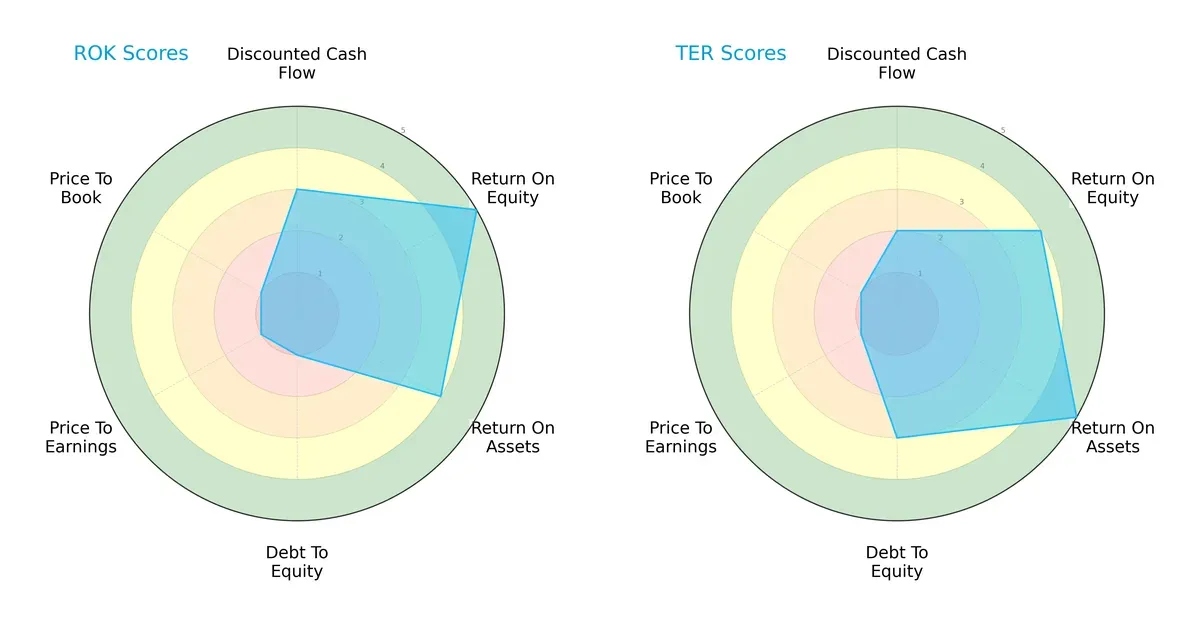
Rockwell Automation excels in return on equity (5 vs. 4) and return on assets (4 vs. 5), showing strong profitability with slight edge in ROE. Teradyne offers better asset efficiency and a more balanced debt profile (3 vs. 1). Both struggle with valuation metrics (P/E and P/B scores at 1), signaling potential overvaluation. Rockwell’s very low debt-to-equity score flags financial risk, while Teradyne’s moderate leverage suggests greater stability. Teradyne presents a more balanced profile; Rockwell leans heavily on profitability strengths.
Bankruptcy Risk: Solvency Showdown
The Altman Z-Score gap underscores Teradyne’s superior solvency and lower bankruptcy risk in this cycle:
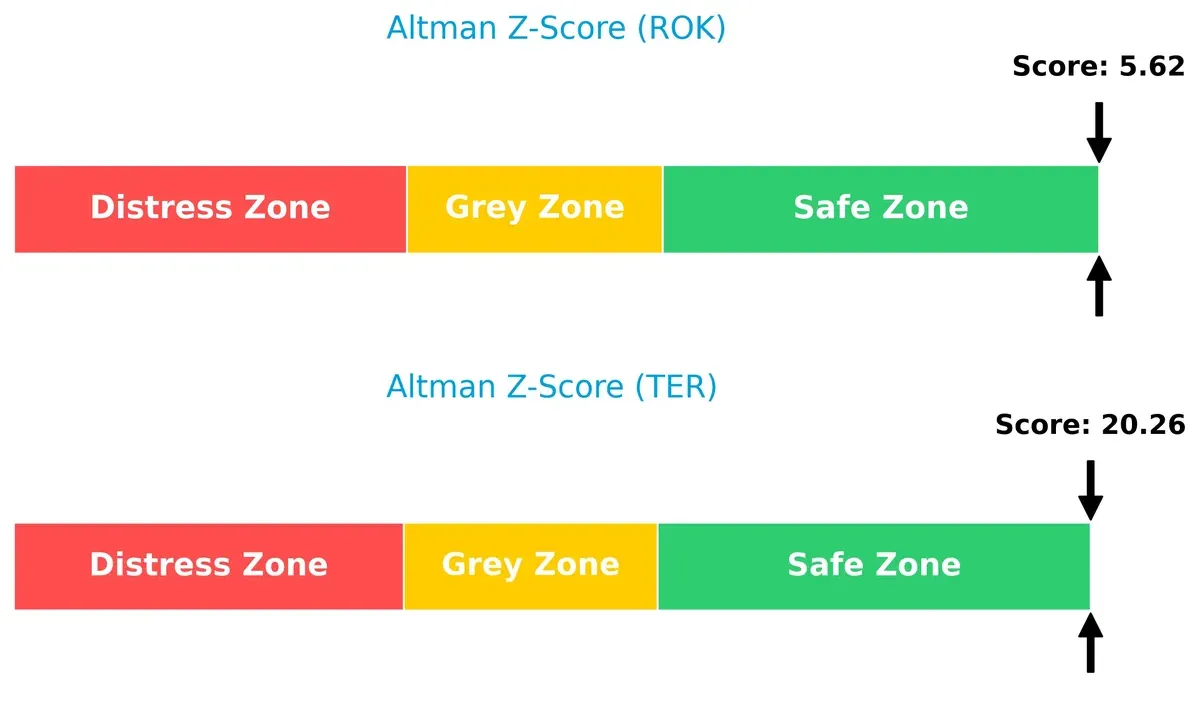
Teradyne posts a stellar 20.3, deep in the safe zone. Rockwell’s 5.6 is also safe but markedly lower, indicating higher sensitivity to economic downturns. Teradyne offers stronger long-term survival potential.
Financial Health: Quality of Operations
Piotroski F-Scores reveal Rockwell’s superior operational quality and internal financial strength:
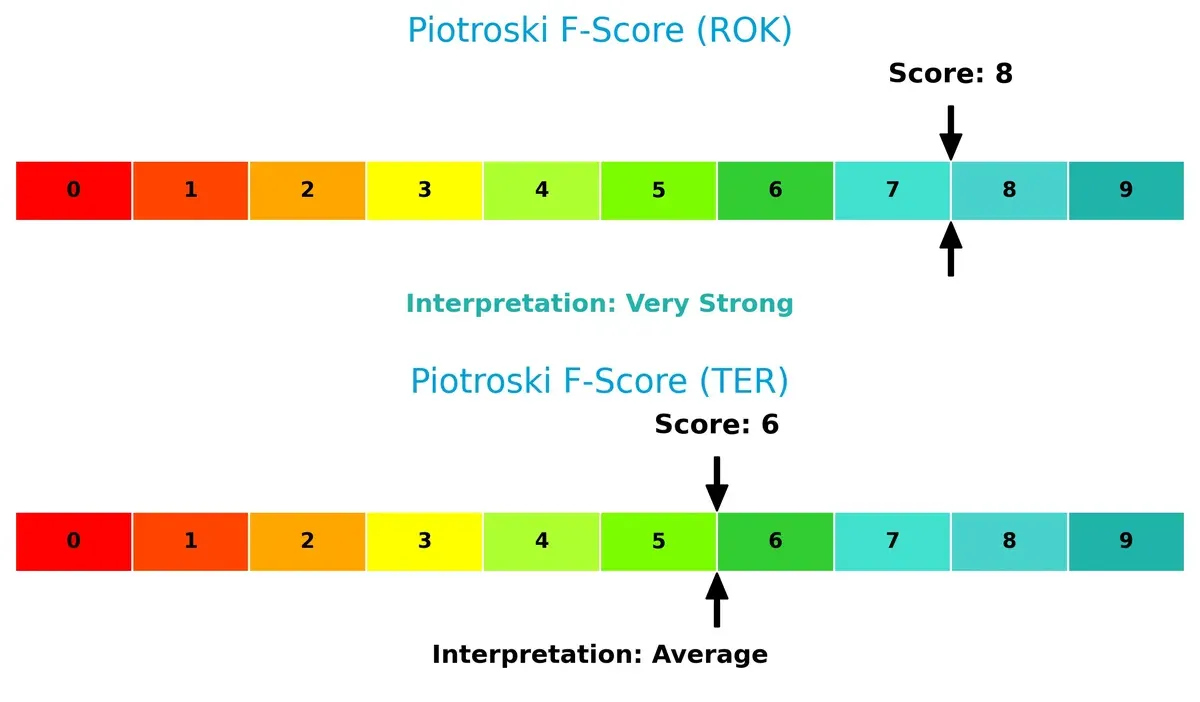
Rockwell’s 8 signals peak financial health with robust profitability, liquidity, and efficiency. Teradyne’s 6 is average, suggesting some internal weaknesses. Investors should note Rockwell’s stronger fundamentals despite its higher leverage risk.
How are the two companies positioned?
This section dissects the operational DNA of Rockwell Automation and Teradyne by comparing revenue distribution and internal strengths and weaknesses. The goal is to confront their economic moats and identify which model offers the most resilient competitive advantage today.
Revenue Segmentation: The Strategic Mix
This comparison dissects how Rockwell Automation, Inc. and Teradyne, Inc. diversify income streams and where their primary sector bets lie:
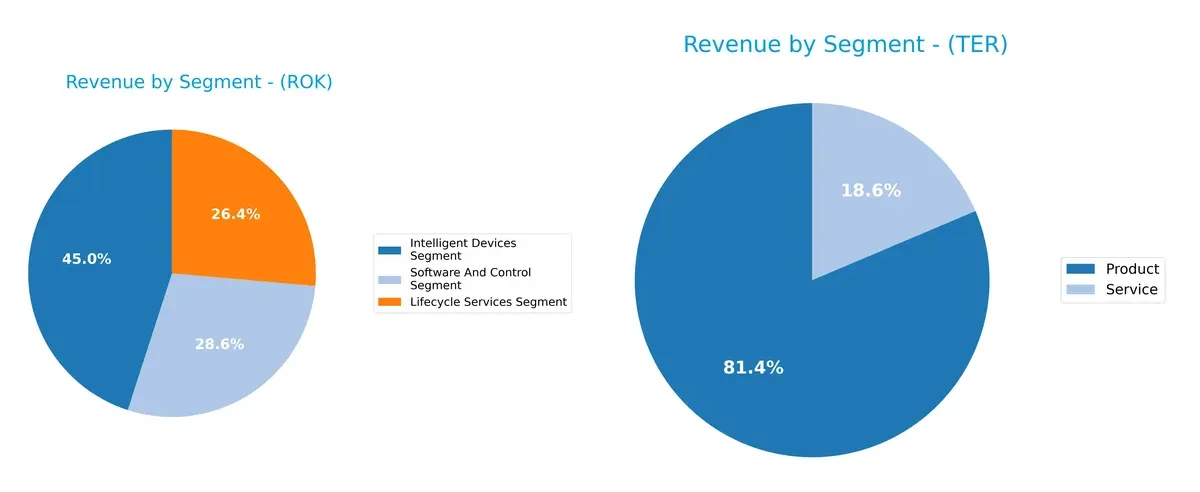
Rockwell Automation anchors its revenue in three balanced segments: Intelligent Devices at $3.76B, Software and Control at $2.38B, and Lifecycle Services at $2.20B. This mix reflects strategic ecosystem integration and recurring service income. Teradyne, by contrast, dwarfs in Product sales with $2.29B, while Services lag at $525M, signaling a heavier reliance on hardware sales and greater exposure to cyclical demand shifts. Rockwell’s broader diversification reduces concentration risk.
Strengths and Weaknesses Comparison
This table compares the Strengths and Weaknesses of Rockwell Automation (ROK) and Teradyne (TER):
ROK Strengths
- Diversified revenue across Intelligent Devices, Lifecycle Services, and Software segments
- Strong profitability with 10.42% net margin and 23.78% ROE
- Favorable ROIC at 13.71% above WACC
- Solid interest coverage of 6.88
- Broad global presence with significant North America and EMEA sales
TER Strengths
- Higher profitability with 17.37% net margin and 18.45% ROIC
- Strong liquidity and low leverage with 1.76 current ratio and 0.12 debt-to-equity
- Exceptional interest coverage of 81.43
- Favorable asset turnover and fixed asset turnover
- Global revenue spread across Asia, USA, and EMEA with growing exposure in Asia Pacific
ROK Weaknesses
- WACC slightly unfavorable at 10.53%, close to ROIC
- High valuation multiples with PE at 45.33 and PB at 10.78
- Quick ratio at 0.77 indicates weaker short-term liquidity
- Moderate debt level with debt-to-assets at 32.5%
- Dividend yield only neutral at 1.5%
TER Weaknesses
- Elevated WACC at 12.35% surpassing ROIC
- High valuation multiples with PE at 54.64 and PB at 10.83
- Low dividend yield at 0.25% unfavorable for income investors
- Asset turnover neutral at 0.76
- Service segment smaller relative to products
Overall, ROK shows a well-diversified business with solid profitability but faces liquidity and valuation challenges. TER delivers stronger profitability and liquidity with a favorable global footprint but carries higher capital costs and valuation risks. Each must balance growth, cost of capital, and market positioning in their strategic plans.
The Moat Duel: Analyzing Competitive Defensibility
A structural moat is the only true defense against the relentless erosion of profits from competition. Here’s how these two industry leaders compare:
Rockwell Automation, Inc.: Integrated Solutions and Service Moat
Rockwell Automation’s moat stems from its comprehensive automation ecosystem and strong lifecycle services. This drives stable margins and a very favorable ROIC trend (+77%). New digital offerings in 2026 could deepen its competitive edge.
Teradyne, Inc.: Technology-Driven Test Equipment Moat
Teradyne relies on advanced semiconductor and industrial automation testing tech, delivering higher ROIC vs. WACC but with a declining trend (-46%). Innovation in robotics and wireless test platforms may offset margin pressures in 2026.
Industrial Automation Ecosystem vs. High-Tech Testing Innovation
Rockwell’s moat is deeper and more sustainable, supported by growing ROIC and diversified end markets. Teradyne creates value but faces profitability headwinds. Rockwell is better positioned to defend market share long term.
Which stock offers better returns?
The past year shows strong bullish momentum for both stocks, with Teradyne delivering exceptional price gains and Rockwell Automation exhibiting steady upward acceleration.
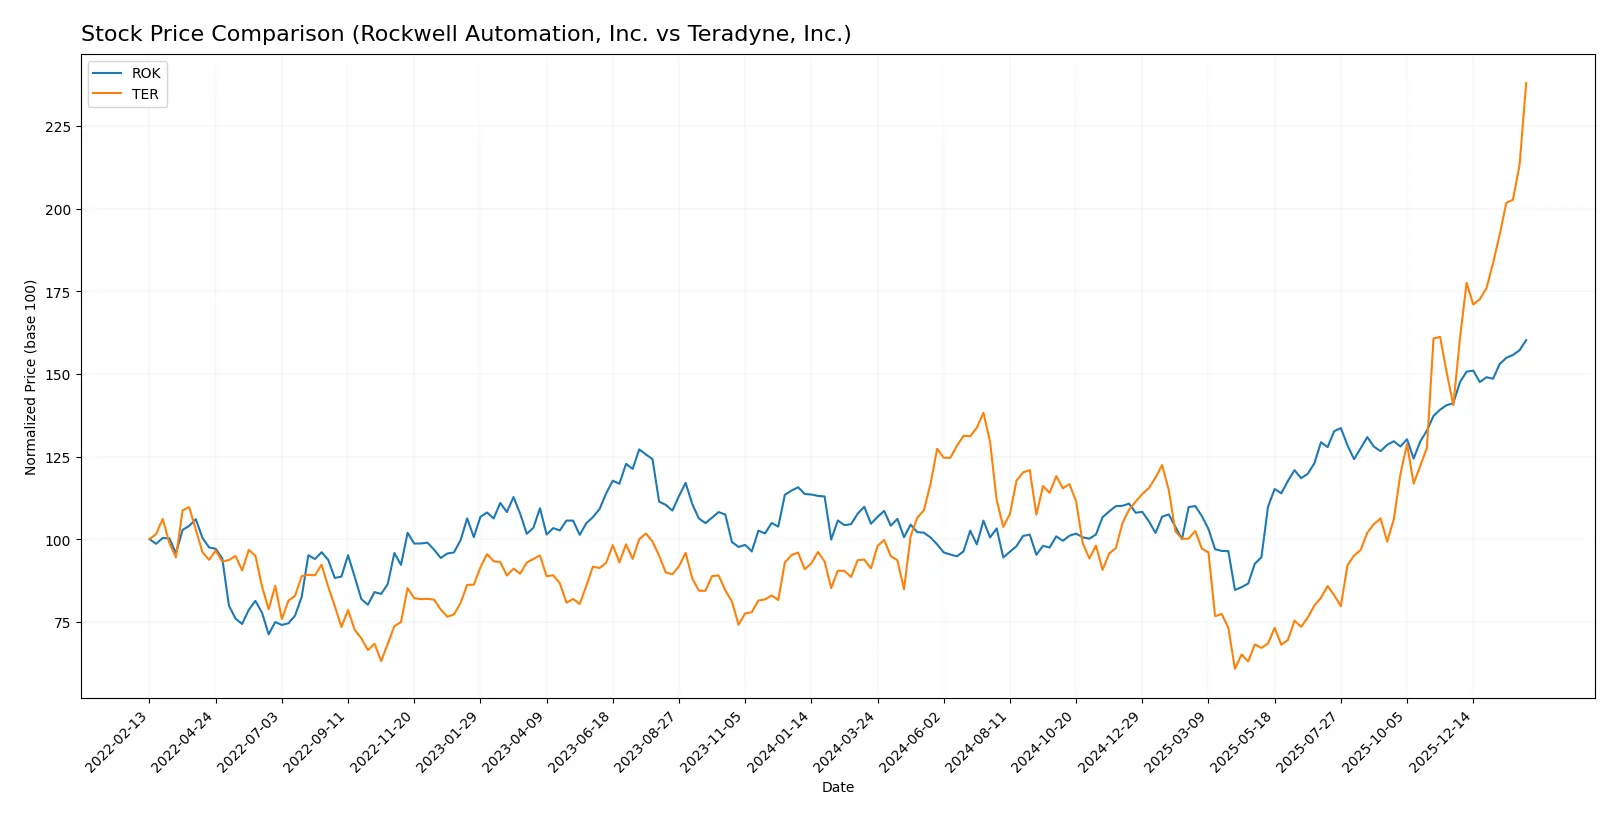
Trend Comparison
Rockwell Automation’s stock rose 53.03% over the last 12 months, showing an accelerating bullish trend from a low of 227.11 to a high near 430. Volatility is high, with a standard deviation of 50.22.
Teradyne’s stock surged 161.08% in the same period, also accelerating, from 68.72 to a peak of 269.07. Volatility is notable but lower than Rockwell’s at 39.2 standard deviation.
Teradyne’s trend outpaces Rockwell Automation’s in absolute returns and recent acceleration, delivering the highest market performance over the past year.
Target Prices
Analysts present a mixed but generally optimistic target consensus for these industrial and technology leaders.
| Company | Target Low | Target High | Consensus |
|---|---|---|---|
| Rockwell Automation, Inc. | 380 | 470 | 421.57 |
| Teradyne, Inc. | 175 | 335 | 276.08 |
Rockwell Automation’s target consensus sits slightly below its current price, suggesting limited upside or market caution. Teradyne’s consensus exceeds its current price, implying potential for price appreciation despite recent volatility.

Don’t Let Luck Decide Your Entry Point
Optimize your entry points with our advanced ProRealTime indicators. You’ll get efficient buy signals with precise price targets for maximum performance. Start outperforming now!
How do institutions grade them?
The following tables summarize the latest institutional grades for Rockwell Automation, Inc. and Teradyne, Inc.:
Rockwell Automation, Inc. Grades
This table shows recent grades and actions from notable financial institutions for Rockwell Automation, Inc.
| Grading Company | Action | New Grade | Date |
|---|---|---|---|
| Oppenheimer | Downgrade | Perform | 2026-01-20 |
| JP Morgan | Maintain | Neutral | 2026-01-16 |
| Morgan Stanley | Maintain | Overweight | 2026-01-13 |
| Barclays | Maintain | Overweight | 2026-01-07 |
| Wells Fargo | Maintain | Equal Weight | 2026-01-07 |
| Goldman Sachs | Upgrade | Neutral | 2025-12-16 |
| Jefferies | Maintain | Buy | 2025-12-10 |
| Citigroup | Maintain | Buy | 2025-12-08 |
| Barclays | Maintain | Overweight | 2025-12-04 |
| Baird | Maintain | Outperform | 2025-11-21 |
Teradyne, Inc. Grades
This table presents recent grades and actions from reputable grading companies for Teradyne, Inc.
| Grading Company | Action | New Grade | Date |
|---|---|---|---|
| Cantor Fitzgerald | Maintain | Overweight | 2026-02-04 |
| Goldman Sachs | Maintain | Buy | 2026-02-04 |
| Stifel | Maintain | Buy | 2026-02-04 |
| Evercore ISI Group | Maintain | Outperform | 2026-02-04 |
| Citigroup | Maintain | Buy | 2026-02-04 |
| Evercore ISI Group | Maintain | Outperform | 2026-02-03 |
| Cantor Fitzgerald | Maintain | Overweight | 2026-02-02 |
| Stifel | Maintain | Buy | 2026-01-30 |
| UBS | Maintain | Buy | 2026-01-26 |
| B of A Securities | Maintain | Buy | 2026-01-22 |
Which company has the best grades?
Teradyne, Inc. consistently receives high buy and outperform ratings, while Rockwell Automation shows a mix of buy, neutral, and overweight grades with one recent downgrade. This suggests Teradyne enjoys stronger institutional confidence, potentially attracting more investor interest.
Risks specific to each company
The following categories identify the critical pressure points and systemic threats facing both firms in the 2026 market environment:
1. Market & Competition
Rockwell Automation, Inc.
- Faces intense competition in industrial automation from both legacy and emerging tech firms.
Teradyne, Inc.
- Competes aggressively in semiconductor test and industrial automation markets with rapid innovation cycles.
2. Capital Structure & Debt
Rockwell Automation, Inc.
- Moderate debt levels with a D/E ratio of 1.0; interest coverage is solid but leverage is a caution.
Teradyne, Inc.
- Low debt-to-equity at 0.12, indicating a conservative capital structure and strong financial flexibility.
3. Stock Volatility
Rockwell Automation, Inc.
- Beta of 1.53 suggests moderate sensitivity to market swings, reflecting sector cyclicality.
Teradyne, Inc.
- Higher beta at 1.82 implies greater stock volatility tied to tech sector dynamics and semiconductor cycles.
4. Regulatory & Legal
Rockwell Automation, Inc.
- Subject to industrial safety and environmental regulations globally, increasing compliance costs.
Teradyne, Inc.
- Faces stringent regulations in semiconductor manufacturing and export controls impacting global sales.
5. Supply Chain & Operations
Rockwell Automation, Inc.
- Complex global supply chains with exposure to raw material price fluctuations and logistics disruptions.
Teradyne, Inc.
- Reliant on semiconductor supply chains vulnerable to geopolitical tensions and component shortages.
6. ESG & Climate Transition
Rockwell Automation, Inc.
- Increasing pressure to align with sustainability goals in industrial automation and digital transformation.
Teradyne, Inc.
- Needs to meet rising ESG standards amid tech industry scrutiny and climate transition demands.
7. Geopolitical Exposure
Rockwell Automation, Inc.
- Global operations subject to trade tensions and tariffs, especially in process and hybrid markets.
Teradyne, Inc.
- Significant exposure to Asia-Pacific semiconductor markets, sensitive to US-China relations.
Which company shows a better risk-adjusted profile?
Teradyne’s strongest risk lies in stock volatility and geopolitical exposure, given its high beta and semiconductor reliance. Rockwell’s primary concern is its leveraged capital structure amid industrial sector cyclicality. Teradyne exhibits a superior risk-adjusted profile, supported by low debt and a robust Altman Z-score of 20.3. Rockwell’s moderate leverage (D/E of 1.0) and weaker liquidity ratios temper its appeal despite a strong Piotroski score. This contrast underscores Teradyne’s more resilient financial footing in a volatile 2026 environment.
Final Verdict: Which stock to choose?
Rockwell Automation’s superpower lies in its robust capital efficiency and a very favorable moat, signaling sustainable value creation. Its point of vigilance is the mixed income growth trends, which may temper near-term earnings momentum. It suits portfolios targeting steady, long-term industrial innovation exposure.
Teradyne’s strategic moat is its commanding operational cash flow and low leverage, reflecting prudent capital allocation and recurring revenue strength. It offers better liquidity and safety profiles than Rockwell, fitting well in GARP portfolios seeking growth balanced with financial resilience.
If you prioritize a strong economic moat with consistent value creation, Rockwell outshines thanks to its improving ROIC and efficient asset use. However, if you seek higher growth with superior liquidity and lower financial risk, Teradyne offers better stability and momentum despite a declining ROIC trend. Both present compelling but distinct investment cases depending on your risk appetite and strategy.
Disclaimer: Investment carries a risk of loss of initial capital. The past performance is not a reliable indicator of future results. Be sure to understand risks before making an investment decision.
Go Further
I encourage you to read the complete analyses of Rockwell Automation, Inc. and Teradyne, Inc. to enhance your investment decisions: