Home > Comparison > Industrials > ROK vs SYM
The strategic rivalry between Rockwell Automation, Inc. and Symbotic Inc. shapes the future of industrial machinery. Rockwell Automation operates as a diversified industrial giant with integrated hardware, software, and services. In contrast, Symbotic focuses on cutting-edge warehouse automation technology for retailers and wholesalers. This analysis pits established scale against innovative specialization, aiming to identify which trajectory offers superior risk-adjusted returns for a diversified portfolio in the evolving industrial sector.
Table of contents
Companies Overview
Rockwell Automation and Symbotic stand as key players in the industrial machinery sector, shaping automation’s future in distinct ways.
Rockwell Automation, Inc.: Industrial Automation Pioneer
Rockwell Automation leads in industrial automation and digital transformation. Its revenue stems from three segments: Intelligent Devices, Software & Control, and Lifecycle Services. In 2026, Rockwell focuses on integrating advanced software solutions and connected services to enhance efficiency across diverse industries from automotive to renewable energy.
Symbotic Inc.: Warehouse Robotics Innovator
Symbotic specializes in robotic warehouse automation, boosting efficiency for retailers and wholesalers. Its core product, the Symbotic System, reduces costs and optimizes inventory management. In 2026, Symbotic emphasizes scaling its full-service automation technology to capture more market share in the dynamic logistics sector.
Strategic Collision: Similarities & Divergences
Both firms drive automation but diverge on scope: Rockwell offers a broad industrial ecosystem while Symbotic targets focused warehouse robotics. Their battle centers on automation’s role in supply chain versus industrial processes. Rockwell’s diversified model contrasts with Symbotic’s niche specialization, defining distinct risk and growth profiles for investors.
Income Statement Comparison
This data dissects the core profitability and scalability of both corporate engines to reveal who dominates the bottom line:
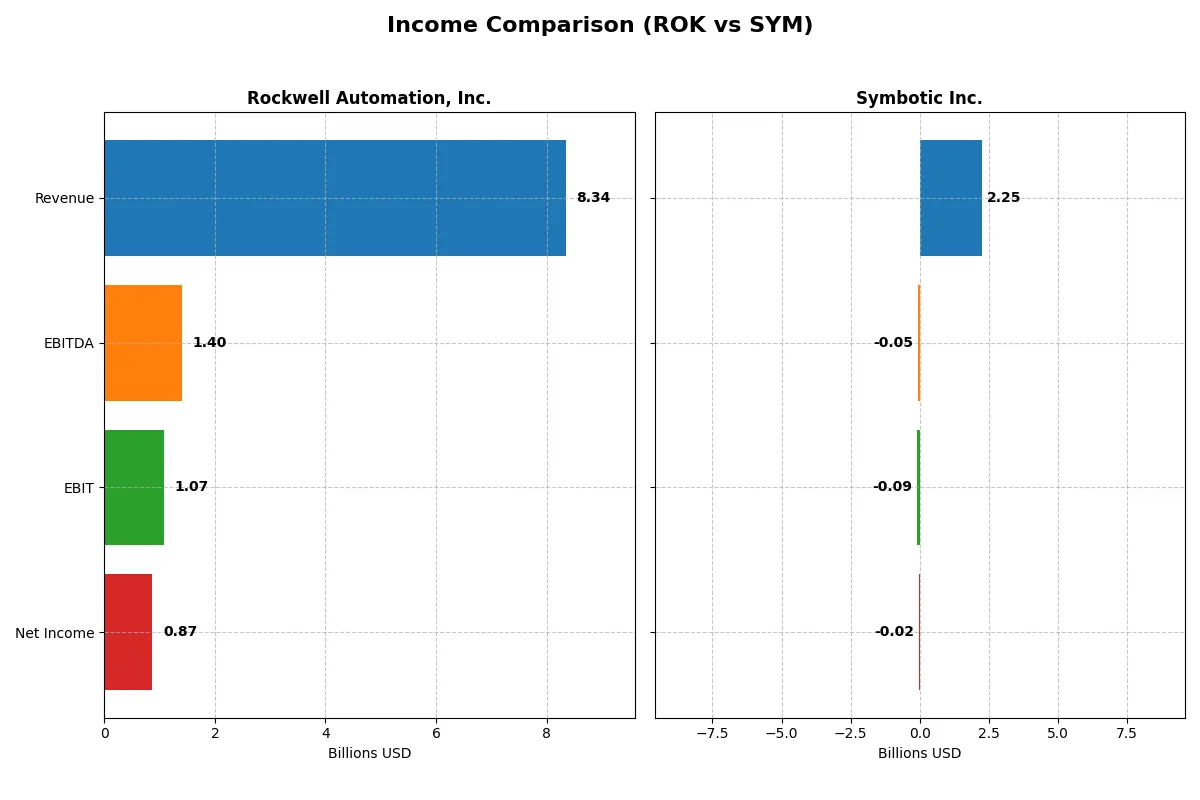
| Metric | Rockwell Automation, Inc. (ROK) | Symbotic Inc. (SYM) |
|---|---|---|
| Revenue | 8.34B | 2.25B |
| Cost of Revenue | 4.33B | 1.82B |
| Operating Expenses | 2.59B | 538M |
| Gross Profit | 4.02B | 423M |
| EBITDA | 1.40B | -48M |
| EBIT | 1.07B | -92M |
| Interest Expense | 156M | 0 |
| Net Income | 869M | -17M |
| EPS | 7.69 | -0.16 |
| Fiscal Year | 2025 | 2025 |
Income Statement Analysis: The Bottom-Line Duel
This income statement comparison reveals how efficiently each company converts revenue into profit and sustains margins in competitive environments.
Rockwell Automation, Inc. Analysis
Rockwell’s revenue modestly grew to $8.34B in 2025, but net income declined to $867M, signaling margin pressure. Its gross margin remains healthy at 48.1%, yet EBIT and net margins contracted, reflecting rising operating expenses. The 2025 net margin of 10.4% shows resilience but slower momentum compared to prior years.
Symbotic Inc. Analysis
Symbotic’s revenue surged 25.6% to $2.25B in 2025, with gross margin steady at 18.8%. However, it reported a net loss of $17M despite top-line growth. EBIT margin remained negative at -4.1%, highlighting ongoing profitability challenges. The company shows strong revenue growth but must improve cost control to reach profitability.
Margin Strength vs. Growth Trajectory
Rockwell delivers superior profitability and margin stability despite slower growth. Symbotic impresses with rapid revenue expansion but struggles with sustained losses. For investors prioritizing earnings quality and margin durability, Rockwell’s profile stands out. Those focused on high-growth potential must weigh Symbotic’s riskier earnings path carefully.
Financial Ratios Comparison
These vital ratios act as a diagnostic tool to expose the underlying fiscal health, valuation premiums, and capital efficiency of each company:
| Ratios | Rockwell Automation (ROK) | Symbotic Inc. (SYM) |
|---|---|---|
| ROE | 23.8% | -7.7% |
| ROIC | 13.7% | -16.6% |
| P/E | 45.3 | -334.5 |
| P/B | 10.8 | 25.6 |
| Current Ratio | 1.14 | 1.08 |
| Quick Ratio | 0.77 | 0.99 |
| D/E (Debt-to-Equity) | 1.00 | 0.14 |
| Debt-to-Assets | 32.5% | 1.3% |
| Interest Coverage | 9.12 | 0 |
| Asset Turnover | 0.74 | 0.94 |
| Fixed Asset Turnover | 6.95 | 15.92 |
| Payout ratio | 68.0% | 0% |
| Dividend yield | 1.50% | 0% |
| Fiscal Year | 2025 | 2025 |
Efficiency & Valuation Duel: The Vital Signs
Financial ratios serve as a company’s DNA, exposing hidden risks and operational strengths essential for sound investment decisions.
Rockwell Automation, Inc.
Rockwell Automation demonstrates strong profitability with a favorable 23.78% ROE and 10.42% net margin, signaling efficient core operations. Its valuation appears stretched, with a high P/E of 45.33 and a P/B of 10.78. The firm returns value through a modest 1.5% dividend yield, balancing shareholder payouts with steady reinvestment in R&D.
Symbotic Inc.
Symbotic struggles with negative returns: ROE at -7.65% and net margin at -0.75%, reflecting operational challenges. The stock carries an unusual negative P/E but a steep P/B of 25.6, suggesting a valuation disconnected from fundamentals. Symbotic offers no dividends, focusing on growth through heavy R&D investment, yet risks remain elevated.
Premium Valuation vs. Operational Safety
Rockwell Automation offers a better balance of profitability and risk with solid returns and a manageable dividend. Symbotic’s high valuation and negative profitability reflect greater uncertainty. Investors seeking operational safety may prefer Rockwell, while those tolerating risk might consider Symbotic’s growth profile.
Which one offers the Superior Shareholder Reward?
Rockwell Automation (ROK) delivers a more attractive shareholder reward than Symbotic (SYM) in 2026. ROK pays a steady dividend with a 1.5% yield and a payout ratio near 68%, supported by strong free cash flow coverage (~88%). It also executes buybacks, enhancing total returns. SYM, by contrast, pays no dividends and relies on reinvestment for growth. While SYM’s buyback activity is limited, its negative profit margins and volatile cash flow raise sustainability concerns. ROK’s balanced distribution through dividends and buybacks offers a more reliable, long-term value proposition for investors.
Comparative Score Analysis: The Strategic Profile
The radar chart reveals the fundamental DNA and key trade-offs shaping both Rockwell Automation, Inc. and Symbotic Inc.:
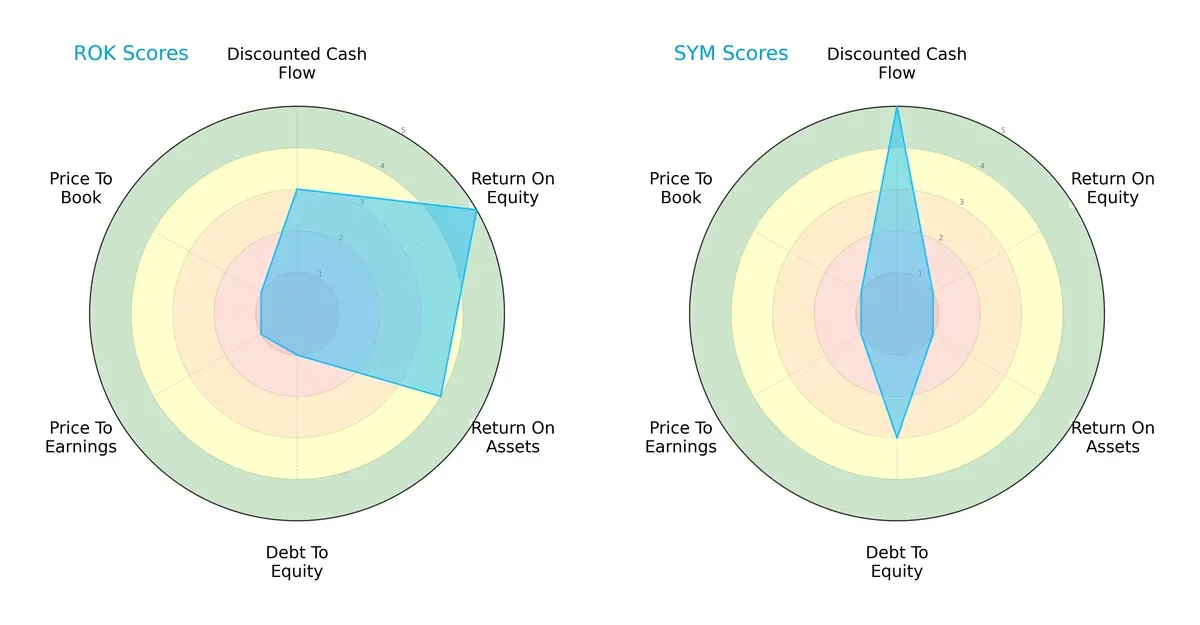
Rockwell Automation presents a balanced profile with strong ROE (5) and ROA (4) scores, offset by very weak Debt/Equity (1) and valuation metrics (PE and PB scores both 1). Symbotic leans heavily on a superior DCF score (5) but suffers from poor profitability scores (ROE and ROA at 1) and only moderate financial leverage (Debt/Equity 3). Rockwell’s strength lies in operational efficiency, while Symbotic relies more on cash flow potential but faces valuation skepticism.
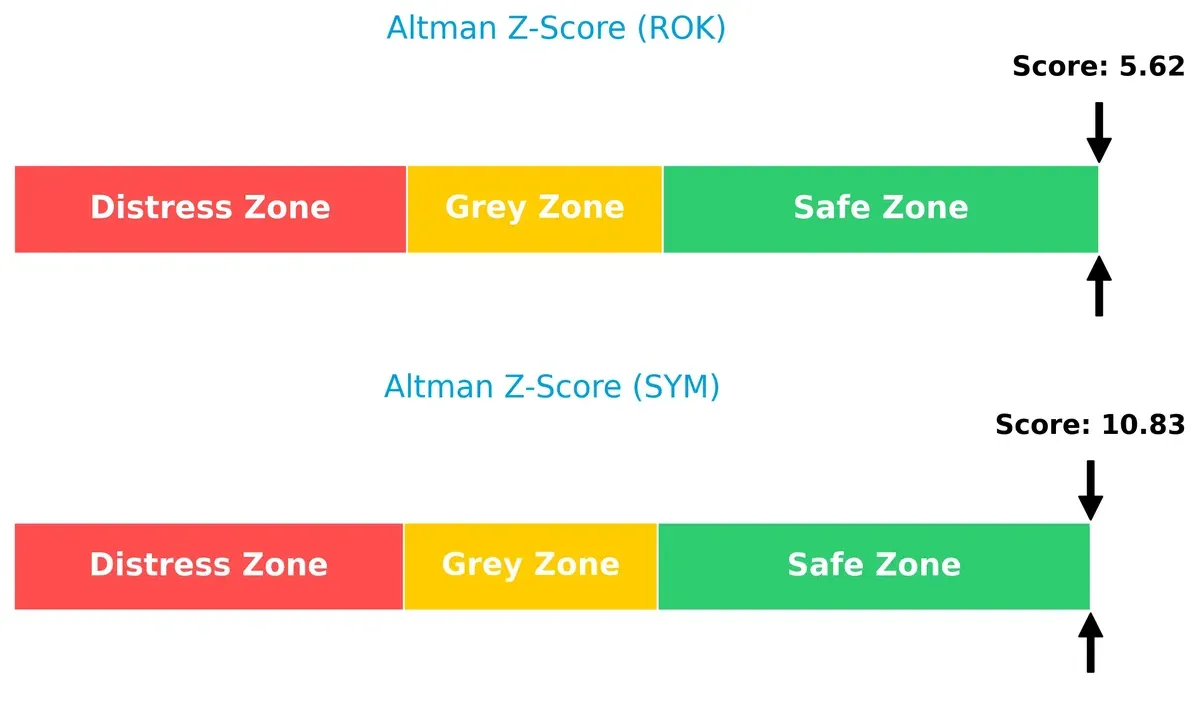
Bankruptcy Risk: Solvency Showdown
Rockwell Automation’s Altman Z-Score of 5.6 trails Symbotic’s 10.8, both comfortably in the safe zone, indicating strong long-term survival prospects:
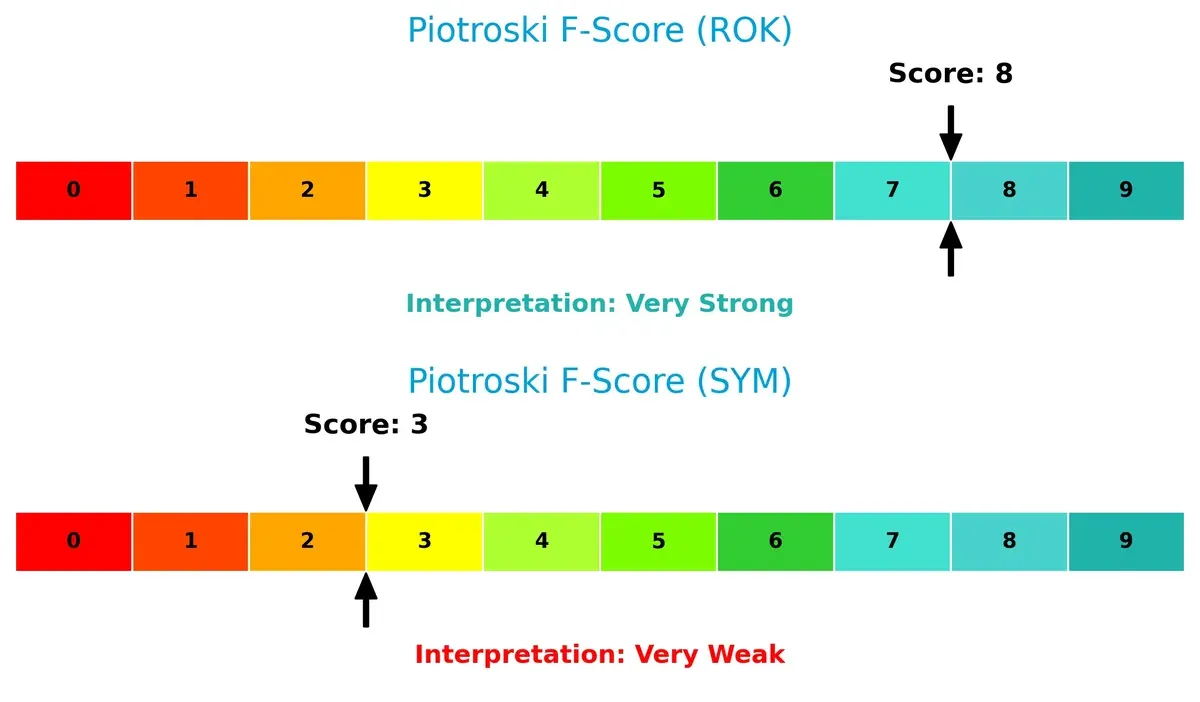
Financial Health: Quality of Operations
Rockwell scores an 8 on the Piotroski scale, signaling robust financial health and operational quality. Symbotic’s score of 3 raises red flags about internal financial weaknesses and operational inefficiencies:
How are the two companies positioned?
This section dissects Rockwell Automation and Symbotic’s operational DNA by comparing revenue distribution and internal strengths and weaknesses. The goal is to confront their economic moats and identify which model offers the most resilient competitive advantage today.
Revenue Segmentation: The Strategic Mix
This visual comparison dissects how Rockwell Automation and Symbotic diversify their income streams and reveals where their primary sector bets lie:
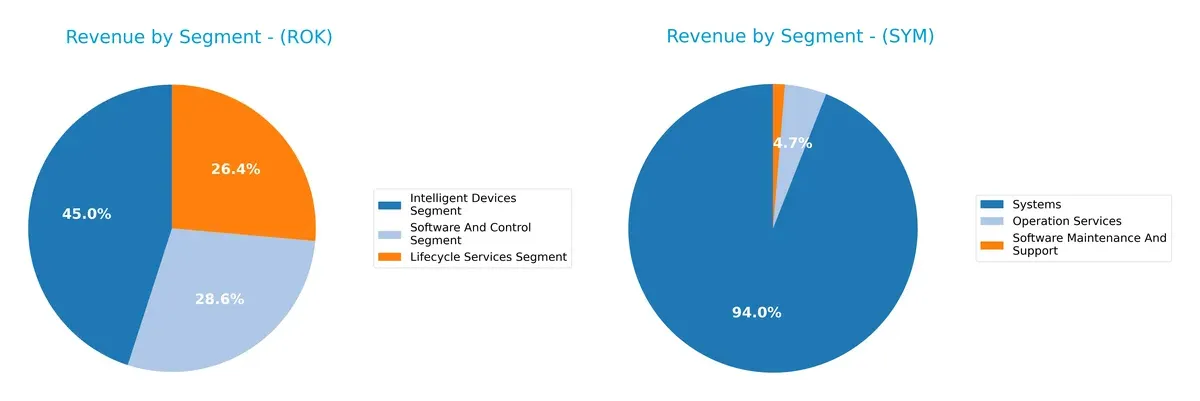
Rockwell Automation anchors its revenue in three balanced segments: Intelligent Devices at $3.76B, Lifecycle Services $2.20B, and Software & Control $2.38B. This diversified mix reduces concentration risk and supports ecosystem lock-in. Symbotic, however, pivots heavily on Systems, generating $2.12B, dwarfing its Operation Services $105M and Software Maintenance $30M. Symbotic’s reliance on a dominant segment exposes it to sector-specific volatility but highlights infrastructure dominance.
Strengths and Weaknesses Comparison
This table compares the strengths and weaknesses of Rockwell Automation and Symbotic based on diversification, profitability, financials, innovation, global presence, and market share:
Rockwell Automation Strengths
- Diversified segments with Intelligent Devices, Lifecycle Services, and Software Control
- Favorable profitability ratios including 10.42% net margin and 23.78% ROE
- Strong interest coverage at 6.88 and fixed asset turnover of 6.95
- Broad global presence with significant revenues across North America, EMEA, and Asia Pacific
Symbotic Strengths
- Low leverage with debt-to-assets at 1.32% and debt-to-equity at 0.14
- Favorable fixed asset turnover at 15.92 indicating asset efficiency
- Neutral liquidity ratios with current ratio 1.08 and quick ratio 0.99
- Concentrated revenue mostly from U.S. markets with growing systems segment
Rockwell Automation Weaknesses
- Elevated valuation multiples with P/E at 45.33 and P/B at 10.78
- Quick ratio below 1 at 0.77 suggests liquidity risk
- Weighted average cost of capital (WACC) unfavorable at 10.53%
- Moderate debt levels with debt-to-assets at 32.51%
- Dividend yield only neutral at 1.5%
Symbotic Weaknesses
- Negative profitability with -0.75% net margin and -7.65% ROE
- Unfavorable WACC at 13.86% and zero interest coverage
- Negative ROIC at -16.63% signals poor capital efficiency
- No dividend yield and high P/B at 25.6
- High proportion of revenue concentrated in U.S., limited geographic diversification
Rockwell Automation demonstrates balanced strengths in profitability, global footprint, and operational efficiency but faces valuation and liquidity concerns. Symbotic’s strengths lie in low leverage and asset turnover, yet persistent losses and geographic concentration pose material challenges to its financial stability and growth strategy.
The Moat Duel: Analyzing Competitive Defensibility
A structural moat is the only true shield guarding long-term profits from relentless competitive pressure and market disruption:
Rockwell Automation, Inc.: Cost Advantage & Intangible Assets
Rockwell Automation’s moat stems from its integrated industrial automation platform and decades of brand trust. Its high ROIC exceeding WACC by 3.18% confirms efficient capital use. The company’s expanding digital transformation portfolio should deepen this moat in 2026.
Symbotic Inc.: Innovation-Driven Network Effects
Symbotic’s moat relies on cutting-edge robotics and proprietary warehouse automation systems. Despite rapid revenue growth, negative ROIC and shrinking profitability erode its competitive edge. Scaling new markets could turn this around but risks remain high in 2026.
Verdict: Cost Leadership vs. Innovation Scalability
Rockwell Automation holds a wider and deeper moat, demonstrated by sustained value creation and margin stability. Symbotic’s innovation offers promise but faces a steep path to profitability. Rockwell is better positioned to defend market share amid industrial automation competition.
Which stock offers better returns?
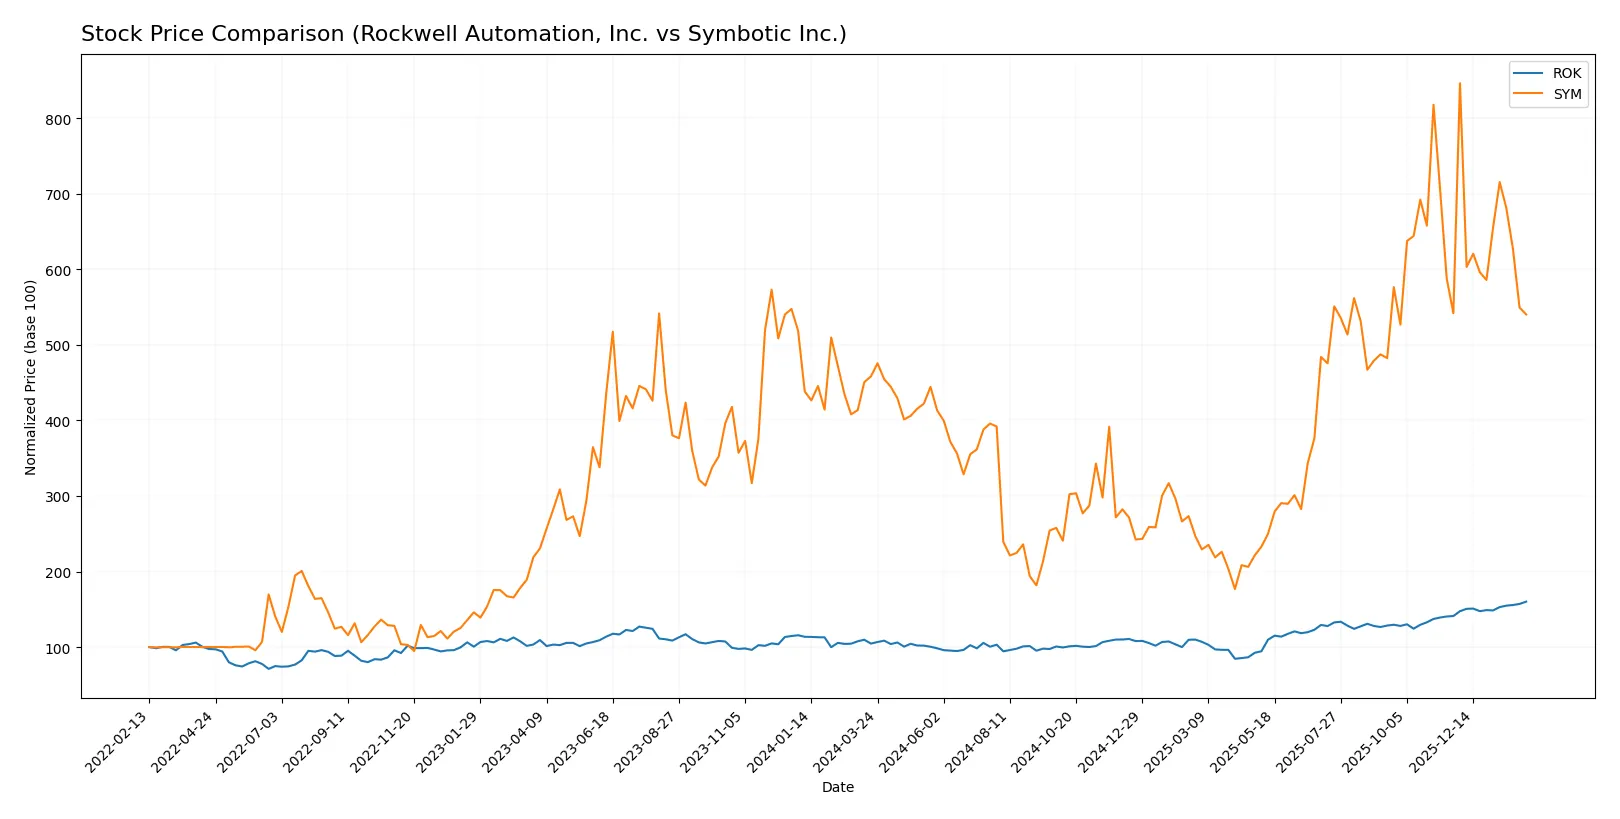
Over the past year, both Rockwell Automation, Inc. and Symbotic Inc. exhibited distinct price movements, with Rockwell showing a strong upward momentum while Symbotic’s gains moderated late in the period.
Trend Comparison
Rockwell Automation, Inc. posted a 53.03% price increase over the last 12 months, signaling a bullish trend with accelerating gains and high volatility reflected in a 50.22 standard deviation.
Symbotic Inc. reported a 17.9% price rise over the same period, confirming a bullish trend but with decelerating momentum and moderate volatility at a 15.71 standard deviation.
Comparing both, Rockwell Automation delivered the highest market performance, outperforming Symbotic by a wide margin in overall price appreciation during the past year.
Target Prices
Analysts present a mixed but generally optimistic target consensus across these industrial automation companies.
| Company | Target Low | Target High | Consensus |
|---|---|---|---|
| Rockwell Automation, Inc. | 380 | 470 | 421.57 |
| Symbotic Inc. | 42 | 83 | 65.56 |
Rockwell’s consensus target of 421.57 slightly lags its current price of 429.84, signaling a modest downside risk. Symbotic’s target consensus of 65.56 suggests considerable upside potential from its current 53.48 price.

Don’t Let Luck Decide Your Entry Point
Optimize your entry points with our advanced ProRealTime indicators. You’ll get efficient buy signals with precise price targets for maximum performance. Start outperforming now!
How do institutions grade them?
The following tables summarize recent institutional grades for Rockwell Automation, Inc. and Symbotic Inc.:
Rockwell Automation, Inc. Grades
The table below shows recent grades and rating actions from major financial institutions.
| Grading Company | Action | New Grade | Date |
|---|---|---|---|
| Oppenheimer | Downgrade | Perform | 2026-01-20 |
| JP Morgan | Maintain | Neutral | 2026-01-16 |
| Morgan Stanley | Maintain | Overweight | 2026-01-13 |
| Barclays | Maintain | Overweight | 2026-01-07 |
| Wells Fargo | Maintain | Equal Weight | 2026-01-07 |
| Goldman Sachs | Upgrade | Neutral | 2025-12-16 |
| Jefferies | Maintain | Buy | 2025-12-10 |
| Citigroup | Maintain | Buy | 2025-12-08 |
| Barclays | Maintain | Overweight | 2025-12-04 |
| Baird | Maintain | Outperform | 2025-11-21 |
Symbotic Inc. Grades
The table below presents recent grades and rating actions from recognized financial firms.
| Grading Company | Action | New Grade | Date |
|---|---|---|---|
| Barclays | Maintain | Underweight | 2026-01-12 |
| Goldman Sachs | Downgrade | Sell | 2025-12-02 |
| Barclays | Maintain | Underweight | 2025-11-26 |
| Baird | Maintain | Neutral | 2025-11-26 |
| DA Davidson | Maintain | Neutral | 2025-11-25 |
| Cantor Fitzgerald | Maintain | Overweight | 2025-11-25 |
| Needham | Maintain | Buy | 2025-11-25 |
| Craig-Hallum | Upgrade | Buy | 2025-11-25 |
| Citigroup | Maintain | Buy | 2025-11-25 |
| Northland Capital Markets | Maintain | Outperform | 2025-11-25 |
Which company has the best grades?
Rockwell Automation holds a stronger consensus with mostly overweight, buy, and outperform ratings. Symbotic shows mixed grades, including underweight and a recent sell. This divergence may influence investor confidence and portfolio positioning.
Risks specific to each company
The following categories identify the critical pressure points and systemic threats facing both firms in the 2026 market environment:
1. Market & Competition
Rockwell Automation, Inc.
- Established market leader with diversified industrial automation segments and strong brand presence.
Symbotic Inc.
- Emerging player focusing on warehouse automation with high growth potential but limited scale and market share.
2. Capital Structure & Debt
Rockwell Automation, Inc.
- Moderate leverage with debt-to-assets at 32.5%, interest coverage favorable at 6.9x, but debt-to-equity score flagged very unfavorable.
Symbotic Inc.
- Very low leverage with debt-to-assets at 1.3%, but zero interest coverage reflects challenges servicing any debt.
3. Stock Volatility
Rockwell Automation, Inc.
- Beta at 1.53 indicates above-market volatility; stock price range wide but less extreme than Symbotic.
Symbotic Inc.
- High beta of 2.14 signals high volatility; stock price swings are more pronounced, reflecting growth-stage risks.
4. Regulatory & Legal
Rockwell Automation, Inc.
- Operates globally with exposure to industrial regulations; long history suggests experienced compliance management.
Symbotic Inc.
- Newer company with less regulatory track record; potential risks in rapidly evolving automation technology standards.
5. Supply Chain & Operations
Rockwell Automation, Inc.
- Extensive supply chain across multiple industries, benefiting from scale but vulnerable to global disruptions.
Symbotic Inc.
- Focused on U.S. warehouse automation with smaller supply chain, but higher operational risk due to concentrated customer base.
6. ESG & Climate Transition
Rockwell Automation, Inc.
- Increasing ESG initiatives aligned with industrial sustainability trends; legacy operations require ongoing modernization.
Symbotic Inc.
- Positioned as a technology innovator with potential ESG advantages but lacks long-term ESG reporting history.
7. Geopolitical Exposure
Rockwell Automation, Inc.
- Broad international footprint exposes it to geopolitical tensions and trade risks.
Symbotic Inc.
- Primarily U.S.-focused, limiting geopolitical exposure but also growth opportunities abroad.
Which company shows a better risk-adjusted profile?
Rockwell Automation’s key risk lies in its moderate leverage and elevated valuation multiples, which could pressure returns in a tightening capital environment. Symbotic’s greatest risk is its unprofitable operations and high stock volatility, reflecting execution uncertainty. I see Rockwell as having a better risk-adjusted profile due to its strong profitability, solid Altman Z-Score (5.6, safe zone), and very strong Piotroski Score (8). Symbotic’s financial distress signals and weak Piotroski Score (3) underscore higher operational risk. The widening valuation gap and Symbotic’s negative margins justify caution despite its innovative niche.
Final Verdict: Which stock to choose?
Rockwell Automation’s superpower lies in its resilient value creation and operational efficiency, demonstrated by a strong and growing ROIC well above its cost of capital. Its point of vigilance is the elevated valuation multiples, which could temper near-term upside. It suits investors focused on steady growth with a tolerance for premium pricing in industrial automation.
Symbotic’s strategic moat is its innovative technology platform targeting supply chain automation, supported by rapid revenue growth and improving free cash flow yield. However, its negative profitability and declining ROIC signal elevated execution risks. It fits well within portfolios aiming for high-growth exposure with a willingness to accept financial volatility.
If you prioritize durable value creation and operational strength, Rockwell Automation outshines as the compelling choice due to its sustainable competitive advantage and financial resilience. However, if you seek aggressive growth and technology-driven upside, Symbotic offers superior growth potential but with significantly higher risk. Each presents a distinct analytical scenario aligned with different risk-return appetites.
Disclaimer: Investment carries a risk of loss of initial capital. The past performance is not a reliable indicator of future results. Be sure to understand risks before making an investment decision.
Go Further
I encourage you to read the complete analyses of Rockwell Automation, Inc. and Symbotic Inc. to enhance your investment decisions: