Home > Comparison > Industrials > ROP vs ROK
The strategic rivalry between Roper Technologies, Inc. and Rockwell Automation, Inc. shapes the industrial machinery sector’s future. Roper operates as a diversified software and engineered products provider, while Rockwell focuses on industrial automation and digital transformation solutions. This head-to-head reflects a contest between broad technological integration and specialized automation leadership. This analysis aims to identify which company presents a superior risk-adjusted outlook for inclusion in a diversified portfolio.
Table of contents
Companies Overview
Roper Technologies and Rockwell Automation lead innovation in industrial machinery with robust revenue streams and strategic shifts in 2026.
Roper Technologies, Inc.: Diverse Industrial Solutions Powerhouse
Roper Technologies dominates the industrial machinery sector by designing and developing software and engineered products across various niches. Its core revenue comes from cloud-based software for financial, insurance, and healthcare industries alongside precision instruments and sensors. In 2026, Roper focuses on expanding its digital analytics and cloud software capabilities, reinforcing its cross-industry technological footprint.
Rockwell Automation, Inc.: Industrial Automation and Digital Transformation Leader
Rockwell Automation leads by providing integrated industrial automation and digital transformation solutions worldwide. It generates revenue through intelligent devices, software and control systems, and lifecycle services targeting discrete, hybrid, and process markets. The company’s 2026 strategy emphasizes enhancing its software & control offerings and expanding consulting services to drive digital adoption in manufacturing and infrastructure.
Strategic Collision: Similarities & Divergences
Both companies prioritize technological innovation but differ in approach: Roper embraces a broad industrial software portfolio, while Rockwell centers on automation and digital transformation for manufacturing. Their primary battleground lies in industrial software and control solutions. Investors will note Roper’s diverse, software-heavy model contrasts with Rockwell’s focused, hardware-software integration, shaping distinct risk and growth profiles.
Income Statement Comparison
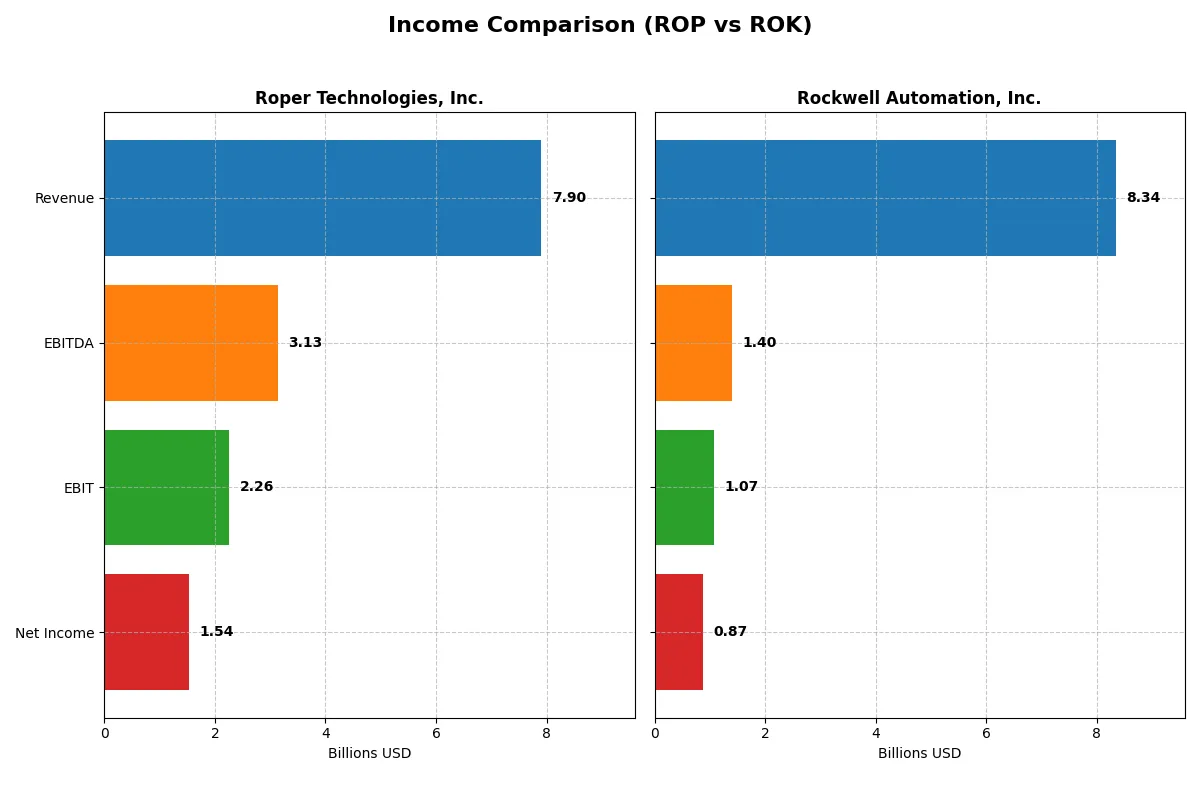
This table dissects the core profitability and scalability of both corporate engines to reveal who dominates the bottom line:
| Metric | Roper Technologies, Inc. (ROP) | Rockwell Automation, Inc. (ROK) |
|---|---|---|
| Revenue | 7.9B | 8.3B |
| Cost of Revenue | 2.43B | 4.33B |
| Operating Expenses | 3.24B | 2.59B |
| Gross Profit | 5.47B | 4.02B |
| EBITDA | 3.13B | 1.40B |
| EBIT | 2.26B | 1.07B |
| Interest Expense | 325M | 156M |
| Net Income | 1.54B | 867M |
| EPS | 14.31 | 7.69 |
| Fiscal Year | 2025 | 2025 |
Income Statement Analysis: The Bottom-Line Duel
This income statement comparison reveals the true operational efficiency and profitability dynamics of two industrial leaders.
Roper Technologies, Inc. Analysis
Roper Technologies grows revenue from $4.8B in 2021 to $7.9B in 2025, with net income rising from $1.1B to $1.5B. Its gross margin remains strong above 69%, and net margin holds near 19%, signaling robust profitability. In 2025, modest EBIT growth contrasts with slight net margin compression, reflecting controlled expenses amid expansion.
Rockwell Automation, Inc. Analysis
Rockwell Automation’s revenue edges up from $7.0B in 2021 to $8.3B in 2025, but net income declines from $1.4B to $870M. Gross margin hovers around 48%, with net margin near 10%, indicating lower profitability than Roper. The latest year shows shrinking EBIT and net margins, highlighting pressure on cost efficiency and profitability momentum.
Margin Strength vs. Revenue Scale
Roper clearly leads in profitability margins and net income growth, outperforming Rockwell despite a smaller revenue base. Rockwell’s revenue scale is larger but lacks margin strength, resulting in declining earnings. For investors prioritizing durable profit growth and operational efficiency, Roper’s profile stands out as the more compelling fundamental story.
Financial Ratios Comparison
These vital ratios act as a diagnostic tool to expose the underlying fiscal health, valuation premiums, and capital efficiency of the companies compared below:
| Ratios | Roper Technologies, Inc. (ROP) | Rockwell Automation, Inc. (ROK) |
|---|---|---|
| ROE | 7.7% | 23.8% |
| ROIC | 5.6% | 13.7% |
| P/E | 31.1 | 45.3 |
| P/B | 2.40 | 10.78 |
| Current Ratio | 0.52 | 1.14 |
| Quick Ratio | 0.48 | 0.77 |
| D/E | 0.47 | 1.00 |
| Debt-to-Assets | 27.0% | 32.5% |
| Interest Coverage | 6.88 | 9.12 |
| Asset Turnover | 0.23 | 0.74 |
| Fixed Asset Turnover | 50.37 | 6.95 |
| Payout ratio | 23.1% | 68.0% |
| Dividend yield | 0.74% | 1.50% |
| Fiscal Year | 2025 | 2025 |
Efficiency & Valuation Duel: The Vital Signs
Financial ratios serve as a company’s DNA, unveiling hidden risks and operational strengths critical for investors’ decisions.
Roper Technologies, Inc.
Roper’s profitability shows a modest 7.7% ROE and strong 19.4% net margin, but its P/E of 31.1 signals an expensive valuation. The firm’s low current ratio at 0.52 raises liquidity concerns. Dividend yield is low at 0.74%, indicating limited shareholder returns, likely favoring reinvestment in intangible assets.
Rockwell Automation, Inc.
Rockwell delivers robust efficiency with a 23.8% ROE and solid 10.4% net margin. Its valuation is stretched, with a P/E ratio of 45.3 and a high P/B of 10.8. The current ratio of 1.14 suggests better liquidity. Dividend yield at 1.5% offers moderate shareholder return amid strong capital returns and growth focus.
Premium Valuation vs. Operational Safety
Rockwell Automation commands higher returns and liquidity but at a premium valuation compared to Roper Technologies. Roper’s conservative valuation with liquidity risks contrasts Rockwell’s efficient but costly profile. Investors favoring growth and operational strength may lean toward Rockwell, while those wary of stretched multiples might consider Roper’s more balanced risk.
Which one offers the Superior Shareholder Reward?
I compare Roper Technologies (ROP) and Rockwell Automation (ROK) through their dividend yields, payout ratios, and buyback intensity. ROP yields 0.74% with a moderate payout ratio near 23%, supported by robust free cash flow coverage above 90%. ROK offers a higher yield around 1.5% but with a payout ratio hitting 68%, signaling greater income focus but tighter cash flow coverage below 90%. ROP’s share buybacks appear more disciplined and sustainable, reflecting its strong operating margins near 28% versus ROK’s 17%. Historically, ROP’s model balances income and growth, while ROK prioritizes income with higher leverage. I conclude ROP provides a more sustainable and attractive total shareholder return profile in 2026.
Comparative Score Analysis: The Strategic Profile
The radar chart reveals the fundamental DNA and trade-offs of Roper Technologies, Inc. and Rockwell Automation, Inc., highlighting key financial strengths and weaknesses across critical metrics:
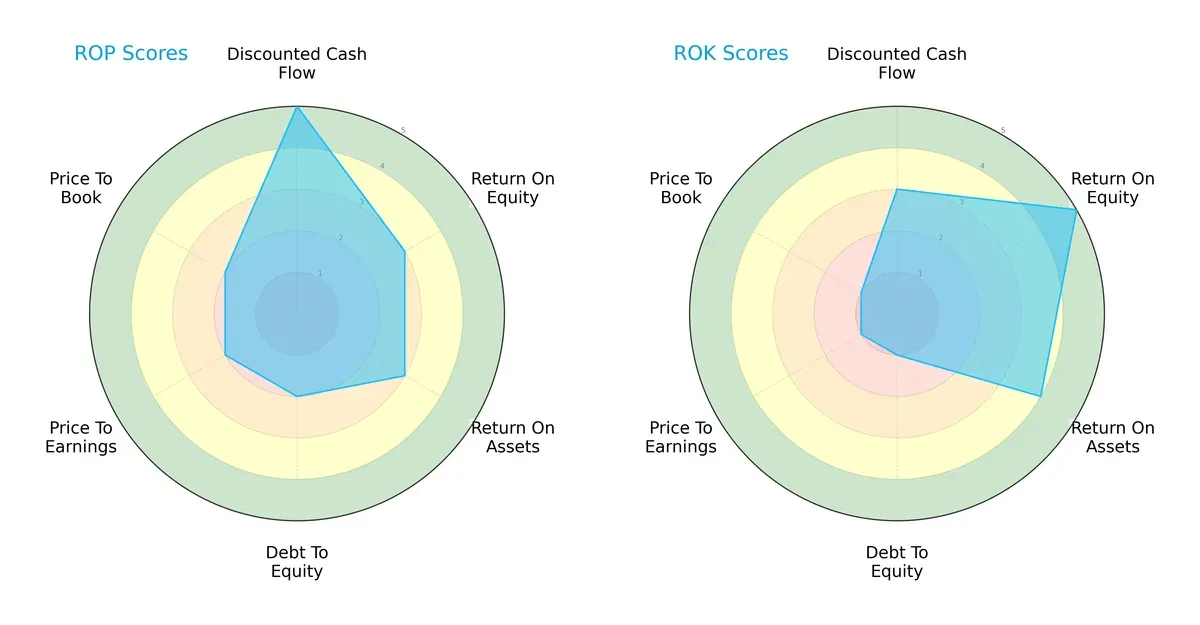
Roper scores highest on discounted cash flow (5) and maintains moderate returns on equity (3) and assets (3), showing a balanced approach. Rockwell excels in profitability with superior ROE (5) and ROA (4) but suffers from a weak debt-to-equity profile (1) and poor valuation scores (1 for P/E and P/B). Roper offers a more balanced profile, while Rockwell relies heavily on operational efficiency despite financial leverage concerns.
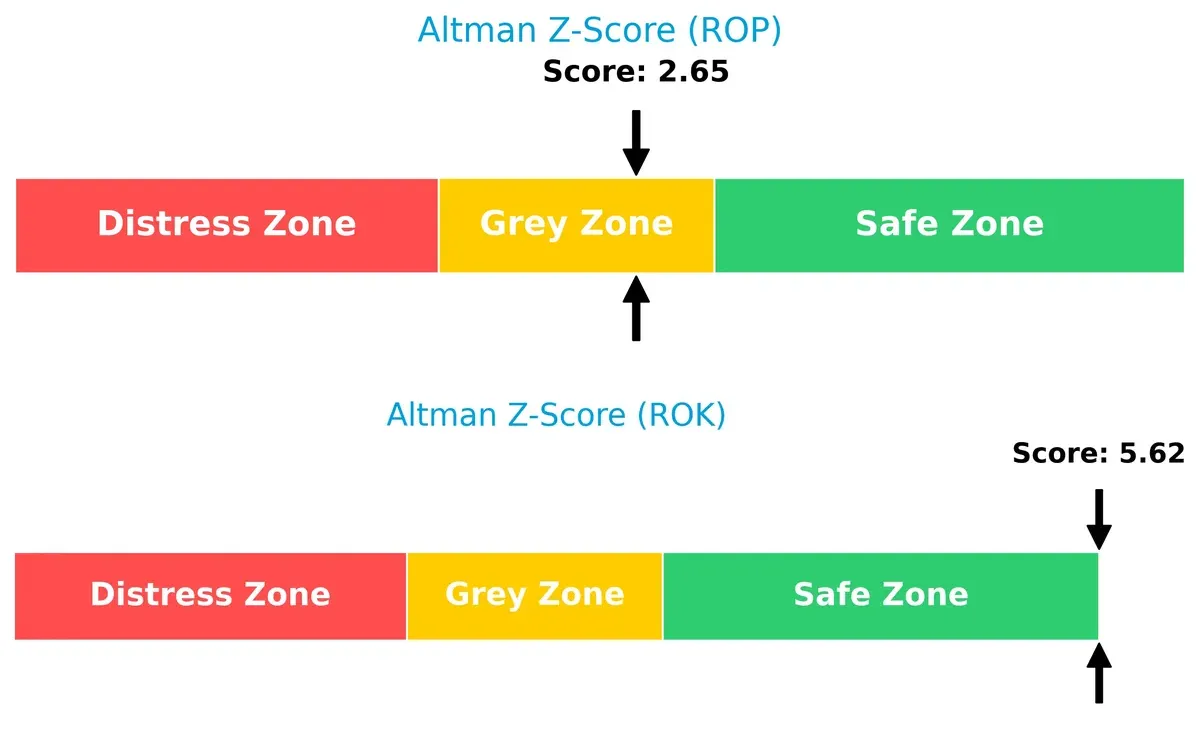
Bankruptcy Risk: Solvency Showdown
Rockwell’s Altman Z-Score (5.62) places it securely in the safe zone, signaling robust long-term solvency. Roper’s score (2.65) falls in the grey zone, indicating moderate bankruptcy risk amid current market cycles:
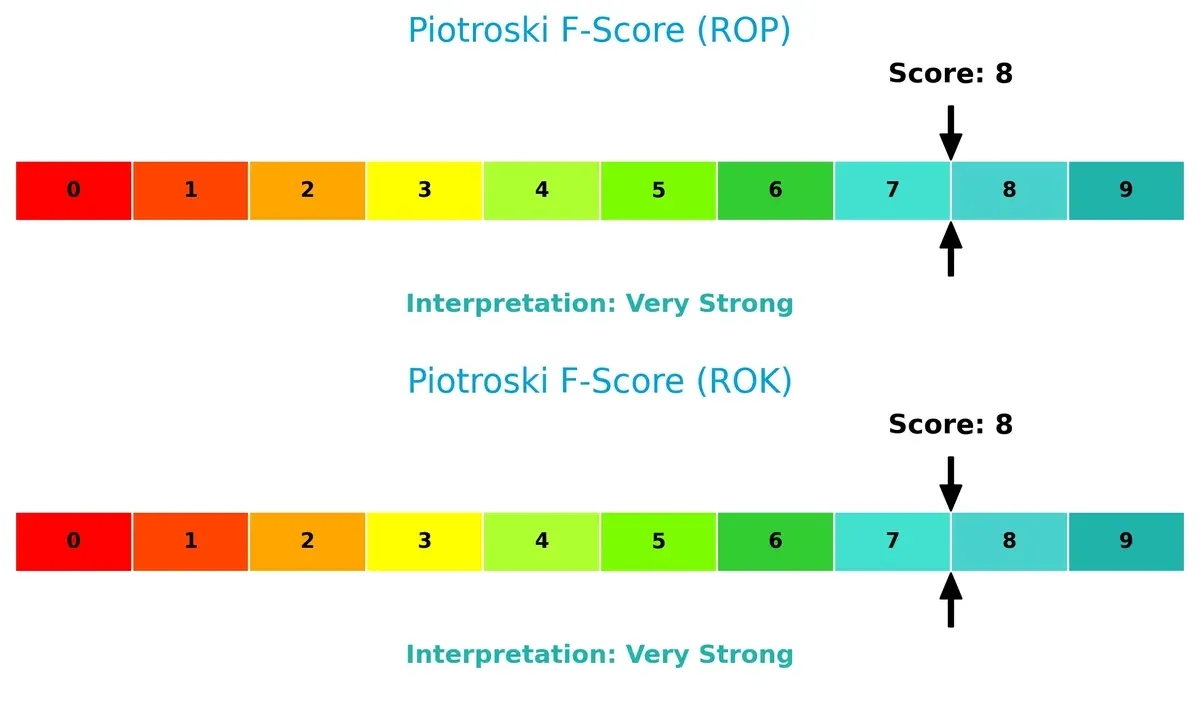
Financial Health: Quality of Operations
Both companies achieve a strong Piotroski F-Score of 8, reflecting excellent financial health and operational quality. Neither shows red flags, suggesting well-managed internal metrics and solid fundamentals:
How are the two companies positioned?
This section dissects the operational DNA of ROP and ROK by comparing their revenue distribution by segment alongside internal strengths and weaknesses. The goal is to confront their economic moats and determine which model delivers the most resilient, sustainable competitive advantage today.
Revenue Segmentation: The Strategic Mix
The following visual comparison dissects how both firms diversify their income streams and where their primary sector bets lie:
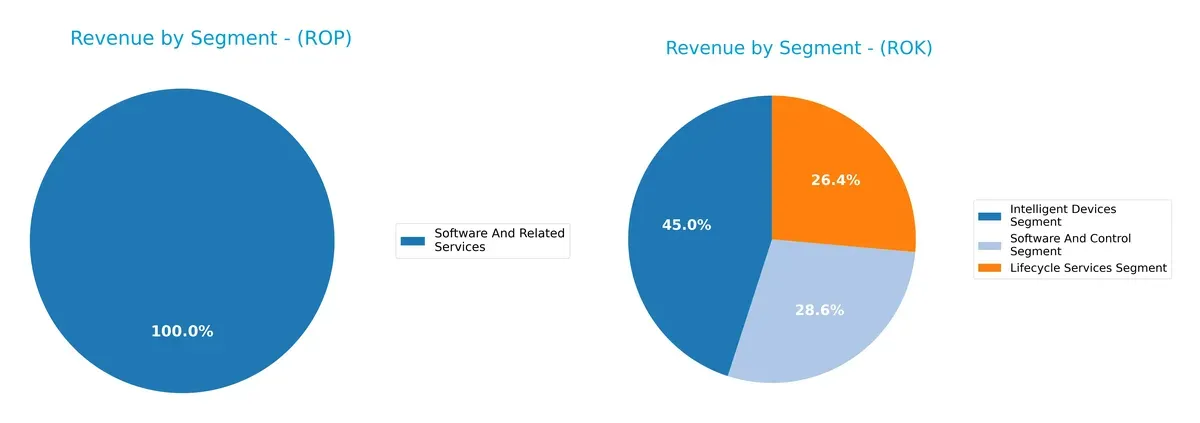
Roper Technologies pivots around its Software and Related Services, generating $10.7B in 2024, but also maintains diversified revenue from Application Software ($3.2B), Network Software ($1.4B), and Technology Products ($1.5B) in 2023. Rockwell Automation anchors its revenue in Intelligent Devices ($3.8B), Lifecycle Services ($2.3B), and Software and Control ($2.2B) for 2024, showing a balanced portfolio. Roper’s software dominance signals strong ecosystem lock-in, while Rockwell’s diversification mitigates concentration risk amid industrial automation trends.
Strengths and Weaknesses Comparison
This table compares the Strengths and Weaknesses of Roper Technologies and Rockwell Automation:
Roper Technologies Strengths
- Diversified software and technology segments with strong US revenue base
- Favorable net margin at 19.44%
- Low debt-to-assets ratio at 26.9%
- Strong interest coverage ratio at 6.96
Rockwell Automation Strengths
- High profitability with ROE at 23.78% and ROIC at 13.71%
- Balanced geographic revenue with strong North America and Asia Pacific presence
- Favorable interest coverage ratio at 6.88
- Consistent revenue from intelligent devices and software segments
Roper Technologies Weaknesses
- Low liquidity with current ratio at 0.52 and quick ratio at 0.48
- ROE below WACC indicating weak capital efficiency
- Unfavorable asset turnover at 0.23
- High PE ratio at 31.06 suggesting stretched valuation
Rockwell Automation Weaknesses
- High PE and PB ratios indicate expensive valuation
- WACC at 10.53% exceeds ROIC, raising cost of capital concerns
- Quick ratio below 1 at 0.77 signals liquidity risk
- Debt-to-assets at 32.51% is higher and less favorable
Both companies show strengths in profitability and interest coverage but face valuation and liquidity challenges. Roper benefits from lower leverage and strong margins, while Rockwell excels in capital returns and global diversification. Each must address liquidity or valuation pressures to optimize capital allocation.
The Moat Duel: Analyzing Competitive Defensibility
A structural moat is the only shield protecting long-term profits from relentless competition erosion. Let’s dissect the moats of two industrial machinery leaders:
Roper Technologies, Inc.: Diversified Innovation Moat
Roper’s moat stems from intangible assets and specialized software ecosystems. This yields high margins (28.6% EBIT) and steady revenue growth (12.3% last year). Expansion into cloud analytics should deepen its moat in 2026.
Rockwell Automation, Inc.: Operational Efficiency Moat
Rockwell’s cost advantage and lifecycle services differentiate it from Roper’s software focus. It sustains strong ROIC growth (+77% trend) and value creation (ROIC > WACC by 3.2%). Digital transformation offerings signal further moat expansion.
Moat Strength Showdown: Innovation Ecosystem vs. Operational Excellence
Rockwell Automation possesses the deeper moat, evidenced by robust ROIC above WACC and accelerating profitability. Roper shows promise but currently sheds value despite improving returns. Rockwell stands better poised to defend and grow market share.
Which stock offers better returns?
The past year reveals contrasting trajectories: Roper Technologies, Inc. (ROP) faces a pronounced decline, while Rockwell Automation, Inc. (ROK) accelerates upward, reflecting divergent market sentiments and trading activity.
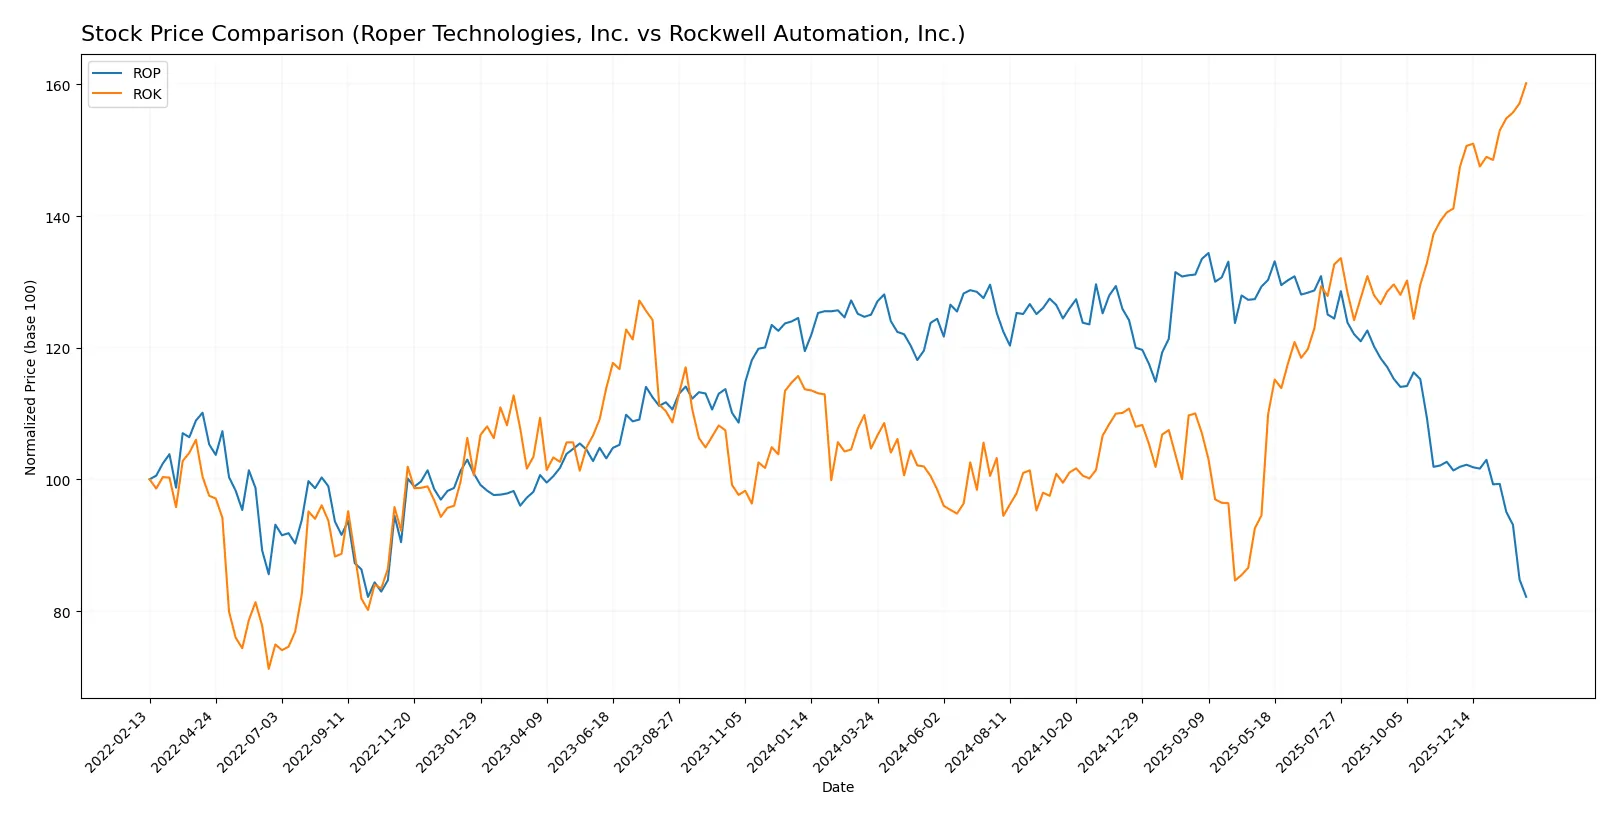
Trend Comparison
ROP’s stock fell 34.28% over the past 12 months, marking a bearish trend with decelerating losses. The price ranged between 588.38 and 359.71, showing high volatility (std deviation 47.92).
ROK surged 53.03% in the same period, exhibiting a bullish trend with accelerating gains. Its price fluctuated from 227.11 to 429.84, supported by strong buyer dominance and significant volume.
ROK outperformed ROP decisively, delivering the highest market returns and sustained upward momentum over the last year.
Target Prices
Analysts project moderate upside potential for Roper Technologies and Rockwell Automation based on current consensus targets.
| Company | Target Low | Target High | Consensus |
|---|---|---|---|
| Roper Technologies, Inc. | 365 | 575 | 475.5 |
| Rockwell Automation, Inc. | 380 | 470 | 421.57 |
Roper’s target consensus exceeds its current price of 360, signaling expected growth. Rockwell’s consensus sits slightly below its current 430 price, suggesting a more cautious outlook.

Don’t Let Luck Decide Your Entry Point
Optimize your entry points with our advanced ProRealTime indicators. You’ll get efficient buy signals with precise price targets for maximum performance. Start outperforming now!
How do institutions grade them?
Roper Technologies, Inc. Grades
Here are the recent grades and rating actions from major institutions for Roper Technologies, Inc.:
| Grading Company | Action | New Grade | Date |
|---|---|---|---|
| Goldman Sachs | Maintain | Neutral | 2026-01-29 |
| Argus Research | Downgrade | Hold | 2026-01-28 |
| Mizuho | Maintain | Underperform | 2026-01-28 |
| RBC Capital | Maintain | Sector Perform | 2026-01-28 |
| Stifel | Downgrade | Hold | 2026-01-28 |
| Citigroup | Maintain | Buy | 2026-01-28 |
| JP Morgan | Maintain | Underweight | 2026-01-28 |
| Truist Securities | Maintain | Buy | 2026-01-28 |
| Barclays | Maintain | Underweight | 2026-01-28 |
| Oppenheimer | Downgrade | Perform | 2026-01-28 |
Rockwell Automation, Inc. Grades
Below are the latest institutional grades and actions for Rockwell Automation, Inc.:
| Grading Company | Action | New Grade | Date |
|---|---|---|---|
| Oppenheimer | Downgrade | Perform | 2026-01-20 |
| JP Morgan | Maintain | Neutral | 2026-01-16 |
| Morgan Stanley | Maintain | Overweight | 2026-01-13 |
| Barclays | Maintain | Overweight | 2026-01-07 |
| Wells Fargo | Maintain | Equal Weight | 2026-01-07 |
| Goldman Sachs | Upgrade | Neutral | 2025-12-16 |
| Jefferies | Maintain | Buy | 2025-12-10 |
| Citigroup | Maintain | Buy | 2025-12-08 |
| Barclays | Maintain | Overweight | 2025-12-04 |
| Baird | Maintain | Outperform | 2025-11-21 |
Which company has the best grades?
Rockwell Automation holds generally stronger grades, including multiple Overweight and Buy ratings. Roper’s grades lean more toward Neutral, Hold, and Underperform. Investors may interpret Rockwell’s higher grades as greater confidence from analysts.
Risks specific to each company
The following categories identify the critical pressure points and systemic threats facing both firms in the 2026 market environment:
1. Market & Competition
Roper Technologies, Inc.
- Operates in diverse software and engineered products, competing in niche tech-driven industrial segments.
Rockwell Automation, Inc.
- Focuses on industrial automation and digital transformation, facing intense competition in hardware and software sectors.
2. Capital Structure & Debt
Roper Technologies, Inc.
- Debt-to-equity ratio at 0.47 signals moderate leverage with favorable interest coverage of 6.96x.
Rockwell Automation, Inc.
- Debt-to-equity at 1.0 indicates higher leverage risk, though interest coverage remains strong at 6.88x.
3. Stock Volatility
Roper Technologies, Inc.
- Beta of 0.93 suggests lower volatility than the market, offering relative stability.
Rockwell Automation, Inc.
- Beta of 1.53 points to higher stock volatility, increasing investment risk amid market swings.
4. Regulatory & Legal
Roper Technologies, Inc.
- Faces typical industrial and software compliance risks but no major regulatory red flags reported.
Rockwell Automation, Inc.
- Exposure to multiple end markets may increase regulatory complexity and legal scrutiny globally.
5. Supply Chain & Operations
Roper Technologies, Inc.
- Diverse product lines may buffer supply disruptions but complexity remains a challenge.
Rockwell Automation, Inc.
- Heavy reliance on global industrial supply chains exposes firm to operational risks and delays.
6. ESG & Climate Transition
Roper Technologies, Inc.
- Moderate ESG focus in industrial tech, but limited public disclosures may pose transparency risks.
Rockwell Automation, Inc.
- Increasing emphasis on eco-industrial solutions aligns with climate transition but demands costly investments.
7. Geopolitical Exposure
Roper Technologies, Inc.
- Primarily US-based with moderate international exposure, limiting geopolitical risk.
Rockwell Automation, Inc.
- Broader international footprint exposes company to trade tensions and geopolitical instability.
Which company shows a better risk-adjusted profile?
Roper Technologies’ most impactful risk lies in its weak liquidity position with unfavorable current and quick ratios, signaling potential short-term financial stress. Rockwell Automation’s greatest risk is its elevated leverage combined with high stock volatility, increasing financial and market risk. Despite Roper’s liquidity concerns, its lower beta and moderate debt level offer a more balanced risk profile. Rockwell’s higher ROE and Altman Z-score in a safe zone are positive, but elevated leverage and valuation multiples heighten caution. Recent data shows Roper’s current ratio at 0.52, a red flag for working capital adequacy, reinforcing my concern over short-term risk. Overall, Roper presents a slightly better risk-adjusted profile given its financial stability relative to market fluctuations.
Final Verdict: Which stock to choose?
Roper Technologies, Inc. (ROP) stands out as a cash-generating machine with a robust gross margin and steadily growing profitability. Its Achilles’ heel lies in liquidity constraints, signaling a need for careful cash management. ROP suits investors chasing aggressive growth backed by operational strength but tolerant of balance sheet risks.
Rockwell Automation, Inc. (ROK) commands a strategic moat through its superior capital efficiency and impressive return on equity. It offers a safer harbor with stronger liquidity and more stable financial health compared to ROP. ROK fits well in growth-at-a-reasonable-price portfolios seeking durable competitive advantages and steadier cash flows.
If you prioritize operational cash flow and are comfortable managing liquidity risk, ROP offers compelling growth potential with improving profitability. However, if you seek better stability and a proven value creator, ROK outshines with its sustainable competitive edge and healthier balance sheet. Both present analytical scenarios for distinct investor profiles with different risk appetites.
Disclaimer: Investment carries a risk of loss of initial capital. The past performance is not a reliable indicator of future results. Be sure to understand risks before making an investment decision.
Go Further
I encourage you to read the complete analyses of Roper Technologies, Inc. and Rockwell Automation, Inc. to enhance your investment decisions: