Industrial automation and precision machinery are critical drivers of modern manufacturing, and Rockwell Automation, Inc. (ROK) and Nordson Corporation (NDSN) are two leading players in this space. Both companies offer innovative solutions that enhance production efficiency and product quality, serving overlapping markets with distinct technological approaches. In this article, I will analyze their strengths and strategies to help you decide which company presents the most compelling investment opportunity in 2026.

Table of contents
Companies Overview
I will begin the comparison between Rockwell Automation, Inc. and Nordson Corporation by providing an overview of these two companies and their main differences.
Rockwell Automation Overview
Rockwell Automation, Inc. provides industrial automation and digital transformation solutions globally. Operating through Intelligent Devices, Software & Control, and Lifecycle Services segments, it offers hardware, software, and maintenance services. The company serves diverse industries, including automotive, semiconductors, food and beverage, and oil and gas. Founded in 1903 and headquartered in Milwaukee, Wisconsin, Rockwell has a market cap of $46B and employs 27,000 people.
Nordson Corporation Overview
Nordson Corporation designs and manufactures systems to dispense and control adhesives, coatings, and fluids worldwide. It operates through Industrial Precision Solutions and Advanced Technology Solutions segments, offering automated dispensing, coating, and testing systems across various industries. Established in 1935 and based in Westlake, Ohio, Nordson has a market cap of $14.6B and a workforce of 8,000 employees.
Key similarities and differences
Both companies operate in the industrial machinery sector and serve global markets with specialized equipment and systems. Rockwell focuses broadly on automation and digital transformation across multiple end markets, while Nordson targets fluid dispensing and coating solutions with precision systems. Rockwell’s business is more diversified across software and services, whereas Nordson emphasizes precision dispensing and advanced technology applications.
Income Statement Comparison
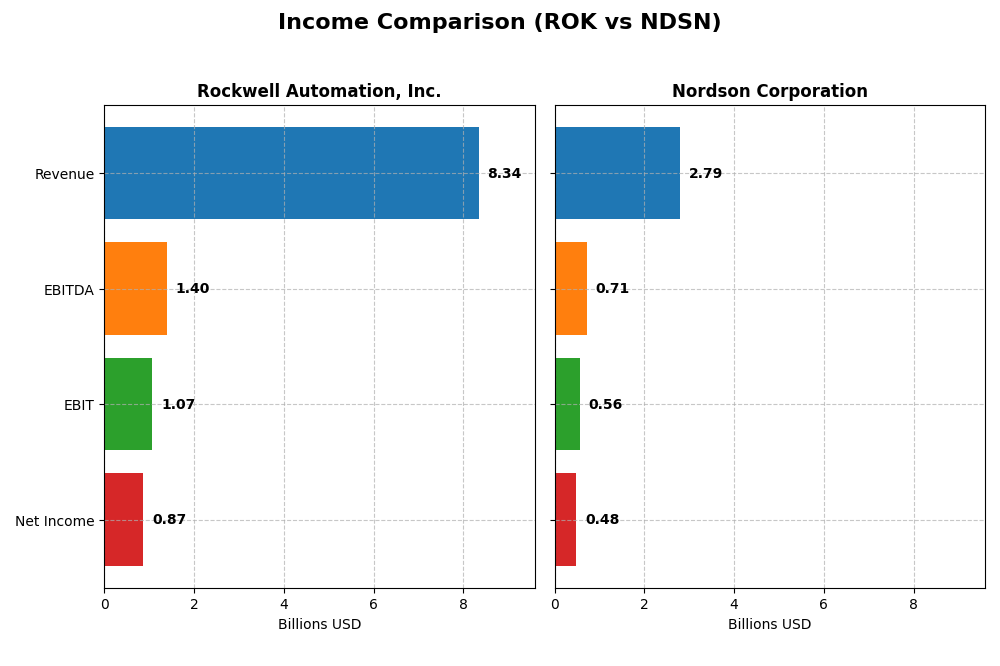
The table below presents a comparison of key income statement metrics for Rockwell Automation, Inc. and Nordson Corporation for the fiscal year 2025.
| Metric | Rockwell Automation, Inc. | Nordson Corporation |
|---|---|---|
| Market Cap | 46.1B | 14.6B |
| Revenue | 8.34B | 2.79B |
| EBITDA | 1.40B | 712M |
| EBIT | 1.07B | 561M |
| Net Income | 869M | 484M |
| EPS | 7.69 | 8.56 |
| Fiscal Year | 2025 | 2025 |
Income Statement Interpretations
Rockwell Automation, Inc.
Rockwell Automation showed a steady revenue growth of 19.22% over 2021-2025 but experienced a net income decline of 36.01% in the same period. Margins such as gross (48.14%) and EBIT (12.86%) remain favorable, though net margin slipped to 10.42%. In 2025, revenue growth slowed to 0.97%, with net income and margins contracting, signaling some recent performance challenges.
Nordson Corporation
Nordson Corporation’s revenue increased 18.18% and net income grew 6.63% over 2021-2025, supported by a strong gross margin of 55.16% and EBIT margin of 20.1%. Despite a slight net margin decline of 9.78% overall, the 2025 results showed moderate revenue growth of 3.78% and improved EPS by 4.93%, reflecting relatively stable profitability and operational efficiency.
Which one has the stronger fundamentals?
Nordson exhibits stronger fundamentals overall, with a higher percentage of favorable income metrics (64.29%) compared to Rockwell’s 42.86%. Nordson’s positive net income growth, solid margins, and EPS improvements contrast with Rockwell’s recent margin deterioration and net income decline, indicating a more consistent income statement performance for Nordson in the analyzed period.
Financial Ratios Comparison
The table below presents a side-by-side comparison of key financial ratios for Rockwell Automation, Inc. (ROK) and Nordson Corporation (NDSN) based on their most recent fiscal year data ending in 2025.
| Ratios | Rockwell Automation, Inc. (ROK) | Nordson Corporation (NDSN) |
|---|---|---|
| ROE | 23.78% | 15.92% |
| ROIC | 13.71% | 10.49% |
| P/E | 45.33 | 27.10 |
| P/B | 10.78 | 4.31 |
| Current Ratio | 1.14 | 1.64 |
| Quick Ratio | 0.77 | 1.05 |
| D/E (Debt-to-Equity) | 1.00 | 0.69 |
| Debt-to-Assets | 32.51% | 35.36% |
| Interest Coverage | 9.12 | 7.04 |
| Asset Turnover | 0.74 | 0.47 |
| Fixed Asset Turnover | 6.95 | 4.70 |
| Payout ratio | 68.01% | 36.96% |
| Dividend yield | 1.50% | 1.36% |
Interpretation of the Ratios
Rockwell Automation, Inc.
Rockwell Automation’s ratios show strengths in profitability with a favorable net margin at 10.42% and a robust return on equity of 23.78%. However, valuation metrics such as a high P/E of 45.33 and price-to-book at 10.78 raise concerns. Liquidity ratios are mixed, with a neutral current ratio but an unfavorable quick ratio. The dividend yield stands at 1.5%, supported by a stable payout, indicating moderate shareholder returns without excessive risk.
Nordson Corporation
Nordson exhibits stronger profitability ratios, including a 17.35% net margin and a 15.92% return on equity, paired with a favorable current and quick ratio signaling good liquidity. Valuation multiples like P/E of 27.1 and P/B of 4.31 are less demanding than Rockwell’s but still flagged as unfavorable. The dividend yield of 1.36% is steady, reflecting consistent returns, while operational efficiency ratios show some weaknesses, such as a less favorable asset turnover.
Which one has the best ratios?
Nordson holds a slight edge in profitability and liquidity, with half of its ratios rated favorable and fewer unfavorable scores compared to Rockwell Automation. Rockwell posts higher returns on equity but faces valuation and liquidity challenges. Both companies receive a slightly favorable global opinion, making the choice dependent on investor priorities between profitability, valuation, and liquidity.
Strategic Positioning
This section compares the strategic positioning of Rockwell Automation, Inc. and Nordson Corporation, including Market position, Key segments, and exposure to disruption:
Rockwell Automation, Inc.
- Leading industrial automation player facing moderate competitive pressure in diverse global markets.
- Operates three segments: Intelligent Devices, Software & Control, and Lifecycle Services driving growth.
- Exposed to digital transformation trends and innovation in industrial automation and software controls.
Nordson Corporation
- Mid-sized industrial machinery firm with competition in adhesive and coating systems markets.
- Focuses on Industrial Precision Solutions and Advanced Technology Solutions with medical fluids segment.
- Faces technological shifts in precision dispensing and automated coating technologies.
Rockwell Automation, Inc. vs Nordson Corporation Positioning
Rockwell Automation pursues a diversified strategy across hardware, software, and services in multiple end markets, while Nordson concentrates on precision dispensing and coating systems. Rockwell’s broader segments provide wider exposure but may increase complexity; Nordson’s narrower focus offers specialization but less market breadth.
Which has the best competitive advantage?
Rockwell Automation demonstrates a very favorable moat with growing ROIC and strong value creation, indicating a durable competitive advantage. Nordson also creates value but with a declining ROIC trend, suggesting a less robust competitive position.
Stock Comparison
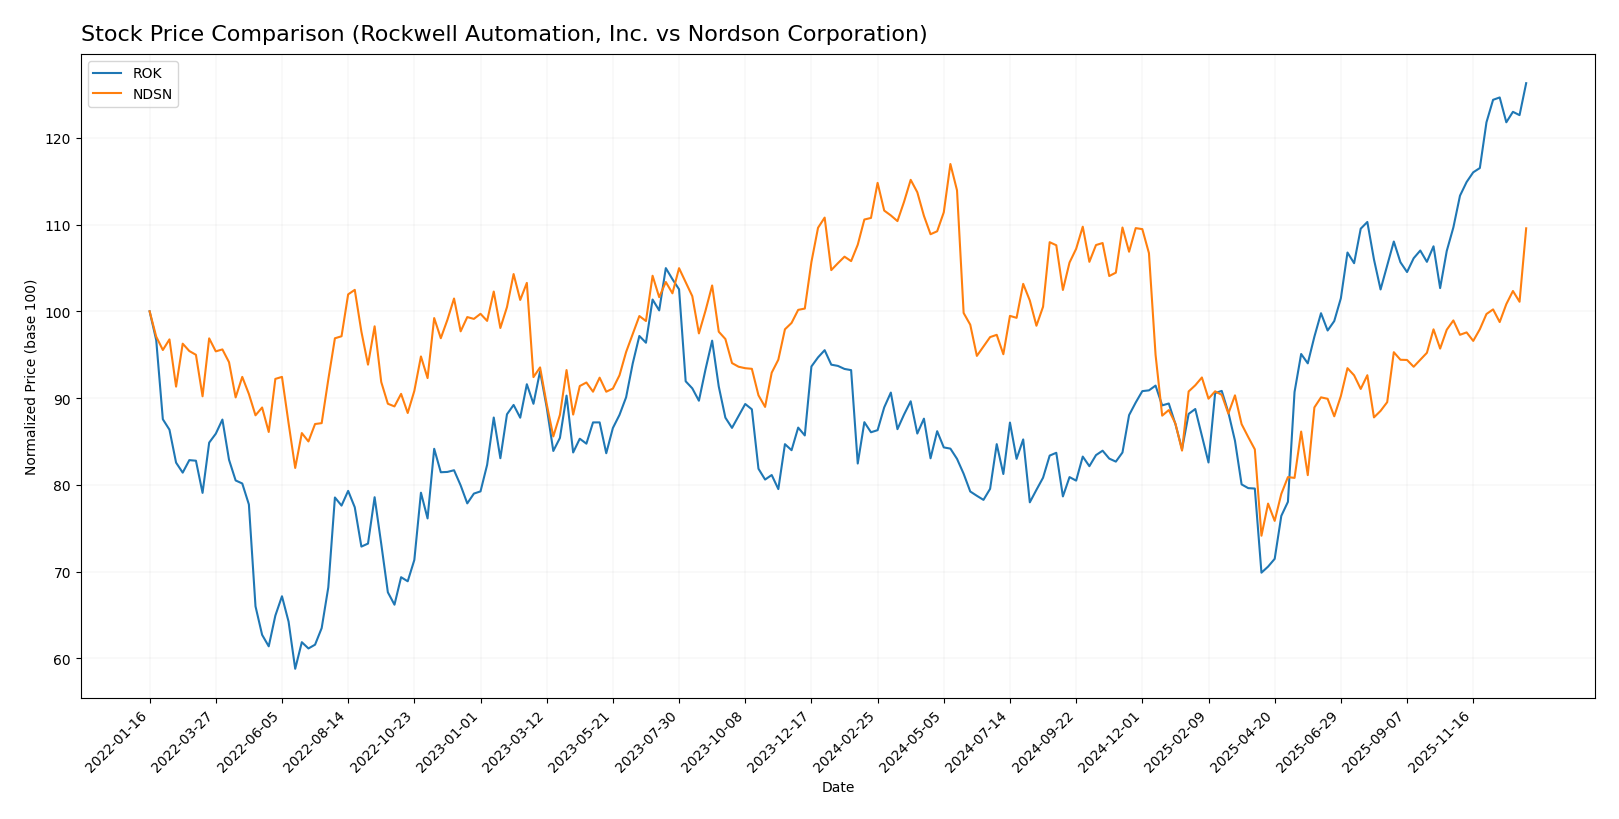
The stock price chart over the past 12 months highlights significant growth for Rockwell Automation, Inc., with notable acceleration, while Nordson Corporation’s price remained largely stable, reflecting different trading dynamics and volatility profiles.
Trend Analysis
Rockwell Automation, Inc. (ROK) experienced a bullish trend over the past year, with a 46.76% price increase and accelerating momentum. The stock showed high volatility, ranging from a low of 227.11 to a high of 410.53.
Nordson Corporation (NDSN) showed a bearish trend with a slight 1.08% price decline over the same period, despite acceleration. The stock’s price fluctuated between 176.73 and 278.89, indicating moderate volatility.
Comparing both, Rockwell Automation delivered the highest market performance, outperforming Nordson significantly in price appreciation and trend strength over the past year.
Target Prices
The current analyst consensus reveals moderate upside potential for both Rockwell Automation, Inc. and Nordson Corporation.
| Company | Target High | Target Low | Consensus |
|---|---|---|---|
| Rockwell Automation, Inc. | 470 | 380 | 421.57 |
| Nordson Corporation | 295 | 240 | 274.17 |
Analysts expect Rockwell Automation’s stock to modestly exceed its current price of 410.53 USD, while Nordson’s target consensus of 274.17 USD suggests a slight upside from today’s 261.22 USD.
Analyst Opinions Comparison
This section compares analysts’ ratings and grades for Rockwell Automation, Inc. (ROK) and Nordson Corporation (NDSN):
Rating Comparison
ROK Rating
- Rating: B-, considered very favorable by analysts.
- Discounted Cash Flow Score: Moderate score of 3, indicating neutral valuation prospects.
- ROE Score: High score of 5, very favorable for profitability from shareholders’ equity.
- ROA Score: Favorable score of 4, reflecting efficient asset utilization.
- Debt To Equity Score: Very unfavorable score of 1, indicating higher financial risk.
- Overall Score: Moderate score of 3, reflecting a balanced but cautious overall assessment.
NDSN Rating
- Rating: B, also considered very favorable by analysts.
- Discounted Cash Flow Score: Moderate score of 3, showing similar valuation outlook.
- ROE Score: Favorable score of 4, indicating good profitability but slightly lower than ROK.
- ROA Score: Favorable score of 4, on par with ROK in asset efficiency.
- Debt To Equity Score: Moderate score of 2, suggesting better financial stability than ROK.
- Overall Score: Moderate score of 3, same overall financial standing as ROK.
Which one is the best rated?
Based strictly on the data, NDSN holds a slightly better overall rating (B vs B-) and a more favorable debt-to-equity score, indicating lower financial risk. However, ROK leads in return on equity, showing stronger profitability from shareholders’ capital. Both have moderate overall scores.
Scores Comparison
Here is a comparison of the financial health scores for Rockwell Automation and Nordson Corporation:
ROK Scores
- Altman Z-Score: 5.32, indicating a safe zone with low bankruptcy risk.
- Piotroski Score: 8, classified as very strong financial health.
NDSN Scores
- Altman Z-Score: 4.90, also in the safe zone with low bankruptcy risk.
- Piotroski Score: 7, classified as strong financial health.
Which company has the best scores?
Based on the provided scores, Rockwell Automation has a higher Altman Z-Score and Piotroski Score than Nordson Corporation, indicating comparatively stronger financial health and lower bankruptcy risk.
Grades Comparison
Here is a comparison of the latest reliable grades for Rockwell Automation, Inc. and Nordson Corporation:
Rockwell Automation, Inc. Grades
The following table shows recent grades assigned by established financial institutions for Rockwell Automation, Inc.:
| Grading Company | Action | New Grade | Date |
|---|---|---|---|
| Wells Fargo | Maintain | Equal Weight | 2026-01-07 |
| Barclays | Maintain | Overweight | 2026-01-07 |
| Goldman Sachs | Upgrade | Neutral | 2025-12-16 |
| Jefferies | Maintain | Buy | 2025-12-10 |
| Citigroup | Maintain | Buy | 2025-12-08 |
| Barclays | Maintain | Overweight | 2025-12-04 |
| Baird | Maintain | Outperform | 2025-11-21 |
| B of A Securities | Maintain | Buy | 2025-11-20 |
| JP Morgan | Maintain | Neutral | 2025-11-11 |
| Morgan Stanley | Maintain | Overweight | 2025-11-10 |
Overall, Rockwell Automation’s grades show a consensus leaning towards Hold to Buy, with multiple firms maintaining Overweight and Buy ratings, and a recent upgrade from Sell to Neutral by Goldman Sachs.
Nordson Corporation Grades
The table below lists recent grades from reputable financial analysts for Nordson Corporation:
| Grading Company | Action | New Grade | Date |
|---|---|---|---|
| DA Davidson | Maintain | Buy | 2025-12-12 |
| Baird | Maintain | Neutral | 2025-12-12 |
| DA Davidson | Maintain | Buy | 2025-12-11 |
| Keybanc | Maintain | Overweight | 2025-12-11 |
| Oppenheimer | Maintain | Outperform | 2025-08-25 |
| Baird | Maintain | Neutral | 2025-08-22 |
| Keybanc | Maintain | Overweight | 2025-07-15 |
| Baird | Maintain | Neutral | 2025-05-30 |
| Oppenheimer | Upgrade | Outperform | 2025-05-30 |
| Keybanc | Maintain | Overweight | 2025-04-08 |
Nordson exhibits a stronger consensus with multiple Buy and Overweight ratings maintained, alongside upgrades to Outperform, indicating positive analyst sentiment.
Which company has the best grades?
Nordson Corporation has received generally higher grades, including several Buy and Outperform ratings, compared to Rockwell Automation’s mix of Hold, Neutral, and Buy ratings. This suggests Nordson may be viewed as having stronger growth potential or analyst confidence, which could influence investors seeking more favorable outlooks.
Strengths and Weaknesses
Below is a comparative overview of the key strengths and weaknesses of Rockwell Automation, Inc. (ROK) and Nordson Corporation (NDSN) based on recent financial and operational data.
| Criterion | Rockwell Automation, Inc. (ROK) | Nordson Corporation (NDSN) |
|---|---|---|
| Diversification | Diversified across Intelligent Devices, Lifecycle Services, and Software & Control segments, balancing product and service revenues. | Diversified in Advanced Technology Systems, Industrial Precision Solutions, and Medical & Fluid Solutions, with strong industrial exposure. |
| Profitability | Strong profitability with a net margin of 10.42% and ROIC of 13.71%, indicating efficient capital use and value creation. | Higher net margin at 17.35% and solid ROIC of 10.49%, though with a declining ROIC trend, signaling some pressure on profitability. |
| Innovation | Demonstrates durable competitive advantage with growing ROIC and strong investment in software and control technologies. | Innovation present but with a declining ROIC trend, suggesting challenges in maintaining profitability through innovation. |
| Global presence | Well-established global reach with broad industrial automation footprint. | Good global presence focused on precision and medical systems, but smaller scale than ROK. |
| Market Share | Leading market share in industrial automation and control systems. | Niche market leader in adhesive dispensing and precision solutions, with moderate market share. |
Key takeaways: Rockwell Automation exhibits a very favorable economic moat with growing profitability and diversification, supporting a durable competitive advantage. Nordson is creating value but faces a declining profitability trend, warranting cautious monitoring despite its solid niche positioning and favorable margins.
Risk Analysis
Below is a comparative table of key risks for Rockwell Automation, Inc. (ROK) and Nordson Corporation (NDSN) in 2026:
| Metric | Rockwell Automation, Inc. (ROK) | Nordson Corporation (NDSN) |
|---|---|---|
| Market Risk | High beta (1.52) implies higher volatility | Moderate beta (1.03) suggests average market sensitivity |
| Debt level | Debt-to-equity neutral at 1.0; moderate leverage | Debt-to-equity moderate at 0.69; moderate leverage |
| Regulatory Risk | Moderate, industrial sector subject to evolving safety/environmental laws | Moderate, with exposure to precision manufacturing regulations |
| Operational Risk | Medium; diversified segments but supply chain disruptions possible | Medium; specialized products may face production bottlenecks |
| Environmental Risk | Moderate; exposure to eco-industrial markets with sustainability demands | Moderate; must comply with environmental standards for chemicals and coatings |
| Geopolitical Risk | Moderate; global sales expose to trade tensions | Moderate; international operations sensitive to geopolitical shifts |
Rockwell Automation’s higher market volatility and debt-equity ratio warrant caution. Both companies face moderate regulatory and environmental risks due to their industrial focus. The most impactful risk remains market sensitivity for ROK and operational continuity for both firms amid global uncertainties.
Which Stock to Choose?
Rockwell Automation, Inc. (ROK) shows a mixed income evolution with favorable margins but declining net income and EPS over 2021-2025. Its financial ratios are slightly favorable, highlighted by strong profitability and a robust return on equity of 23.78%, moderate debt levels, and a very favorable overall rating of B-. The company demonstrates a very favorable moat with a growing ROIC well above WACC, indicating durable competitive advantage.
Nordson Corporation (NDSN) presents a favorable income trend overall, with growth in net income and EPS despite a recent slight margin contraction. Its financial ratios are slightly favorable with strong net margin at 17.35%, moderate profitability, and manageable debt. The rating is very favorable at B, supported by a slightly favorable moat showing value creation but declining ROIC, suggesting some erosion in profitability.
The choice between these stocks might depend on investor profile: those prioritizing durable profitability and competitive moat could find ROK more appealing, while investors valuing consistent income growth and moderate financial risk might view NDSN more favorably given its stable rating and income statement. Both present slightly favorable financial ratios but differ in ROIC trends and debt profiles, which could influence risk tolerance and investment strategy.
Disclaimer: Investment carries a risk of loss of initial capital. The past performance is not a reliable indicator of future results. Be sure to understand risks before making an investment decision.
Go Further
I encourage you to read the complete analyses of Rockwell Automation, Inc. and Nordson Corporation to enhance your investment decisions: