In the dynamic world of industrial machinery, Rockwell Automation, Inc. (ROK) and JBT Marel Corporation (JBTM) stand out as key players driving innovation and operational excellence. Both companies operate in overlapping markets, offering advanced automation and technology solutions that transform manufacturing and processing industries. This comparison will help investors identify which company presents the most compelling opportunity for growth and stability in their portfolio. Let’s explore which stock deserves your attention.

Table of contents
Companies Overview
I will begin the comparison between Rockwell Automation and JBT Marel by providing an overview of these two companies and their main differences.
Rockwell Automation Overview
Rockwell Automation, Inc. focuses on industrial automation and digital transformation solutions globally. Operating through three segments—Intelligent Devices, Software & Control, and Lifecycle Services—it offers hardware, software, and consulting services. Serving diverse markets such as automotive, semiconductor, and eco-industrial sectors, Rockwell is a leader in industrial technology with a market cap of approximately 46B USD and 27,000 employees.
JBT Marel Overview
JBT Marel Corporation delivers technology solutions primarily to the food and beverage industry worldwide. Its offerings include processing, packaging, and automated material handling systems, covering various sectors like baby food, pharmaceuticals, and fast-moving consumer goods. With a market capitalization near 8.1B USD and around 11,700 employees, JBT Marel emphasizes value-added processing and automation across multiple global regions.
Key similarities and differences
Both companies operate within the industrial machinery sector and provide technology-driven solutions, yet their focus diverges significantly. Rockwell Automation targets broad industrial automation and digital transformation across multiple discrete and process industries. In contrast, JBT Marel specializes in food and beverage processing technology and packaging, with additional automation in material handling. Their scale and market capitalization also differ substantially, reflecting their distinct market positions.
Income Statement Comparison
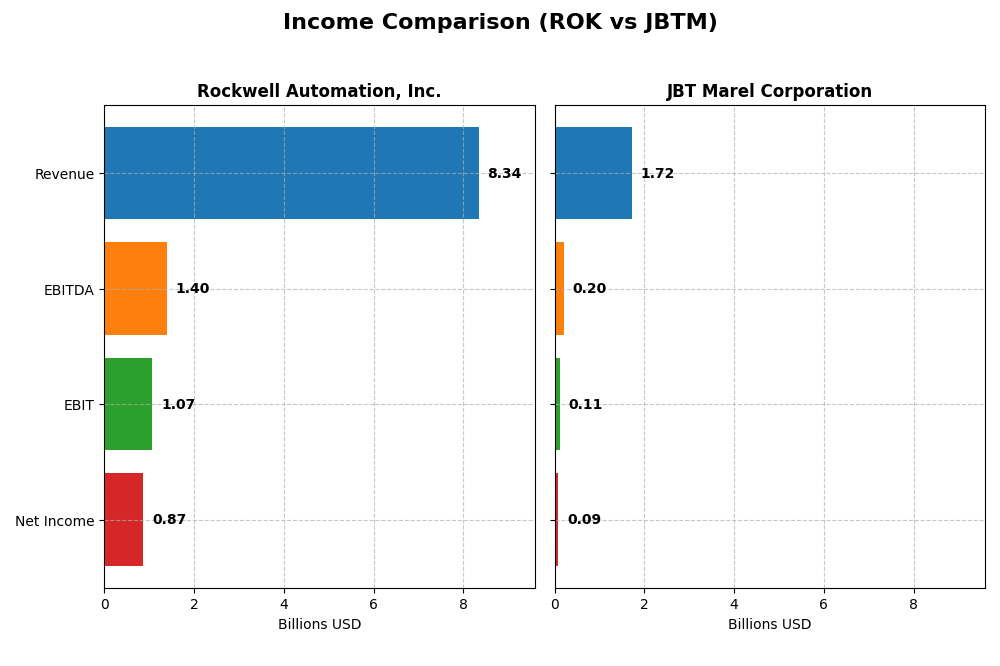
The table below compares the key income statement metrics for Rockwell Automation, Inc. and JBT Marel Corporation for their most recent fiscal years.
| Metric | Rockwell Automation, Inc. | JBT Marel Corporation |
|---|---|---|
| Market Cap | 46.1B | 8.1B |
| Revenue | 8.34B | 1.72B |
| EBITDA | 1.40B | 204M |
| EBIT | 1.07B | 115M |
| Net Income | 869M | 85.4M |
| EPS | 7.69 | 2.67 |
| Fiscal Year | 2025 | 2024 |
Income Statement Interpretations
Rockwell Automation, Inc.
Rockwell Automation showed a steady revenue increase of 19.22% from 2021 to 2025, though net income declined by 36.01% over the same period. Gross and EBIT margins remained favorable, with gross margin at 48.14% and EBIT margin at 12.86% in 2025. However, recent performance saw revenue growth slow to 0.97%, accompanied by decreases in EBIT and net margins, indicating margin pressure.
JBT Marel Corporation
JBT Marel experienced a slight overall revenue decline of 0.68% from 2020 to 2024, with net income down 21.51%. The gross margin was favorable at 36.51%, but EBIT and net margins were neutral at 6.69% and 4.98%, respectively, in 2024. The latest year showed moderate revenue growth of 3.1% but notable declines in EBIT, net margin, and EPS, reflecting operational challenges.
Which one has the stronger fundamentals?
Rockwell Automation outperforms JBT Marel in terms of margin quality and revenue growth over the medium term, with more favorable gross and EBIT margins. Both companies face net income and margin declines recently, but Rockwell’s higher profitability ratios and larger scale suggest comparatively stronger fundamentals. JBT Marel’s neutral margin stance and smaller scale limit its fundamental strength in this comparison.
Financial Ratios Comparison
Below is a comparison of key financial ratios for Rockwell Automation, Inc. (ROK) and JBT Marel Corporation (JBTM) based on their most recent fiscal year data.
| Ratios | Rockwell Automation, Inc. (ROK) | JBT Marel Corporation (JBTM) |
|---|---|---|
| ROE | 23.78% | 5.53% |
| ROIC | 13.71% | 3.65% |
| P/E | 45.33 | 47.63 |
| P/B | 10.78 | 2.63 |
| Current Ratio | 1.14 | 3.48 |
| Quick Ratio | 0.77 | 3.04 |
| D/E (Debt-to-Equity) | 1.00 | 0.81 |
| Debt-to-Assets | 32.51% | 36.68% |
| Interest Coverage | 9.12 | 6.10 |
| Asset Turnover | 0.74 | 0.50 |
| Fixed Asset Turnover | 6.95 | 7.34 |
| Payout ratio | 68.01% | 15.34% |
| Dividend yield | 1.50% | 0.32% |
Interpretation of the Ratios
Rockwell Automation, Inc.
Rockwell Automation presents a slightly favorable ratio profile with strong net margin (10.42%), ROE (23.78%), and ROIC (13.71%), indicating effective profitability and capital use. However, elevated PE (45.33) and PB (10.78) ratios suggest potential overvaluation risks, and the quick ratio (0.77) signals liquidity concerns. The dividend yield is moderate at 1.5%, supported by consistent payouts and shareholder returns.
JBT Marel Corporation
JBT Marel shows a slightly unfavorable ratio mix with weaker profitability metrics: net margin at 4.98%, ROE at 5.53%, and ROIC at 3.65%, reflecting subdued returns. Although it enjoys a low WACC (7.48%) and solid interest coverage (5.92), a high PE ratio (47.63) and low dividend yield (0.32%) suggest limited income for shareholders. The company maintains high liquidity with a strong quick ratio (3.04).
Which one has the best ratios?
Rockwell Automation has the more favorable ratio profile overall, marked by higher profitability and return metrics despite some valuation and liquidity drawbacks. Conversely, JBT Marel’s weaker profitability and less attractive shareholder returns weigh on its ratios, despite better liquidity and cost of capital measures. Thus, Rockwell Automation’s ratios generally reflect stronger financial health.
Strategic Positioning
This section compares the strategic positioning of Rockwell Automation, Inc. and JBT Marel Corporation, covering Market position, Key segments, and exposure to disruption:
Rockwell Automation, Inc.
- Leading industrial machinery firm with significant market cap and competitive pressure.
- Diversified segments: Intelligent Devices, Software & Control, and Lifecycle Services.
- Exposure to digital transformation and automation technology shaping industrial manufacturing.
JBT Marel Corporation
- Smaller industrial machinery player focused on food and beverage industry, facing moderate competitive pressure.
- Concentrated on food processing technology and automated guided vehicle systems across diverse sectors.
- Exposure mainly to automation in food processing and packaging, with less emphasis on digital transformation.
Rockwell Automation, Inc. vs JBT Marel Corporation Positioning
Rockwell Automation pursues a diversified strategy across multiple industrial sectors and technology layers, offering hardware, software, and services. JBT Marel focuses on specialized food and beverage processing technologies, limiting its diversification but concentrating expertise in its niche.
Which has the best competitive advantage?
Rockwell Automation shows a very favorable economic moat with growing ROIC and value creation, indicating strong competitive advantages. JBT Marel’s declining ROIC and value destruction suggest weaker competitive positioning and financial performance.
Stock Comparison
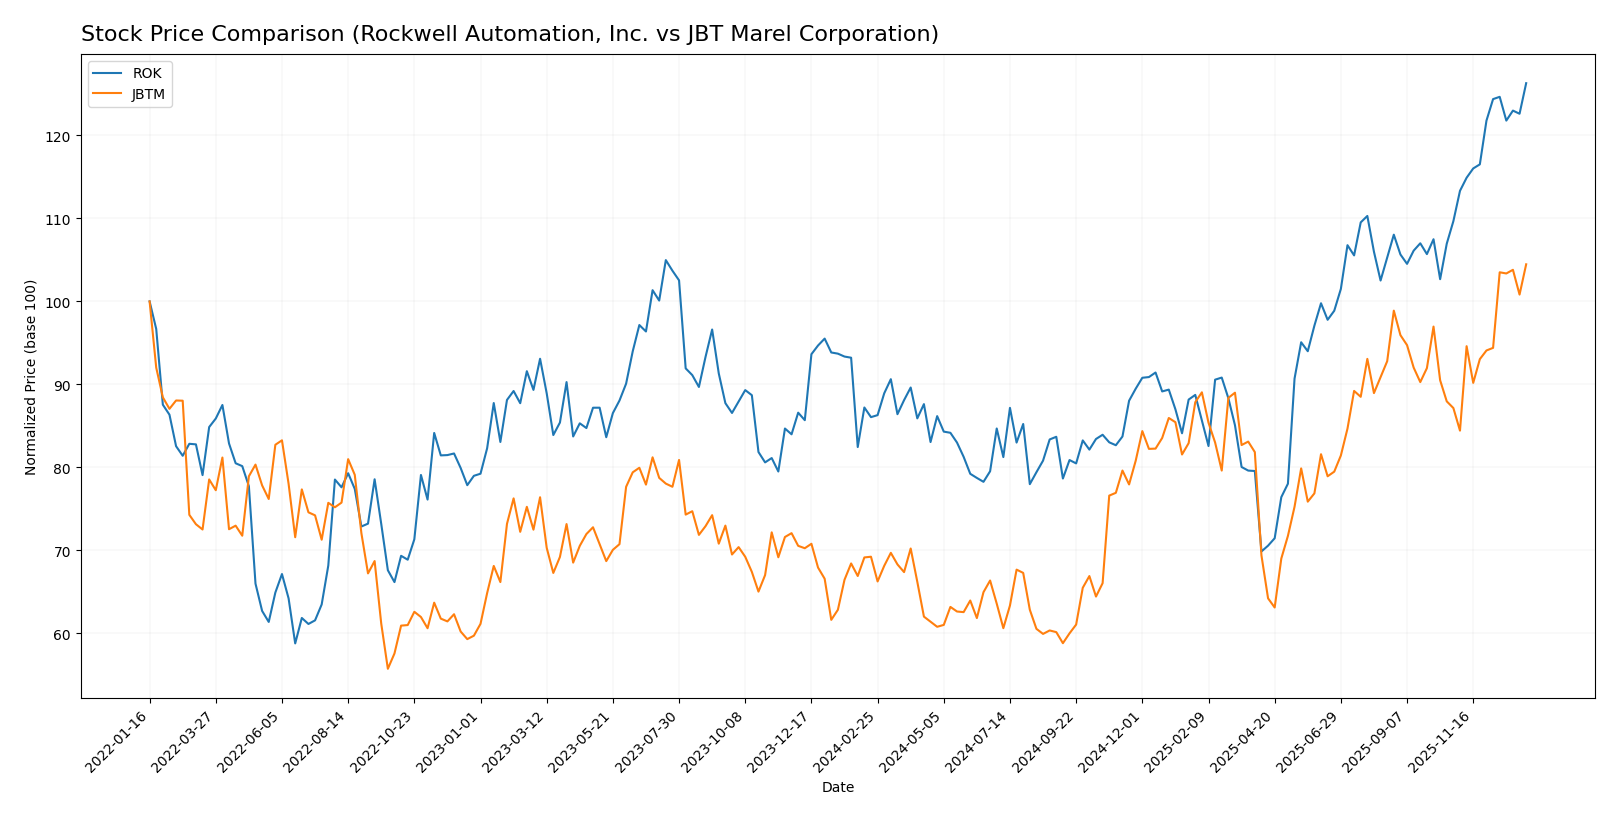
The stock price chart highlights significant bullish movements for both Rockwell Automation, Inc. (ROK) and JBT Marel Corporation (JBTM) over the past 12 months, with notable acceleration phases and volume dynamics shaping their trading patterns.
Trend Analysis
Rockwell Automation, Inc. (ROK) showed a strong bullish trend over the past year with a 46.76% price increase, accelerating upwards from a low of 227.11 to a high of 410.53, despite high volatility (std deviation 44.57). Recent months confirm acceleration with a 15.16% gain.
JBT Marel Corporation (JBTM) also exhibited a bullish trend, outperforming ROK slightly with a 50.89% price rise over the year, marked by acceleration and lower volatility (std deviation 19.24). Recent gains of 19.87% indicate continued upward momentum.
Comparing both, JBTM delivered the highest market performance over the past 12 months, surpassing ROK’s price appreciation with a steadier volatility profile and ongoing positive trend.
Target Prices
The current analyst consensus for target prices reflects moderate upside potential for these industrial machinery companies.
| Company | Target High | Target Low | Consensus |
|---|---|---|---|
| Rockwell Automation, Inc. | 470 | 380 | 421.57 |
| JBT Marel Corporation | 180 | 169 | 174.5 |
Analysts expect Rockwell Automation’s price to rise modestly above its current 410.53 USD, while JBT Marel’s consensus target of 174.5 USD suggests upside from the current 156.04 USD price level.
Analyst Opinions Comparison
This section compares analysts’ ratings and financial scores for Rockwell Automation, Inc. (ROK) and JBT Marel Corporation (JBTM):
Rating Comparison
ROK Rating
- Rating: B-, considered Very Favorable by analysts.
- Discounted Cash Flow Score: 3, indicating a moderate valuation outlook.
- ROE Score: 5, a very favorable measure of profit generation efficiency.
- ROA Score: 4, a favorable indicator of asset utilization effectiveness.
- Debt To Equity Score: 1, very unfavorable, indicating higher financial risk.
- Overall Score: 3, moderate overall financial standing.
JBTM Rating
- Rating: C, considered Very Favorable by analysts.
- Discounted Cash Flow Score: 3, indicating a moderate valuation outlook.
- ROE Score: 1, a very unfavorable measure of profit generation efficiency.
- ROA Score: 1, a very unfavorable indicator of asset utilization effectiveness.
- Debt To Equity Score: 2, moderate, suggesting somewhat better financial risk.
- Overall Score: 2, moderate but lower than ROK’s overall score.
Which one is the best rated?
Based strictly on the provided data, ROK has a higher rating (B- vs. C) and stronger scores in return on equity and assets, despite weaker debt-to-equity. Overall, ROK is better rated than JBTM.
Scores Comparison
The scores comparison between Rockwell Automation and JBT Marel provides insights into their financial health:
ROK Scores
- Altman Z-Score: 5.32, indicating a safe zone with low bankruptcy risk.
- Piotroski Score: 8, categorized as very strong financial health.
JBTM Scores
- Altman Z-Score: 1.75, indicating distress zone with high bankruptcy risk.
- Piotroski Score: 2, categorized as very weak financial health.
Which company has the best scores?
Based strictly on the provided scores, Rockwell Automation exhibits stronger financial health with a safe zone Altman Z-Score and a very strong Piotroski Score, while JBT Marel shows distress signals in both metrics.
Grades Comparison
The following is a comparison of recent grades assigned to Rockwell Automation, Inc. and JBT Marel Corporation by reputable grading companies:
Rockwell Automation, Inc. Grades
This table shows the latest grades from major financial institutions for Rockwell Automation, Inc.:
| Grading Company | Action | New Grade | Date |
|---|---|---|---|
| Wells Fargo | Maintain | Equal Weight | 2026-01-07 |
| Barclays | Maintain | Overweight | 2026-01-07 |
| Goldman Sachs | Upgrade | Neutral | 2025-12-16 |
| Jefferies | Maintain | Buy | 2025-12-10 |
| Citigroup | Maintain | Buy | 2025-12-08 |
| Barclays | Maintain | Overweight | 2025-12-04 |
| Baird | Maintain | Outperform | 2025-11-21 |
| B of A Securities | Maintain | Buy | 2025-11-20 |
| JP Morgan | Maintain | Neutral | 2025-11-11 |
| Morgan Stanley | Maintain | Overweight | 2025-11-10 |
Rockwell Automation’s grades mostly range between Neutral and Buy, with several Overweight and Outperform ratings, indicating a generally positive but cautious sentiment.
JBT Marel Corporation Grades
This table presents recent grades from recognized firms for JBT Marel Corporation:
| Grading Company | Action | New Grade | Date |
|---|---|---|---|
| Jefferies | Upgrade | Buy | 2025-12-10 |
| William Blair | Upgrade | Outperform | 2025-08-06 |
JBT Marel has fewer but notably positive grades, with recent upgrades to Buy and Outperform.
Which company has the best grades?
JBT Marel Corporation has received stronger recent grades, with all ratings upgraded to Buy or better, while Rockwell Automation features a broader mix but leans toward Hold consensus. Investors might interpret JBTM’s upgrades as higher confidence in growth potential compared to ROK’s more cautious outlook.
Strengths and Weaknesses
Below is a comparison table summarizing the key strengths and weaknesses of Rockwell Automation, Inc. (ROK) and JBT Marel Corporation (JBTM) based on the most recent financial and strategic data.
| Criterion | Rockwell Automation, Inc. (ROK) | JBT Marel Corporation (JBTM) |
|---|---|---|
| Diversification | Strong diversification across Intelligent Devices, Lifecycle Services, and Software & Control segments, with revenues above 2B in each segment. | Less diversified product breakdown; focus more specialized but limited public segment data. |
| Profitability | High net margin (10.42%) and ROIC (13.71%) well above WACC (10.39%), indicating value creation and efficient capital use. | Low net margin (4.98%) and ROIC (3.65%) below WACC (7.48%), indicating value destruction. |
| Innovation | Consistent investment in software and automation, supporting a growing ROIC trend (+77%), signaling durable competitive advantage. | Declining ROIC trend (-60%) suggests challenges in maintaining profitability and innovation payoff. |
| Global presence | Established global operations with broad product and service portfolio supporting international markets. | Smaller scale with less evidence of broad global footprint or diversified revenue sources. |
| Market Share | Strong market position in industrial automation with sustained revenue growth in main segments. | Market position weaker with less financial strength and profitability compared to ROK. |
Key takeaways: Rockwell Automation demonstrates robust profitability, diversification, and innovation, underpinning its durable competitive advantage. In contrast, JBT Marel struggles with declining profitability and value destruction risks, signaling caution for investors.
Risk Analysis
Below is a comparative risk assessment table for Rockwell Automation, Inc. (ROK) and JBT Marel Corporation (JBTM) based on the most recent data available for 2025 and 2024 respectively.
| Metric | Rockwell Automation, Inc. (ROK) | JBT Marel Corporation (JBTM) |
|---|---|---|
| Market Risk | Beta 1.52 (above market avg) – moderate volatility | Beta 1.00 – market-correlated risk |
| Debt Level | Debt-to-Equity neutral (1.0), Debt-to-Assets 32.5% – moderate leverage | Debt-to-Equity neutral (0.81), Debt-to-Assets 36.7% – moderate leverage |
| Regulatory Risk | Moderate, operates globally in industrial sectors with environmental and safety regulations | Moderate, global food and beverage tech industry with health and safety compliance |
| Operational Risk | Exposure to supply chain disruptions, technology integration complexity | Exposure to diverse processing technologies, supply chain, and integration risks |
| Environmental Risk | Moderate – participation in eco-industrial markets but industrial exposure remains | Moderate – food tech with some environmental compliance, lower industrial emissions |
| Geopolitical Risk | Moderate – global operations with potential impact from trade policies and geopolitical tensions | Moderate – global footprint with exposure to regional regulatory changes and trade issues |
Synthesis: Rockwell Automation shows moderate market risk with a beta above 1.5 and carries moderate debt, but it maintains strong financial health indicated by favorable profitability and liquidity scores. JBT Marel faces higher financial distress risk, evidenced by a low Altman Z-score (1.75) in the distress zone and weak profitability metrics, making operational and market risks more impactful. Investors should weigh Rockwell’s stable financial foundation against JBTM’s heightened bankruptcy risk and weaker returns.
Which Stock to Choose?
Rockwell Automation, Inc. (ROK) shows a slightly favorable financial ratio profile with strong profitability metrics, a growing ROIC well above WACC indicating value creation, and a very favorable rating despite some unfavorable valuation ratios. Its income statement reveals mixed trends with recent declines in net margin and EPS, but overall solid profitability and a bullish stock price trend.
JBT Marel Corporation (JBTM) exhibits a slightly unfavorable financial ratios profile with lower profitability ratios, a declining ROIC below WACC signaling value destruction, and a very favorable rating overall but weak return on equity and assets scores. Its income statement also indicates unfavorable growth trends and weak margins, though the stock price shows bullish momentum with less volatility.
For investors prioritizing durable competitive advantage and strong profitability, Rockwell Automation may appear more favorable given its very favorable moat status and robust returns. Conversely, those with a tolerance for risk and interest in potential turnaround scenarios might find JBT Marel’s recent stock acceleration and moderate valuation appealing despite its financial challenges.
Disclaimer: Investment carries a risk of loss of initial capital. The past performance is not a reliable indicator of future results. Be sure to understand risks before making an investment decision.
Go Further
I encourage you to read the complete analyses of Rockwell Automation, Inc. and JBT Marel Corporation to enhance your investment decisions: