Home > Comparison > Industrials > ROK vs HON
The strategic rivalry between Rockwell Automation, Inc. and Honeywell International Inc. shapes the evolution of the industrial sector. Rockwell, a specialized industrial machinery leader, focuses on automation and digital transformation. Honeywell, a diversified industrial conglomerate, spans aerospace, building technologies, and materials. This analysis pits Rockwell’s precision automation against Honeywell’s broad technological footprint to determine which offers superior risk-adjusted returns for a diversified portfolio in 2026.
Table of contents
Companies Overview
Rockwell Automation and Honeywell International dominate diverse corners of the industrial technology landscape.
Rockwell Automation, Inc.: Industrial Automation Pioneer
Rockwell Automation specializes in industrial automation and digital transformation. Its revenue streams come from hardware, software, and services across Intelligent Devices, Software & Control, and Lifecycle Services segments. In 2026, the company focuses on enhancing connected services and digital twin technologies to deepen integration with discrete and process industries.
Honeywell International Inc.: Diversified Technology Conglomerate
Honeywell International stands as a global leader in diversified technology and manufacturing. It generates revenue from Aerospace, Building Technologies, Performance Materials, and Safety Solutions segments. The 2026 strategy emphasizes expanding automation controls, energy management software, and safety productivity solutions to strengthen its footprint across aerospace and industrial markets.
Strategic Collision: Similarities & Divergences
Both companies invest heavily in automation and software, yet Rockwell pursues a focused industrial automation niche, while Honeywell leverages a diversified conglomerate model. Their primary competition lies in industrial automation and control software markets. Rockwell offers a specialized, tech-centric profile; Honeywell presents a broader, multi-industry investment with resilience through diversification.
Income Statement Comparison
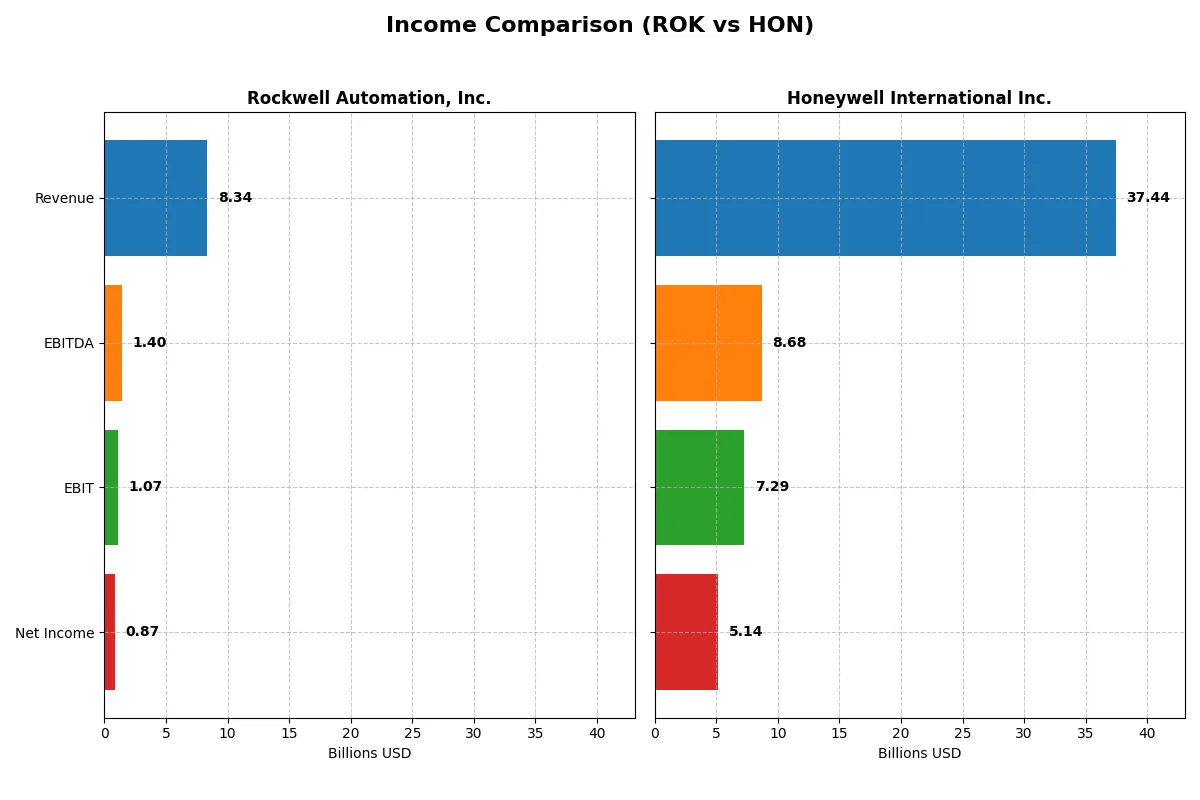
This data dissects the core profitability and scalability of both corporate engines to reveal who dominates the bottom line:
| Metric | Rockwell Automation, Inc. (ROK) | Honeywell International Inc. (HON) |
|---|---|---|
| Revenue | 8.34B | 37.44B |
| Cost of Revenue | 4.33B | 23.61B |
| Operating Expenses | 2.59B | 7.22B |
| Gross Profit | 4.02B | 13.83B |
| EBITDA | 1.40B | 8.68B |
| EBIT | 1.07B | 7.29B |
| Interest Expense | 156M | 1.34B |
| Net Income | 869M | 5.14B |
| EPS | 7.69 | 8.03 |
| Fiscal Year | 2025 | 2025 |
Income Statement Analysis: The Bottom-Line Duel
This income statement comparison reveals which company operates more efficiently and delivers stronger profitability under current market conditions.
Rockwell Automation, Inc. Analysis
Rockwell’s revenue edged up slightly to $8.3B in 2025, but net income declined to $867M, reflecting margin pressure. Its gross margin stays healthy at 48.1%, yet net margin slipped to 10.4%, signaling cost challenges. Despite solid operational scale, Rockwell’s earnings momentum weakened, with EBIT down 14% year-over-year.
Honeywell International Inc. Analysis
Honeywell’s revenue decreased 2.7% to $37.4B in 2025, while net income fell to $5.14B, pressured by shrinking margins. Gross margin dropped to 36.9%, but EBIT margin remains robust at 19.5%, supporting a stronger bottom line. Though revenue contracted, Honeywell sustains better profitability ratios compared to peers, despite recent margin declines.
Margin Efficiency vs. Revenue Scale
Honeywell delivers superior EBIT and net margins despite a revenue dip, outperforming Rockwell’s thinner margins and declining earnings. Rockwell’s higher gross margin fails to convert into net income growth, revealing operational inefficiencies. For investors prioritizing profitability, Honeywell’s profile offers more resilience, while Rockwell reflects challenges in sustaining earnings momentum.
Financial Ratios Comparison
These vital ratios act as a diagnostic tool to expose underlying fiscal health, valuation premiums, and capital efficiency for Rockwell Automation and Honeywell International:
| Ratios | Rockwell Automation (ROK) | Honeywell International (HON) |
|---|---|---|
| ROE | 23.78% | 33.28% |
| ROIC | 13.71% | 9.41% |
| P/E | 45.33 | 24.11 |
| P/B | 10.78 | 8.03 |
| Current Ratio | 1.14 | 1.32 |
| Quick Ratio | 0.77 | 1.05 |
| D/E (Debt-to-Equity) | 1.00 | 2.14 |
| Debt-to-Assets | 32.51% | 44.57% |
| Interest Coverage | 9.12 | 5.16 |
| Asset Turnover | 0.74 | 0.54 |
| Fixed Asset Turnover | 6.95 | 8.71 |
| Payout ratio | 68.01% | 57.91% |
| Dividend yield | 1.50% | 2.40% |
| Fiscal Year | 2025 | 2025 |
Efficiency & Valuation Duel: The Vital Signs
Financial ratios act as a company’s DNA, revealing hidden risks and operational excellence behind headline figures.
Rockwell Automation, Inc.
Rockwell Automation posts a solid 23.8% ROE and a 10.4% net margin, indicating robust profitability. However, its P/E ratio of 45.3 signals an expensive stock, stretched beyond typical sector levels. The modest 1.5% dividend yield suggests a cautious approach to shareholder returns, balancing dividends with reinvestment in R&D at 8.1% of revenue.
Honeywell International Inc.
Honeywell delivers a higher ROE of 33.3% and a stronger net margin of 12.7%, reflecting superior efficiency. Its P/E ratio of 24.1 appears more reasonable, positioning the stock as fairly valued. Honeywell offers a 2.4% dividend yield, reinforcing a shareholder-friendly policy with a balanced reinvestment in R&D at 4.7% of revenue.
Valuation Discipline vs. Profitability Power
Honeywell strikes a better balance with high profitability and reasonable valuation metrics. Rockwell’s premium valuation demands scrutiny amid its moderate dividend and reinvestment strategy. Investors seeking operational strength and income might favor Honeywell’s profile, while those tolerating valuation risk may consider Rockwell’s growth focus.
Which one offers the Superior Shareholder Reward?
I compare Rockwell Automation (ROK) and Honeywell (HON) on dividends and buybacks. ROK yields 1.5% with a payout ratio near 68%, supported by strong FCF coverage (~88%). HON offers a higher yield at 2.4% and a lower payout ratio around 58%, also well-covered by FCF (~85%). Both companies actively repurchase shares, but HON’s buyback intensity aligns better with its lower payout ratio and solid cash flow. Strategically, HON balances dividends and buybacks more sustainably, preserving growth capital amid leverage (debt-to-equity 2.14 vs. ROK’s 1.0). For 2026, I find HON’s distribution model offers a superior total return profile, blending income with prudent capital allocation.
Comparative Score Analysis: The Strategic Profile
The radar chart reveals the fundamental DNA and strategic trade-offs of Rockwell Automation and Honeywell International, illustrating their financial strengths and vulnerabilities:
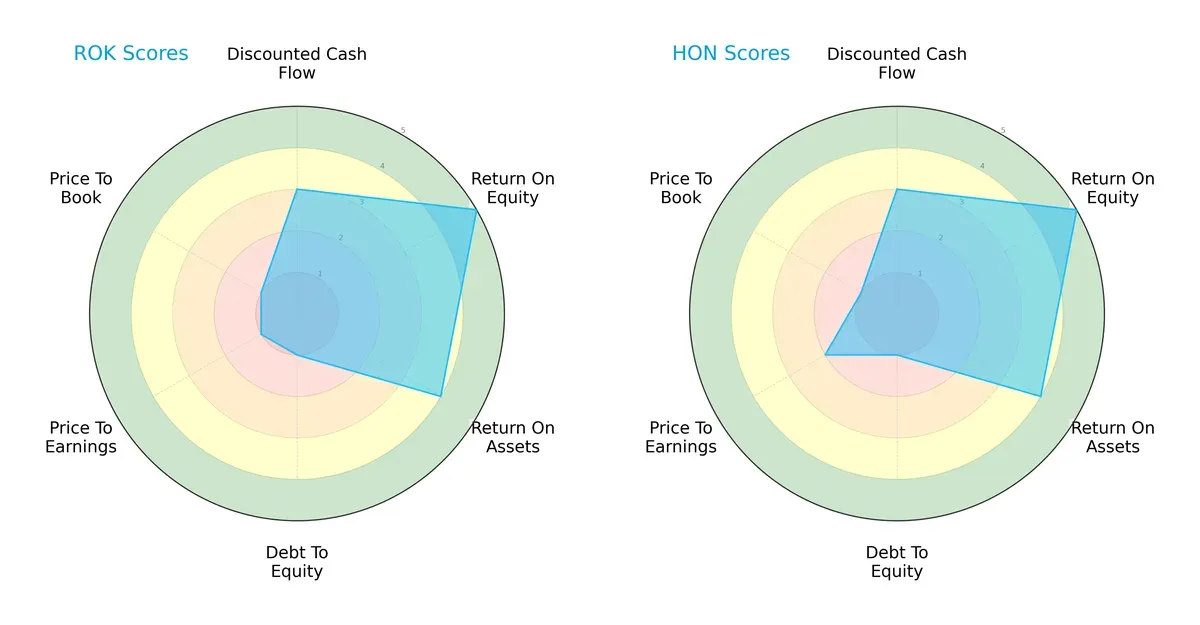
Both firms show parity in DCF, ROE, and ROA scores, with each scoring 3, 5, and 4 respectively, reflecting solid core profitability and asset efficiency. Honeywell edges out Rockwell in valuation with a better P/E score (2 vs. 1), signaling a comparatively more attractive pricing relative to earnings. However, both share severe weaknesses in debt-to-equity and price-to-book metrics, scoring 1 each, exposing leverage risks and possible market undervaluation. Honeywell’s slightly more balanced valuation profile contrasts with Rockwell’s reliance on operational efficiency to justify investment.
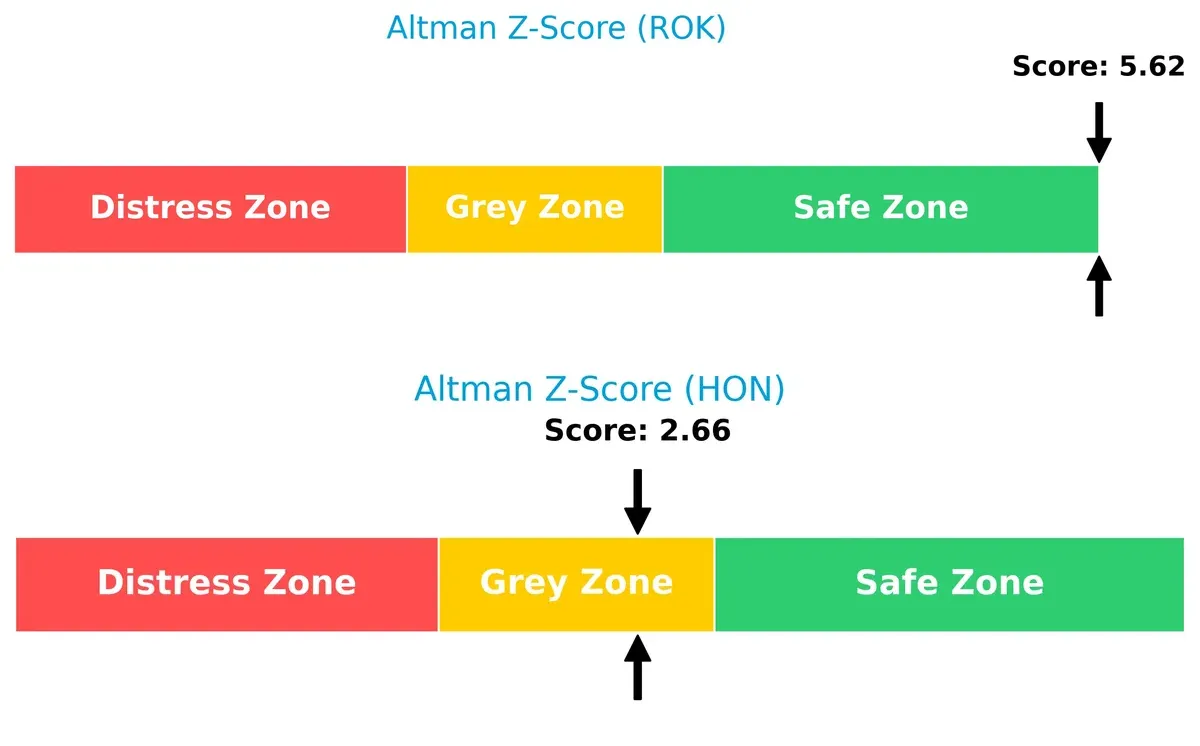
Bankruptcy Risk: Solvency Showdown
Rockwell’s Altman Z-Score of 5.62 firmly places it in the safe zone, indicating robust solvency and a very low bankruptcy risk. Honeywell’s 2.66 score falls into the grey zone, signaling moderate risk and caution for long-term survival in this economic cycle:
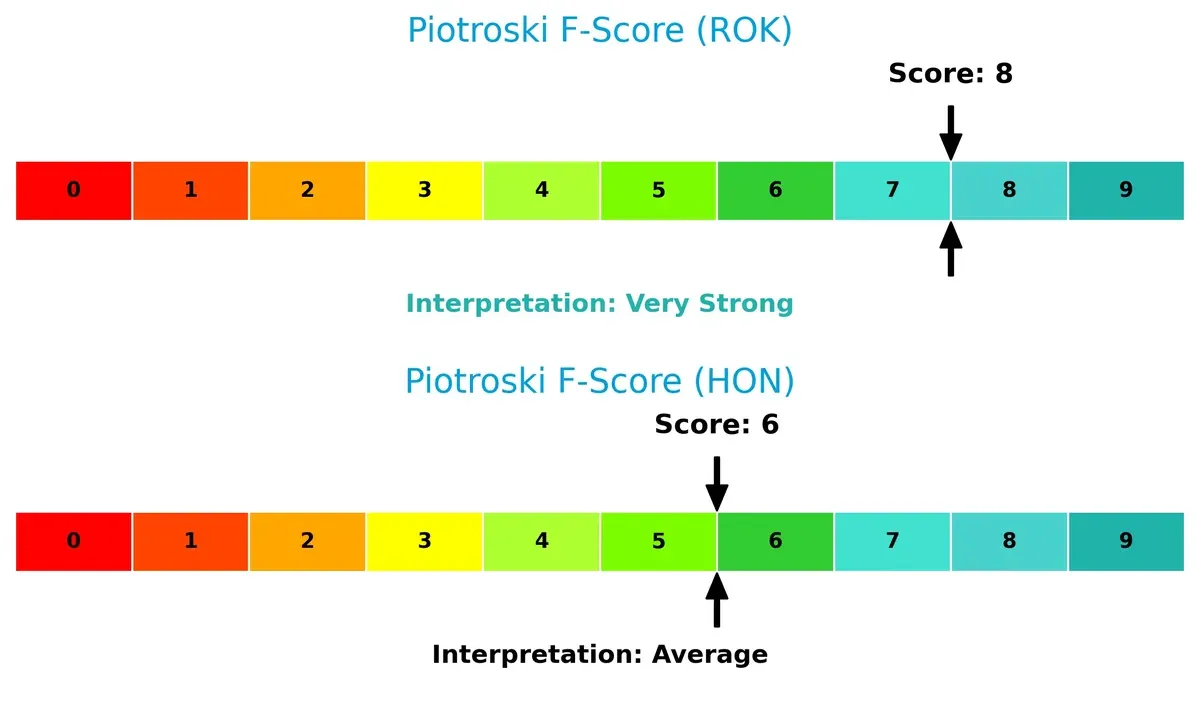
Financial Health: Quality of Operations
Rockwell boasts a Piotroski F-Score of 8, indicating very strong financial health and operational quality. Honeywell’s score of 6 is average, suggesting some internal financial metrics may require scrutiny compared to Rockwell’s more resilient profile:
How are the two companies positioned?
This section dissects the operational DNA of Rockwell Automation and Honeywell by comparing their revenue distribution and internal strengths and weaknesses. The goal is to confront their economic moats to determine which model offers the most resilient, sustainable competitive advantage today.
Revenue Segmentation: The Strategic Mix
This visual comparison dissects how Rockwell Automation and Honeywell diversify their income streams and where their primary sector bets lie:
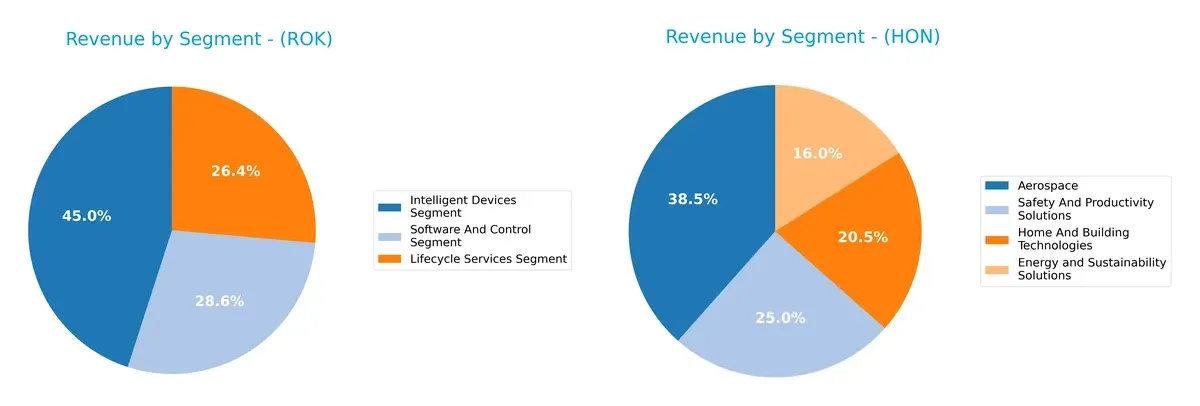
Rockwell Automation leans on three close segments: Intelligent Devices at $3.76B, Software and Control at $2.38B, and Lifecycle Services at $2.20B. Honeywell’s revenue dwarfs Rockwell’s, anchored by Aerospace at $15.46B and Safety and Productivity Solutions at $10.05B. Honeywell’s broader portfolio reduces concentration risk, while Rockwell’s focused mix signals strong ecosystem lock-in but heightened sector exposure.
Strengths and Weaknesses Comparison
This table compares the strengths and weaknesses of Rockwell Automation (ROK) and Honeywell International (HON):
ROK Strengths
- Diversified revenue across Intelligent Devices, Software, and Lifecycle Services
- Favorable net margin (10.42%) and ROIC (13.71%)
- Strong return on equity (23.78%)
- Favorable interest coverage (6.88) and fixed asset turnover (6.95)
- Balanced debt-to-assets ratio (32.51%)
- Global presence in key regions including North America and EMEA
HON Strengths
- Broad diversification in Aerospace, Home Technologies, Safety, and Performance Materials
- Higher net margin (12.74%) and ROE (33.28%)
- Lower cost of capital (WACC 7.25%) supports investments
- Favorable quick ratio (1.05) and dividend yield (2.4%)
- Strong fixed asset turnover (8.71)
- Extensive global footprint with dominant US and Europe sales
ROK Weaknesses
- High price multiples (PE 45.33, PB 10.78) may indicate valuation risk
- Unfavorable quick ratio (0.77) suggests liquidity constraints
- WACC (10.44%) exceeds ROIC, indicating potential capital inefficiency
- Moderate current ratio (1.14) limits short-term flexibility
- Neutral debt levels (D/E 1.0) but requires monitoring
HON Weaknesses
- Elevated debt-to-equity ratio (2.14) increases financial leverage risk
- Unfavorable price-to-book ratio (8.03) may reflect overvaluation
- Neutral PE (24.11) still above average market benchmarks
- Moderate interest coverage (5.42) lower than ROK, indicating tighter debt servicing
- Asset turnover (0.54) lags sector peers, impacting operational efficiency
Both companies show balanced diversification and solid profitability metrics. ROK’s capital cost challenges and liquidity ratios warrant caution, while HON’s higher leverage and valuation multiples could pressure financial stability. Their strategic focus must weigh these financial strengths and weaknesses carefully.
The Moat Duel: Analyzing Competitive Defensibility
A structural moat is the only shield preserving long-term profits from relentless competition erosion. Let’s dissect two industry leaders’ moats:
Rockwell Automation, Inc.: Digital Automation with a Growing Moat
Rockwell’s moat stems from intangible assets and switching costs embedded in its automation software and hardware. Its ROIC outpaces WACC by 3.3%, signaling efficient capital use and margin stability. New digital twin and simulation products could deepen this moat in 2026.
Honeywell International Inc.: Diversified Conglomerate with Slightly Fading Returns
Honeywell’s cost advantage and scale form its moat, contrasting Rockwell’s software-driven edge. Though it creates value (ROIC > WACC by 2.2%), its ROIC trend declines, reflecting margin pressure. Expansion into connected building tech and aerospace software offers growth but faces stiff competition.
Digital Automation Moat vs. Scale and Cost Advantage
Rockwell’s moat is deeper, supported by rising ROIC and strong switching costs in industrial automation. Honeywell’s diversified scale shields profits but its declining ROIC signals vulnerability. Rockwell stands better equipped to defend its market share in 2026.
Which stock offers better returns?
The past year shows strong price appreciation for both Rockwell Automation, Inc. and Honeywell International Inc., with notable acceleration in their bullish trends.
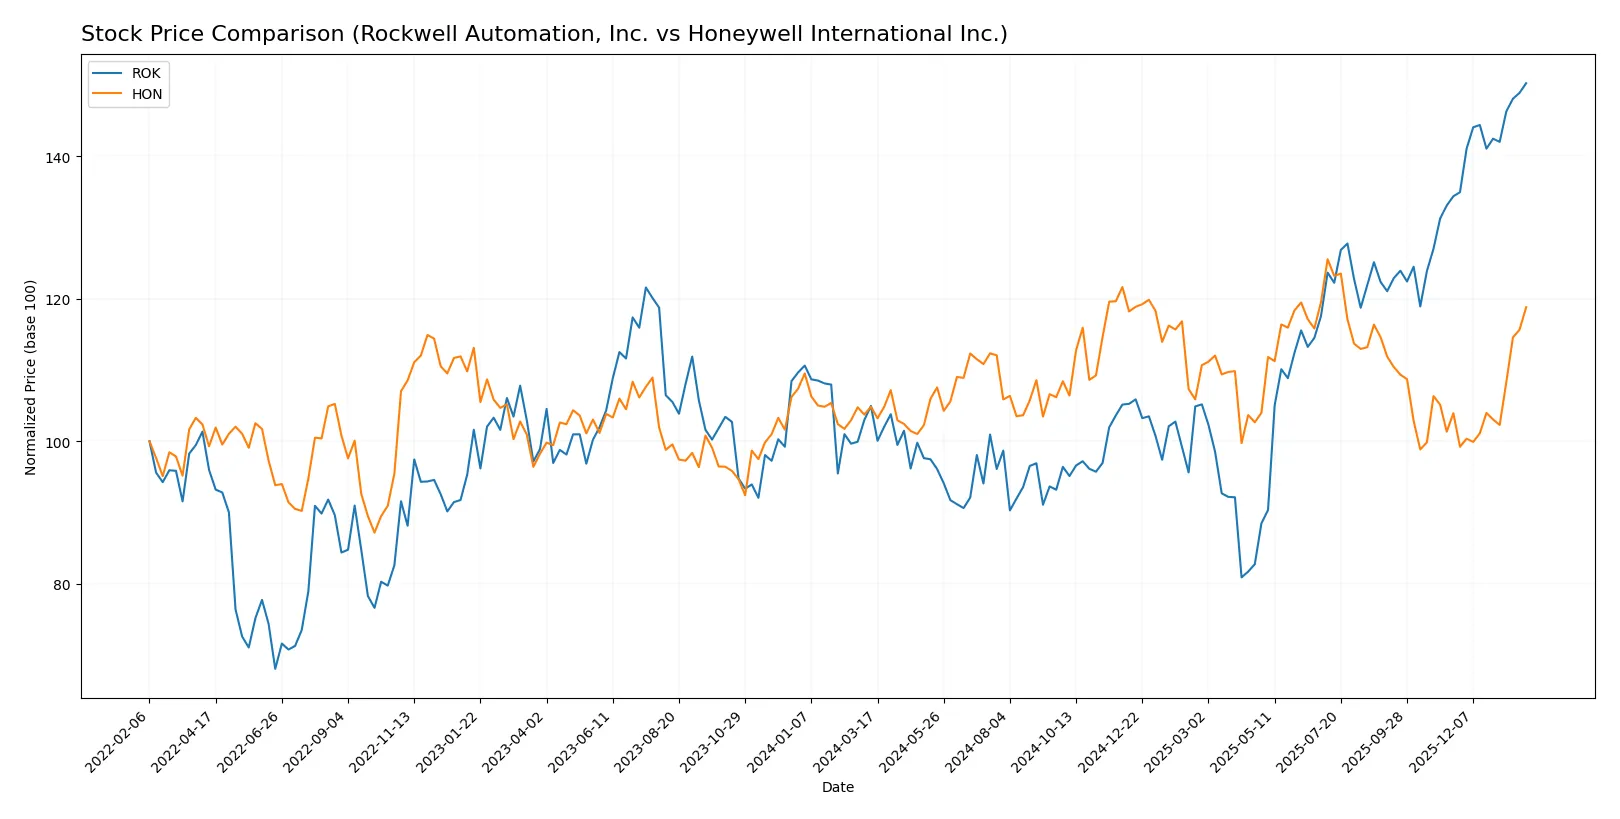
Trend Comparison
Rockwell Automation’s stock surged 43.13% over the past 12 months, marking a bullish trend with accelerating momentum and wide price swings between $227.11 and $421.65.
Honeywell’s stock rose 13.33% during the same period, also bullish with acceleration, but showed lower volatility and a narrower price range from $189.29 to $240.40.
Rockwell Automation delivered the highest market performance, outperforming Honeywell by nearly 30 percentage points in overall price appreciation.
Target Prices
Analysts present a balanced target consensus for Rockwell Automation and Honeywell International.
| Company | Target Low | Target High | Consensus |
|---|---|---|---|
| Rockwell Automation, Inc. | 380 | 470 | 421.57 |
| Honeywell International Inc. | 195 | 268 | 242.08 |
The target consensus for Rockwell Automation aligns closely with its current price of 422, indicating limited upside. Honeywell’s consensus target stands roughly 6% above its current 228 price, suggesting moderate growth potential.

Don’t Let Luck Decide Your Entry Point
Optimize your entry points with our advanced ProRealTime indicators. You’ll get efficient buy signals with precise price targets for maximum performance. Start outperforming now!
How do institutions grade them?
The following tables summarize the latest institutional grades for Rockwell Automation, Inc. and Honeywell International Inc.:
Rockwell Automation, Inc. Grades
The table below shows recent analyst ratings and grade changes for Rockwell Automation, Inc.:
| Grading Company | Action | New Grade | Date |
|---|---|---|---|
| Oppenheimer | Downgrade | Perform | 2026-01-20 |
| JP Morgan | Maintain | Neutral | 2026-01-16 |
| Morgan Stanley | Maintain | Overweight | 2026-01-13 |
| Wells Fargo | Maintain | Equal Weight | 2026-01-07 |
| Barclays | Maintain | Overweight | 2026-01-07 |
| Goldman Sachs | Upgrade | Neutral | 2025-12-16 |
| Jefferies | Maintain | Buy | 2025-12-10 |
| Citigroup | Maintain | Buy | 2025-12-08 |
| Barclays | Maintain | Overweight | 2025-12-04 |
| Baird | Maintain | Outperform | 2025-11-21 |
Honeywell International Inc. Grades
The table below shows recent analyst ratings and grade changes for Honeywell International Inc.:
| Grading Company | Action | New Grade | Date |
|---|---|---|---|
| Citigroup | Maintain | Buy | 2026-01-30 |
| RBC Capital | Maintain | Outperform | 2026-01-30 |
| Barclays | Maintain | Overweight | 2026-01-30 |
| Wells Fargo | Maintain | Equal Weight | 2026-01-30 |
| JP Morgan | Maintain | Overweight | 2026-01-30 |
| JP Morgan | Upgrade | Overweight | 2026-01-16 |
| Citigroup | Maintain | Buy | 2026-01-12 |
| Wells Fargo | Maintain | Equal Weight | 2026-01-07 |
| Mizuho | Maintain | Outperform | 2026-01-05 |
| Barclays | Maintain | Overweight | 2025-12-24 |
Which company has the best grades?
Honeywell International consistently holds higher grades, including multiple “Buy” and “Outperform” ratings. Rockwell shows more mixed signals, with recent downgrades and several neutral ratings. This difference may influence investor sentiment favoring Honeywell.
Risks specific to each company
The following categories identify the critical pressure points and systemic threats facing both firms in the 2026 market environment:
1. Market & Competition
Rockwell Automation, Inc.
- Faces intense competition in industrial automation with pressure on pricing due to technological innovation.
Honeywell International Inc.
- Operates in diverse segments, facing competition across aerospace, building tech, and materials, diluting focus but spreading risk.
2. Capital Structure & Debt
Rockwell Automation, Inc.
- Moderate debt with DE ratio 1.0; interest coverage strong at 6.88, but WACC high at 10.44%, indicating costly capital.
Honeywell International Inc.
- Higher leverage with DE 2.14 and debt-to-assets 44.57%; interest coverage 5.42 is adequate but financial risk elevated.
3. Stock Volatility
Rockwell Automation, Inc.
- Beta 1.516 signals higher volatility than the market, increasing risk for risk-averse investors.
Honeywell International Inc.
- Beta 0.942 suggests stock volatility below market average, offering more stable price movements.
4. Regulatory & Legal
Rockwell Automation, Inc.
- Subject to industrial safety and export regulations; evolving standards on digital solutions pose compliance costs.
Honeywell International Inc.
- Faces complex regulations across aerospace and environmental sectors, increasing legal and compliance expenses.
5. Supply Chain & Operations
Rockwell Automation, Inc.
- Relies heavily on independent distributors; supply chain disruptions in electronics components could impact delivery.
Honeywell International Inc.
- Large-scale global operations expose it to supply chain risks but diversified segments mitigate severe disruption.
6. ESG & Climate Transition
Rockwell Automation, Inc.
- Moderate ESG focus; opportunities in eco-industrial markets but needs faster adaptation to climate regulations.
Honeywell International Inc.
- Strong ESG initiatives with materials innovation and reduced global-warming-potential products, enhancing transition resilience.
7. Geopolitical Exposure
Rockwell Automation, Inc.
- Exposure to North American and international markets with moderate geopolitical risk from trade tensions.
Honeywell International Inc.
- Broad global footprint including sensitive aerospace markets exposes company to geopolitical volatility and sanctions risks.
Which company shows a better risk-adjusted profile?
Rockwell’s most impactful risk is its high stock volatility and expensive capital structure, reflected in an elevated WACC and unfavorable valuation multiples. Honeywell’s key risk lies in its higher leverage and complex regulatory environment. However, Honeywell’s lower volatility, more favorable WACC, and stronger ESG positioning offer a more balanced risk profile. Recent Altman Z-Scores confirm this: Rockwell scores safely at 5.62, while Honeywell lingers in the grey zone at 2.66, underlining Rockwell’s stronger financial stability but higher market risk. Overall, Honeywell presents a better risk-adjusted profile due to more stable stock behavior and diversified operations.
Final Verdict: Which stock to choose?
Rockwell Automation’s superpower lies in its durable competitive advantage backed by a growing ROIC well above its cost of capital. Its efficiency in capital allocation and strong returns hint at a resilient growth engine. A point of vigilance remains its elevated valuation multiples, which could pressure returns if growth slows. It suits an Aggressive Growth portfolio seeking high-quality industrial innovation.
Honeywell International commands a strategic moat through its diversified technology platform and steady free cash flow generation. Its safer liquidity profile and moderate valuation provide a cushion against volatility relative to Rockwell. Honeywell fits well within a GARP (Growth at a Reasonable Price) portfolio focused on balanced risk and consistent income.
If you prioritize high return on invested capital and growth durability, Rockwell outshines Honeywell due to its robust value creation and operational efficiency. However, if you seek better stability with a defensive tilt and moderate valuation, Honeywell offers superior financial safety and recurring revenue advantages. Each represents a nuanced scenario aligned with distinct investor risk appetites and growth expectations.
Disclaimer: Investment carries a risk of loss of initial capital. The past performance is not a reliable indicator of future results. Be sure to understand risks before making an investment decision.
Go Further
I encourage you to read the complete analyses of Rockwell Automation, Inc. and Honeywell International Inc. to enhance your investment decisions: