When evaluating investment opportunities in the industrial sector, Rockwell Automation, Inc. (ROK) and Columbus McKinnon Corporation (CMCO) stand out for their innovative approaches to machinery and automation. Both companies serve overlapping markets with cutting-edge solutions in industrial and material handling automation, yet differ in scale and product focus. In this article, I will analyze their strengths and risks to help you identify which company offers the most compelling investment potential in 2026.
Table of contents
Companies Overview
I will begin the comparison between Rockwell Automation and Columbus McKinnon by providing an overview of these two companies and their main differences.
Rockwell Automation Overview
Rockwell Automation, Inc. focuses on industrial automation and digital transformation solutions worldwide. Its operations span three segments: Intelligent Devices, Software & Control, and Lifecycle Services. The company provides hardware, software, and services tailored to various industries, including automotive, semiconductor, and process markets. Founded in 1903, Rockwell Automation is headquartered in Milwaukee, Wisconsin, and employs 27,000 people.
Columbus McKinnon Overview
Columbus McKinnon Corporation designs and manufactures intelligent motion solutions for material handling globally. Its product range includes hoists, crane systems, rigging equipment, power and motion technology, and conveyor systems. Serving diverse market verticals such as industrial automation, transportation, and food and beverage, the company was founded in 1875 and is based in Buffalo, New York, with 3,515 employees.
Key similarities and differences
Both Rockwell Automation and Columbus McKinnon operate in the industrial sector in the US, providing machinery and automation solutions. Rockwell Automation is larger, with a market cap of 44.7B and a broader focus on digital transformation and software, whereas Columbus McKinnon centers on mechanical motion and material handling products with a market cap of 494M. Both serve multiple industries but differ in scale and product specialization.
Income Statement Comparison
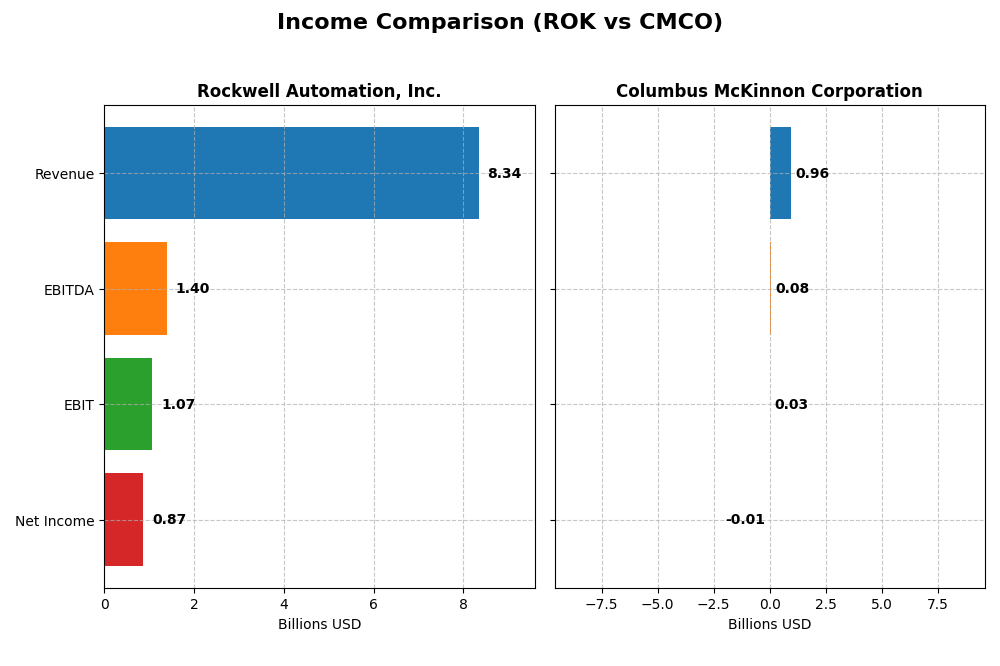
The table below compares key income statement metrics for Rockwell Automation, Inc. and Columbus McKinnon Corporation for their most recent fiscal years.
| Metric | Rockwell Automation, Inc. (ROK) | Columbus McKinnon Corporation (CMCO) |
|---|---|---|
| Market Cap | 44.8B | 494M |
| Revenue | 8.34B | 963M |
| EBITDA | 1.40B | 75.1M |
| EBIT | 1.07B | 27.0M |
| Net Income | 869M | -5.14M |
| EPS | 7.69 | -0.18 |
| Fiscal Year | 2025 | 2024 |
Income Statement Interpretations
Rockwell Automation, Inc.
Rockwell Automation’s revenue grew modestly by 0.97% in 2025, reaching $8.34B, while net income declined to $869M, down from prior years. Gross margin improved to 48.14%, but net margin slipped to 10.42%, reflecting pressure on profitability. The latest year showed slower revenue growth and a 14.17% drop in EBIT, indicating some operational challenges.
Columbus McKinnon Corporation
Columbus McKinnon experienced a 4.98% revenue decline to $963M in 2024, with net income turning negative at -$5.14M. Gross margin fell to 33.82%, and net margin was negative at -0.53%. EBIT dropped sharply by 72.94%, signaling a significant deterioration in profitability and operational efficiency over the most recent year.
Which one has the stronger fundamentals?
Both companies face unfavorable income trends, but Rockwell Automation maintains higher gross and net margins with positive, albeit slowing, revenue growth. Columbus McKinnon’s negative net income and steep EBIT decline highlight greater financial strain. Overall, Rockwell Automation shows relatively stronger income fundamentals, despite recent margin and profitability pressures.
Financial Ratios Comparison
Below is a comparison of key financial ratios for Rockwell Automation, Inc. (ROK) and Columbus McKinnon Corporation (CMCO) based on their most recent fiscal year data.
| Ratios | Rockwell Automation, Inc. (2025) | Columbus McKinnon Corporation (2024) |
|---|---|---|
| ROE | 23.8% | -0.6% |
| ROIC | 13.7% | 3.3% |
| P/E | 45.3 | -94.7 |
| P/B | 10.8 | 0.55 |
| Current Ratio | 1.14 | 1.81 |
| Quick Ratio | 0.77 | 1.04 |
| D/E (Debt-to-Equity) | 1.00 | 0.61 |
| Debt-to-Assets | 32.5% | 31.1% |
| Interest Coverage | 9.12 | 1.68 |
| Asset Turnover | 0.74 | 0.55 |
| Fixed Asset Turnover | 6.95 | 9.07 |
| Payout Ratio | 68.0% | -156.5% |
| Dividend Yield | 1.50% | 1.65% |
Interpretation of the Ratios
Rockwell Automation, Inc.
Rockwell Automation shows a mix of strong and weak ratios. Profitability indicators like net margin (10.42%) and return on equity (23.78%) are favorable, but valuation ratios such as P/E (45.33) and P/B (10.78) appear high, signaling potential overvaluation. The current ratio is neutral, while the quick ratio is unfavorable, indicating some liquidity caution. The dividend yield stands at 1.5%, supported by stable payouts, but investors should watch for risks linked to high payout ratios or buybacks.
Columbus McKinnon Corporation
Columbus McKinnon’s profitability ratios are unfavorable, with negative net margin (-0.53%) and ROE (-0.58%), reflecting recent performance challenges. However, liquidity ratios like current ratio (1.81) and quick ratio (1.04) are favorable, indicating solid short-term financial health. Valuation metrics such as P/E (-94.69) and P/B (0.55) are low, but driven by weak earnings. The company pays a dividend yield of 1.65%, with cautious shareholder returns given operational pressures.
Which one has the best ratios?
Both companies have slightly favorable overall ratio profiles, but Rockwell Automation demonstrates stronger profitability and coverage ratios, albeit with higher valuation multiples. Columbus McKinnon offers better liquidity and lower valuation but suffers from negative profitability and interest coverage. The choice depends on the investor’s focus on either profitability strength or valuation and liquidity considerations.
Strategic Positioning
This section compares the strategic positioning of Rockwell Automation, Inc. and Columbus McKinnon Corporation including market position, key segments, and exposure to technological disruption:
Rockwell Automation, Inc.
- Leading industrial automation provider with significant market cap ($44.7B); faces competition in industrial machinery.
- Diverse segments: Intelligent Devices, Software & Control, Lifecycle Services drive revenue across multiple industries.
- Strong emphasis on digital transformation and software integration, positioning for technological evolution.
Columbus McKinnon Corporation
- Smaller industrial machinery firm ($494M market cap) with moderate competitive pressure.
- Focused on intelligent motion solutions and material handling across varied industrial verticals.
- Offers mechanical and electromechanical products with less emphasis on digital disruption.
Rockwell Automation, Inc. vs Columbus McKinnon Corporation Positioning
Rockwell Automation shows a diversified product and service portfolio across automation and digital transformation, serving broad markets. Columbus McKinnon has a more concentrated focus on motion and lifting solutions, with narrower technological scope and market reach.
Which has the best competitive advantage?
Rockwell Automation exhibits a very favorable moat with growing ROIC exceeding WACC, indicating durable competitive advantage. Columbus McKinnon shows slightly unfavorable moat due to ROIC below WACC despite improving profitability, suggesting weaker competitive positioning.
Stock Comparison
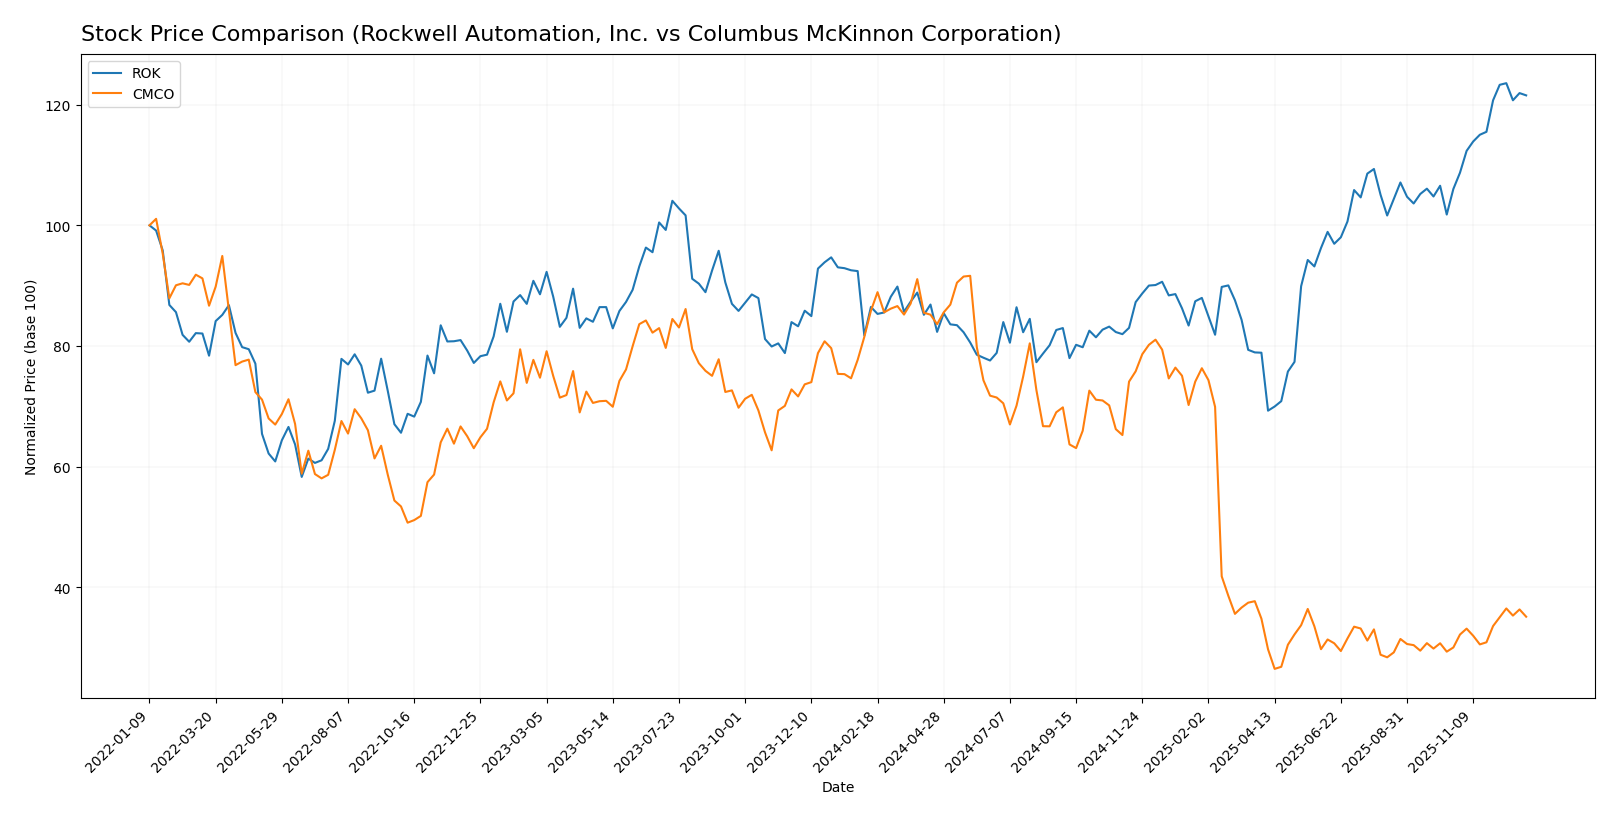
The stock price trends over the past year reveal significant divergence, with Rockwell Automation, Inc. exhibiting a strong upward trajectory while Columbus McKinnon Corporation shows a marked decline, reflecting distinct trading dynamics and market sentiment.
Trend Analysis
Rockwell Automation, Inc. experienced a bullish trend over the last 12 months with a 40.58% price increase, showing acceleration and high volatility, reaching a peak price of 405.18 and a low of 227.11.
Columbus McKinnon Corporation recorded a bearish trend with a 59.11% price decrease over the same period, also accelerating but with lower volatility, hitting a high of 44.9 and a low of 12.96.
Comparatively, Rockwell Automation delivered the highest market performance, outperforming Columbus McKinnon significantly despite recent short-term gains in both stocks.
Target Prices
The current analyst target consensus indicates expected price ranges for Rockwell Automation, Inc. and Columbus McKinnon Corporation.
| Company | Target High | Target Low | Consensus |
|---|---|---|---|
| Rockwell Automation, Inc. | 470 | 345 | 400.86 |
| Columbus McKinnon Corporation | 50 | 48 | 49 |
Analysts expect Rockwell Automation’s price to modestly exceed its current level of 398.55 USD, while Columbus McKinnon’s consensus target is significantly above its current price of 17.2 USD, suggesting strong upside potential.
Analyst Opinions Comparison
This section compares analysts’ ratings and financial grades for Rockwell Automation, Inc. (ROK) and Columbus McKinnon Corporation (CMCO):
Rating Comparison
ROK Rating
- Rating: B-, considered very favorable overall.
- Discounted Cash Flow Score: Moderate at 3, indicating average valuation.
- ROE Score: Very favorable at 5, showing efficient profit generation.
- ROA Score: Favorable at 4, reflecting effective asset use.
- Debt To Equity Score: Very unfavorable at 1, implying higher financial risk.
- Overall Score: Moderate at 3, reflecting balanced financial standing.
CMCO Rating
- Rating: B, also considered very favorable overall.
- Discounted Cash Flow Score: Very favorable at 5, suggesting undervaluation.
- ROE Score: Very unfavorable at 1, indicating weak shareholder return.
- ROA Score: Moderate at 2, showing limited asset utilization.
- Debt To Equity Score: Moderate at 2, indicating moderate financial leverage.
- Overall Score: Moderate at 3, showing similar overall financial assessment.
Which one is the best rated?
CMCO holds a slightly better rating (B vs. B-) and excels in discounted cash flow and debt management, while ROK outperforms in return on equity and asset efficiency. Both have a moderate overall score of 3, reflecting a balanced but different financial profile.
Scores Comparison
The comparison of scores between Rockwell Automation, Inc. (ROK) and Columbus McKinnon Corporation (CMCO) is as follows:
ROK Scores
- Altman Z-Score: 5.32, in the safe zone indicating low bankruptcy risk.
- Piotroski Score: 8, classified as very strong financial health.
CMCO Scores
- Altman Z-Score: 1.40, in the distress zone indicating high bankruptcy risk.
- Piotroski Score: 8, classified as very strong financial health.
Which company has the best scores?
Based on the provided data, ROK has a significantly higher Altman Z-Score, placing it in the safe zone, while CMCO is in the distress zone. Both have the same very strong Piotroski Score of 8. Therefore, ROK shows better financial stability overall.
Grades Comparison
The following presents the latest grades given by recognized financial institutions for Rockwell Automation, Inc. and Columbus McKinnon Corporation:
Rockwell Automation, Inc. Grades
The table below lists recent grades from established grading companies for Rockwell Automation, Inc.:
| Grading Company | Action | New Grade | Date |
|---|---|---|---|
| Goldman Sachs | Upgrade | Neutral | 2025-12-16 |
| Jefferies | Maintain | Buy | 2025-12-10 |
| Citigroup | Maintain | Buy | 2025-12-08 |
| Barclays | Maintain | Overweight | 2025-12-04 |
| Baird | Maintain | Outperform | 2025-11-21 |
| B of A Securities | Maintain | Buy | 2025-11-20 |
| JP Morgan | Maintain | Neutral | 2025-11-11 |
| Morgan Stanley | Maintain | Overweight | 2025-11-10 |
| Wells Fargo | Maintain | Equal Weight | 2025-11-07 |
| Barclays | Maintain | Overweight | 2025-11-07 |
Rockwell Automation’s grades mostly reflect positive outlooks, with several Buy and Overweight ratings maintained and only one recent upgrade to Neutral, indicating stable confidence.
Columbus McKinnon Corporation Grades
The table below lists recent grades from recognized grading companies for Columbus McKinnon Corporation:
| Grading Company | Action | New Grade | Date |
|---|---|---|---|
| DA Davidson | Downgrade | Neutral | 2025-02-11 |
| DA Davidson | Maintain | Buy | 2024-02-05 |
| DA Davidson | Maintain | Buy | 2022-10-04 |
| DA Davidson | Maintain | Buy | 2022-10-03 |
| Barrington Research | Maintain | Outperform | 2022-07-29 |
| Barrington Research | Maintain | Outperform | 2022-07-28 |
| JP Morgan | Downgrade | Neutral | 2022-05-26 |
| Barrington Research | Maintain | Outperform | 2022-05-26 |
| Barrington Research | Maintain | Outperform | 2022-05-25 |
| JP Morgan | Downgrade | Neutral | 2022-05-25 |
Columbus McKinnon’s recent grades show some downgrades to Neutral from Buy or Overweight ratings, suggesting a cautious view, although some Outperform ratings remain stable.
Which company has the best grades?
Rockwell Automation, Inc. has received generally stronger and more recent positive grades compared to Columbus McKinnon Corporation, whose ratings show downgrades and older assessments. This could signal higher analyst confidence in Rockwell Automation’s near-term prospects, potentially impacting investor sentiment accordingly.
Strengths and Weaknesses
Below is a comparison table summarizing key strengths and weaknesses of Rockwell Automation, Inc. (ROK) and Columbus McKinnon Corporation (CMCO) based on recent financial and operational data.
| Criterion | Rockwell Automation, Inc. (ROK) | Columbus McKinnon Corporation (CMCO) |
|---|---|---|
| Diversification | Broad product segments including Intelligent Devices, Lifecycle Services, Software & Control | Diverse product lines with Hoists as major contributor plus multiple smaller segments |
| Profitability | Strong profitability with 10.4% net margin and 23.8% ROE; ROIC 13.7% > WACC 10.3% (creating value) | Negative net margin (-0.5%) and ROE (-0.6%); ROIC 3.3% below WACC 7.2% (shedding value) |
| Innovation | Growing investment in software and control solutions, supporting digital transformation | Moderate innovation focused on power control and conveyor systems; less emphasis on software |
| Global presence | Established global footprint in industrial automation with strong lifecycle services | Primarily North American focus with niche industrial crane and hoist markets |
| Market Share | Leading player in industrial automation and control systems | Smaller market presence in material handling equipment |
Key takeaways: Rockwell Automation demonstrates a durable competitive advantage with strong profitability and increasing ROIC, supported by diversified segments and innovation in digital controls. Columbus McKinnon shows improving profitability trends but remains value-destructive overall, with more limited diversification and global reach. Investors should weigh ROK’s stability against CMCO’s turnaround potential and higher risk.
Risk Analysis
Below is a comparative table of key risks for Rockwell Automation, Inc. (ROK) and Columbus McKinnon Corporation (CMCO) based on their latest financial and operational data from 2025 and 2024 respectively:
| Metric | Rockwell Automation, Inc. (ROK) | Columbus McKinnon Corporation (CMCO) |
|---|---|---|
| Market Risk | Beta 1.499 indicates higher volatility relative to market | Beta 1.294, moderately volatile |
| Debt level | Debt-to-Equity neutral at 1.0; Debt-to-Assets 32.51% | Debt-to-Equity neutral at 0.61; Debt-to-Assets 31.09% |
| Regulatory Risk | Moderate, industrial sector with exposure to multiple industries | Moderate, exposure in industrial and construction sectors |
| Operational Risk | Favorable asset turnover (0.74), strong fixed asset turnover (6.95) | Moderate asset turnover (0.55), strong fixed asset turnover (9.07) |
| Environmental Risk | Moderate, exposure to eco-industrial and renewable energy markets | Moderate, exposure in energy and utilities segments |
| Geopolitical Risk | US-based with international operations, some global market exposure | US-based with international sales, moderate exposure |
In synthesis, Rockwell Automation shows a higher market risk due to greater beta and a slightly elevated debt level, but benefits from strong operational efficiency and robust financial health, placing it in a safe zone for bankruptcy risk. Columbus McKinnon faces elevated bankruptcy risk indicated by its Altman Z-score in the distress zone, despite a strong Piotroski score. Its operational performance is weaker, and interest coverage is low, increasing financial vulnerability. Investors should weigh Rockwell’s market volatility against Columbus McKinnon’s financial distress risk when considering portfolio inclusion.
Which Stock to Choose?
Rockwell Automation, Inc. (ROK) shows a mixed income evolution with revenue growth but declining net income and EPS over 2021-2025. Its profitability is favorable with a 10.42% net margin and strong ROE of 23.78%. Debt ratios are neutral, and the rating is very favorable (B-), supported by a very strong Piotroski score and a safe Altman Z-Score.
Columbus McKinnon Corporation (CMCO) presents unfavorable income trends, including negative net margin and ROE, despite a 48.24% revenue growth over 2020-2024. Financial ratios are slightly favorable globally, with strengths in valuation metrics but weaknesses in profitability and interest coverage. The rating is very favorable (B) overall, although the Altman Z-Score indicates financial distress.
Choosing the most favorable stock might depend on the investor’s profile: those prioritizing durable profitability and financial stability may find ROK more appealing, while investors attracted to valuation opportunities despite higher risks could consider CMCO. The ratings and income evaluations suggest ROK maintains a stronger economic moat and value creation.
Disclaimer: Investment carries a risk of loss of initial capital. The past performance is not a reliable indicator of future results. Be sure to understand risks before making an investment decision.
Go Further
I encourage you to read the complete analyses of Rockwell Automation, Inc. and Columbus McKinnon Corporation to enhance your investment decisions: