In the dynamic world of industrial machinery, Rockwell Automation, Inc. (ROK) and ATS Corporation (ATS) stand out as key players driving innovation and automation solutions. Both companies operate in overlapping markets, delivering advanced automation technologies that transform manufacturing processes globally. Their distinct strategies and market reach make them compelling choices for investors. This article will help you identify which company presents the most attractive investment opportunity today.
Table of contents
Companies Overview
I will begin the comparison between Rockwell Automation, Inc. and ATS Corporation by providing an overview of these two companies and their main differences.
Rockwell Automation, Inc. Overview
Rockwell Automation, Inc. specializes in industrial automation and digital transformation solutions globally. Its operations span three segments: Intelligent Devices, Software & Control, and Lifecycle Services, offering hardware, software, and consulting services. The company serves diverse markets, including automotive, semiconductor, and process industries. Founded in 1903 and headquartered in Milwaukee, Wisconsin, Rockwell Automation is a major player with a market capitalization of approximately 46B USD.
ATS Corporation Overview
ATS Corporation provides comprehensive automation solutions worldwide, including system design, commissioning, and after-sales services. Its offerings encompass engineering design, software development, and factory floor management systems targeting industries such as life sciences, transportation, and energy. Founded in 1978, headquartered in Cambridge, Canada, ATS has a market cap near 2.8B USD and focuses on delivering sustainable production improvements through automation and digital solutions.
Key similarities and differences
Both companies operate in the industrial machinery sector, delivering automation solutions that integrate hardware, software, and services. Rockwell Automation emphasizes digital transformation with a broad segment structure, including software and lifecycle services, while ATS focuses strongly on system integration, engineering, and connected factory management. Rockwell is significantly larger in scale with a diverse customer base, whereas ATS maintains a niche presence with a focus on customized automation and support services.
Income Statement Comparison
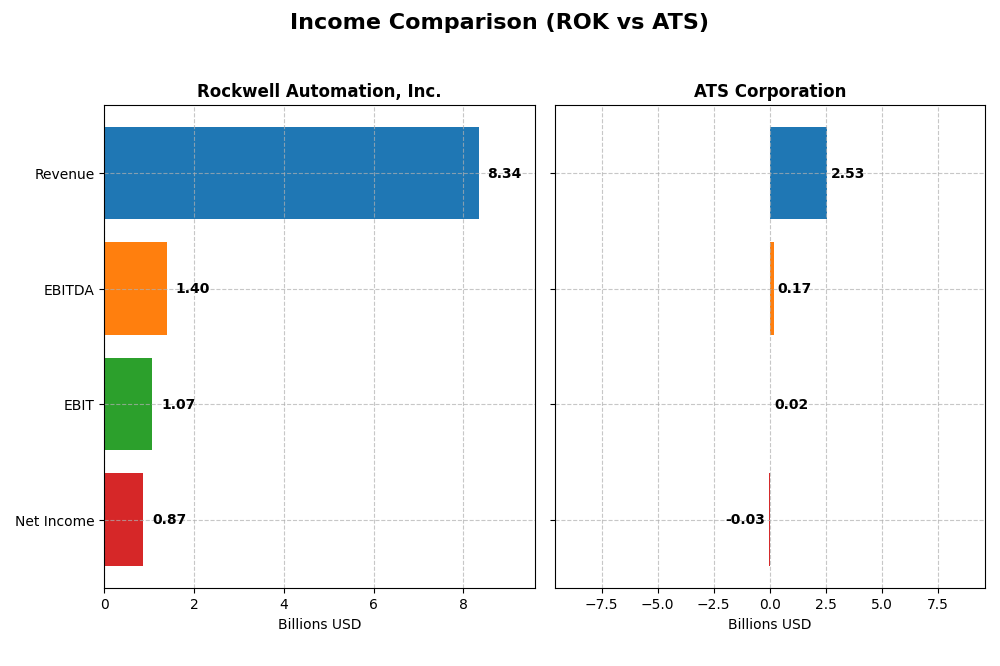
This table presents a side-by-side comparison of the most recent fiscal year income statement metrics for Rockwell Automation, Inc. and ATS Corporation.
| Metric | Rockwell Automation, Inc. (ROK) | ATS Corporation (ATS) |
|---|---|---|
| Market Cap | 46.1B USD | 2.8B CAD |
| Revenue | 8.34B USD | 2.53B CAD |
| EBITDA | 1.40B USD | 168M CAD |
| EBIT | 1.07B USD | 15.3M CAD |
| Net Income | 867M USD | -28.0M CAD |
| EPS | 7.69 USD | -0.29 CAD |
| Fiscal Year | 2025 | 2025 |
Income Statement Interpretations
Rockwell Automation, Inc.
Rockwell Automation’s revenue showed a modest increase of 0.97% in 2025, reaching $8.34B, while net income declined by 9.64% to $867M. Gross margin improved favorably to 48.14%, though net margin contracted to 10.42%. The recent year reflected slower revenue growth and a decline in EBIT and EPS, indicating emerging profitability pressures despite solid margins.
ATS Corporation
ATS experienced a 16.47% revenue decline to CAD 2.53B in 2025, with net income falling sharply to a loss of CAD 28M. Gross margin remained relatively low at 25.53%, and net margin turned negative at -1.11%. The latest year showed significant contraction in profitability and earnings per share, following a general trend of revenue volatility and margin compression over the period.
Which one has the stronger fundamentals?
Rockwell Automation maintains stronger fundamentals with higher and more stable gross and net margins and a positive net income, despite recent earnings declines. ATS struggles with negative profitability and sharper declines in net income and EPS, reflecting higher risk. Both companies show unfavorable overall income statement trends, but Rockwell’s margin strength and scale position it more favorably.
Financial Ratios Comparison
The table below presents the latest fiscal year-end financial ratios for Rockwell Automation, Inc. and ATS Corporation, enabling a straightforward comparison of their key financial metrics as of 2025.
| Ratios | Rockwell Automation, Inc. (ROK) | ATS Corporation (ATS) |
|---|---|---|
| ROE | 23.78% | -1.64% |
| ROIC | 13.71% | 0.09% |
| P/E | 45.33 | -125.28 |
| P/B | 10.78 | 2.06 |
| Current Ratio | 1.14 | 1.69 |
| Quick Ratio | 0.77 | 1.41 |
| D/E (Debt-to-Equity) | 1.00 | 1.00 |
| Debt-to-Assets | 32.51% | 36.79% |
| Interest Coverage | 9.12 | 0.09 |
| Asset Turnover | 0.74 | 0.55 |
| Fixed Asset Turnover | 6.95 | 5.66 |
| Payout ratio | 68.01% | 0% |
| Dividend yield | 1.50% | 0% |
Interpretation of the Ratios
Rockwell Automation, Inc.
Rockwell Automation exhibits mostly favorable profitability ratios, including a strong net margin of 10.42% and a return on equity of 23.78%, indicating effective management and profitability. However, valuation metrics such as a high P/E of 45.33 and P/B of 10.78 are less attractive. The company pays dividends with a 1.5% yield, reflecting moderate shareholder returns with manageable payout risks.
ATS Corporation
ATS Corporation shows weak profitability with negative net margin (-1.11%) and return on equity (-1.64%), signaling operational challenges. Liquidity ratios are favorable, with a current ratio of 1.69 and quick ratio of 1.41. The company does not pay dividends, likely due to negative earnings, focusing instead on reinvestment and growth. Interest coverage is very low at 0.16, raising concerns about debt servicing.
Which one has the best ratios?
Rockwell Automation holds an overall slightly favorable ratio profile driven by profitability and dividend payments, despite some valuation concerns. ATS Corporation’s ratios are slightly unfavorable, hindered by negative profitability and weak interest coverage, despite stronger liquidity. Thus, Rockwell Automation presents a more balanced and positive financial ratio picture.
Strategic Positioning
This section compares the strategic positioning of Rockwell Automation and ATS Corporation across market position, key segments, and exposure to technological disruption:
Rockwell Automation
- Leading industrial automation provider with strong market cap and competitive pressure from diverse sectors.
- Operates three segments: Intelligent Devices, Software & Control, and Lifecycle Services driving revenues.
- Invests in digital transformation with software, controls, and consulting services, adapting to technological changes.
ATS Corporation
- Smaller automation solutions provider with moderate competitive pressure in specialized markets.
- Focuses on automation system design, build, and services across life sciences, transportation, and energy markets.
- Provides automation software and connected factory solutions, focusing on real-time data and operational efficiency.
Rockwell Automation vs ATS Corporation Positioning
Rockwell Automation pursues a diversified approach with multiple segments and broad market exposure, offering scale advantages. ATS focuses on concentrated automation solutions and services in niche industries, which may limit scale but allows specialization.
Which has the best competitive advantage?
Rockwell Automation demonstrates a very favorable moat with growing ROIC above WACC, indicating durable competitive advantage. ATS shows a very unfavorable moat with declining ROIC below WACC, reflecting value destruction and weaker competitive positioning.
Stock Comparison
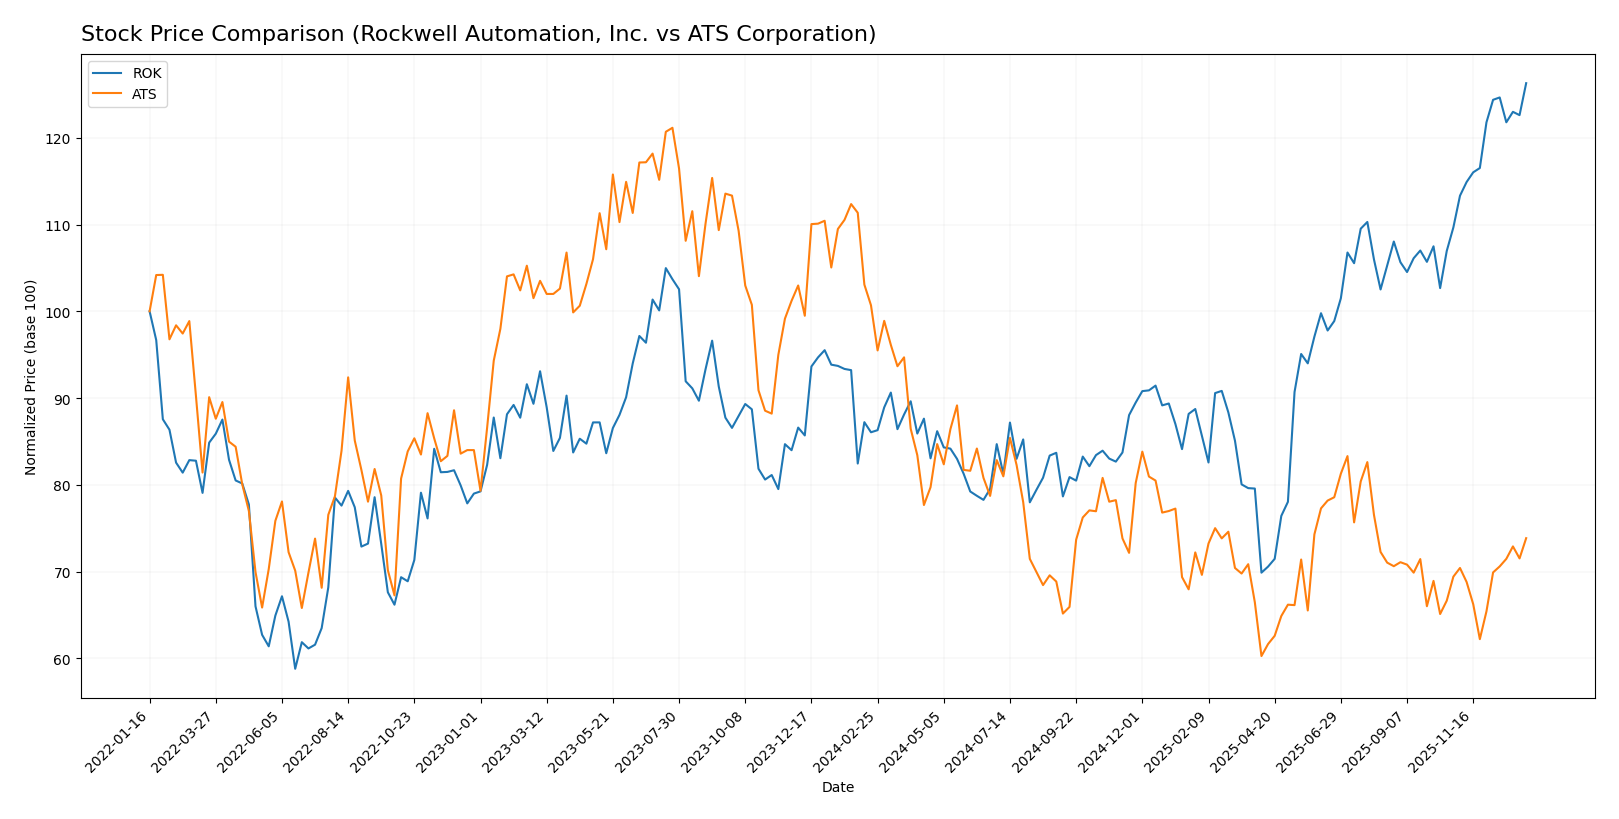
The stock price movements over the past year reveal a pronounced bullish acceleration for Rockwell Automation, Inc., while ATS Corporation has experienced a bearish trend despite some recent recovery.
Trend Analysis
Rockwell Automation, Inc. showed a strong bullish trend over the past 12 months, with a price increase of 46.76% and accelerating momentum. The stock reached a high of 410.53, with notable volatility (std deviation 44.57).
ATS Corporation exhibited a bearish trend with a 26.66% price decline over the same period, also accelerating downward. Volatility was low (std deviation 3.24), with the price ranging between 23.5 and 39.27.
Comparatively, Rockwell Automation delivered the highest market performance, outperforming ATS Corporation significantly in price appreciation and trend strength over the past year.
Target Prices
Analyst consensus target prices indicate a moderate upside potential for both Rockwell Automation, Inc. and ATS Corporation.
| Company | Target High | Target Low | Consensus |
|---|---|---|---|
| Rockwell Automation, Inc. | 470 | 380 | 421.57 |
| ATS Corporation | 34 | 34 | 34 |
For Rockwell Automation, the consensus target price of 421.57 USD is slightly above its current price of 410.53 USD, suggesting modest growth expectations. ATS Corporation’s consensus target of 34 USD is notably higher than the current price of 28.8 USD, indicating a more optimistic outlook from analysts.
Analyst Opinions Comparison
This section compares analysts’ ratings and grades for Rockwell Automation, Inc. and ATS Corporation:
Rating Comparison
ROK Rating
- Rating: B-, considered very favorable overall.
- Discounted Cash Flow Score: Moderate at 3, indicating balanced valuation.
- ROE Score: Very favorable at 5, showing high efficiency in generating profit.
- ROA Score: Favorable at 4, reflecting effective asset utilization.
- Debt To Equity Score: Very unfavorable at 1, implying high financial risk.
- Overall Score: Moderate at 3, suggesting average financial standing.
ATS Rating
- Rating: C, also considered very favorable overall.
- Discounted Cash Flow Score: Moderate at 3, suggesting similar valuation balance.
- ROE Score: Very unfavorable at 1, indicating low efficiency in profit generation.
- ROA Score: Very unfavorable at 1, showing poor asset utilization.
- Debt To Equity Score: Very unfavorable at 1, also indicating high financial risk.
- Overall Score: Moderate at 2, reflecting slightly weaker financial position.
Which one is the best rated?
Based strictly on the provided data, Rockwell Automation (ROK) has a higher overall rating (B- vs. C) and better financial efficiency scores (ROE and ROA) than ATS Corporation, despite both having similar risk from debt-to-equity ratios.
Scores Comparison
Here is a comparison of the financial scores for Rockwell Automation, Inc. and ATS Corporation:
ROK Scores
- Altman Z-Score: 5.32, indicating a safe zone with low bankruptcy risk.
- Piotroski Score: 8, classified as very strong financial health.
ATS Scores
- Altman Z-Score: 1.68, in the distress zone, signaling high bankruptcy risk.
- Piotroski Score: 3, considered very weak financial strength.
Which company has the best scores?
Based strictly on the provided data, Rockwell Automation shows significantly stronger financial health with a high Altman Z-Score in the safe zone and a very strong Piotroski Score. ATS displays weaker scores in both metrics, indicating greater financial risk.
Grades Comparison
This section presents the recent grades assigned to Rockwell Automation, Inc. and ATS Corporation by reputable financial institutions:
Rockwell Automation, Inc. Grades
The following table summarizes the latest grades from recognized grading companies for Rockwell Automation, Inc.:
| Grading Company | Action | New Grade | Date |
|---|---|---|---|
| Wells Fargo | Maintain | Equal Weight | 2026-01-07 |
| Barclays | Maintain | Overweight | 2026-01-07 |
| Goldman Sachs | Upgrade | Neutral | 2025-12-16 |
| Jefferies | Maintain | Buy | 2025-12-10 |
| Citigroup | Maintain | Buy | 2025-12-08 |
| Barclays | Maintain | Overweight | 2025-12-04 |
| Baird | Maintain | Outperform | 2025-11-21 |
| B of A Securities | Maintain | Buy | 2025-11-20 |
| JP Morgan | Maintain | Neutral | 2025-11-11 |
| Morgan Stanley | Maintain | Overweight | 2025-11-10 |
Rockwell Automation’s grades mostly range from Neutral to Buy, with several Overweight and Outperform ratings sustained over recent months.
ATS Corporation Grades
The following table summarizes the latest grades from recognized grading companies for ATS Corporation:
| Grading Company | Action | New Grade | Date |
|---|---|---|---|
| JP Morgan | Maintain | Neutral | 2024-08-13 |
| Goldman Sachs | Maintain | Sell | 2024-08-13 |
| JP Morgan | Maintain | Neutral | 2024-05-24 |
ATS Corporation’s grades are limited and indicate a more cautious stance with Neutral and Sell ratings maintained.
Which company has the best grades?
Rockwell Automation, Inc. has consistently received better grades with multiple Buy and Overweight ratings compared to ATS Corporation’s Neutral and Sell evaluations. This suggests a stronger positive outlook for Rockwell Automation, which may influence investor sentiment more favorably relative to ATS.
Strengths and Weaknesses
Below is a comparative overview of the strengths and weaknesses of Rockwell Automation, Inc. (ROK) and ATS Corporation (ATS) based on their recent financial and operational data.
| Criterion | Rockwell Automation, Inc. (ROK) | ATS Corporation (ATS) |
|---|---|---|
| Diversification | Strong diversification with three key segments: Intelligent Devices (3.76B USD), Lifecycle Services (2.20B USD), Software and Control (2.38B USD) in 2025 | Limited diversification; primarily focused on fewer product lines |
| Profitability | Favorable profitability metrics: Net margin 10.42%, ROE 23.78%, ROIC 13.71% | Unfavorable profitability: Net margin -1.11%, ROE -1.64%, ROIC 0.09% |
| Innovation | Consistent investment in software and control solutions enhancing competitive edge | Innovation less evident; declining profitability suggests challenges in value creation |
| Global presence | Established global footprint with diversified revenue streams | Smaller global reach, reflected in moderate asset turnover and regional focus |
| Market Share | Strong market share supported by growing ROIC and value creation (ROIC > WACC by 3.32%) | Shrinking market share indicated by declining ROIC (-7.92% relative to WACC) and value destruction |
In summary, Rockwell Automation demonstrates robust financial health, diversified product segments, and a durable competitive advantage with increasing profitability. ATS Corporation faces challenges with declining profitability and value destruction, warranting cautious consideration for investors.
Risk Analysis
Below is a comparative table summarizing key risks for Rockwell Automation, Inc. (ROK) and ATS Corporation (ATS) based on the most recent financial and market data from 2025.
| Metric | Rockwell Automation, Inc. (ROK) | ATS Corporation (ATS) |
|---|---|---|
| Market Risk | Beta 1.52, higher volatility risk | Beta 1.27, moderate volatility |
| Debt level | Debt-to-Equity neutral (1.0), Debt-to-Assets 32.5% | Debt-to-Equity neutral (1.0), Debt-to-Assets 36.8% |
| Regulatory Risk | US industrial regulations, moderate complexity | Canadian and US regulations, moderate complexity |
| Operational Risk | Global supply chain exposure, strong digital transformation | Automation project execution risks, weaker profitability |
| Environmental Risk | Exposure to eco-industrial markets, increasing sustainability demands | Growing focus on energy and nuclear markets, environmental compliance needed |
| Geopolitical Risk | Moderate, US and international markets | Moderate, exposure to North American and global markets |
The most impactful risks are operational and financial for both companies. Rockwell Automation shows strong profitability and financial health but carries market volatility risk (beta 1.52) and high valuation multiples, which may pressure returns. ATS faces significant operational challenges reflected in negative margins and low interest coverage (0.16), placing it in a financial distress zone with higher bankruptcy risk. Investors should weigh Rockwell’s stable financial footing against ATS’s turnaround risk and market uncertainties.
Which Stock to Choose?
Rockwell Automation, Inc. (ROK) shows a mixed income evolution with favorable profitability metrics like a 23.78% ROE and 13.71% ROIC, balanced by a high net debt to EBITDA of 2.27 and a moderate current ratio of 1.14. Its rating is very favorable with a B- grade, reflecting strong returns but some valuation concerns.
ATS Corporation (ATS) displays unfavorable income trends, including a negative net margin of -1.11% and a weak ROE of -1.64%. Despite a strong current ratio of 1.69, the company struggles with a high net debt to EBITDA ratio of 8.78 and very unfavorable profitability. ATS’s rating is very favorable at C, though its financial health remains fragile.
Considering ratings and financials, ROK might appeal to investors seeking quality and durable competitive advantage, given its very favorable moat and strong profitability. ATS may appear more suited for those with tolerance for risk and interest in turnaround potential, despite its weaker income and financial ratios.
Disclaimer: Investment carries a risk of loss of initial capital. The past performance is not a reliable indicator of future results. Be sure to understand risks before making an investment decision.
Go Further
I encourage you to read the complete analyses of Rockwell Automation, Inc. and ATS Corporation to enhance your investment decisions: