Home > Comparison > Financial Services > GS vs HOOD
The strategic rivalry between The Goldman Sachs Group, Inc. and Robinhood Markets, Inc. shapes the evolving landscape of financial services. Goldman Sachs operates as a capital-intensive, diversified financial powerhouse with strong investment banking and asset management arms. In contrast, Robinhood focuses on a high-growth, technology-driven retail trading platform targeting mass-market investors. This analysis will assess which model delivers the superior risk-adjusted return potential for a diversified portfolio amid shifting market dynamics.

Table of contents
Companies Overview
Goldman Sachs and Robinhood shape the modern financial services landscape with contrasting scale and strategies.
The Goldman Sachs Group, Inc.: Legacy Powerhouse in Capital Markets
Goldman Sachs dominates investment banking and asset management with diversified revenue streams. It earns mainly from advisory services, underwriting, and wealth management. In 2026, the firm sharpens its focus on expanding global markets and digital consumer wealth platforms, balancing tradition with innovation.
Robinhood Markets, Inc.: Disruptor of Retail Investing
Robinhood leads in retail brokerage by offering commission-free trading in stocks, ETFs, and cryptocurrencies. Its platform attracts a younger demographic through educational content and seamless user experience. The 2026 strategy centers on broadening financial education and enhancing cash management tools.
Strategic Collision: Similarities & Divergences
Goldman Sachs embraces a full-service, institutional-oriented model, while Robinhood pursues an open, tech-driven retail platform. They clash primarily in wealth management and client acquisition. Goldman’s scale and diversity contrast with Robinhood’s nimble innovation and user engagement, defining distinct risk and growth profiles for investors.
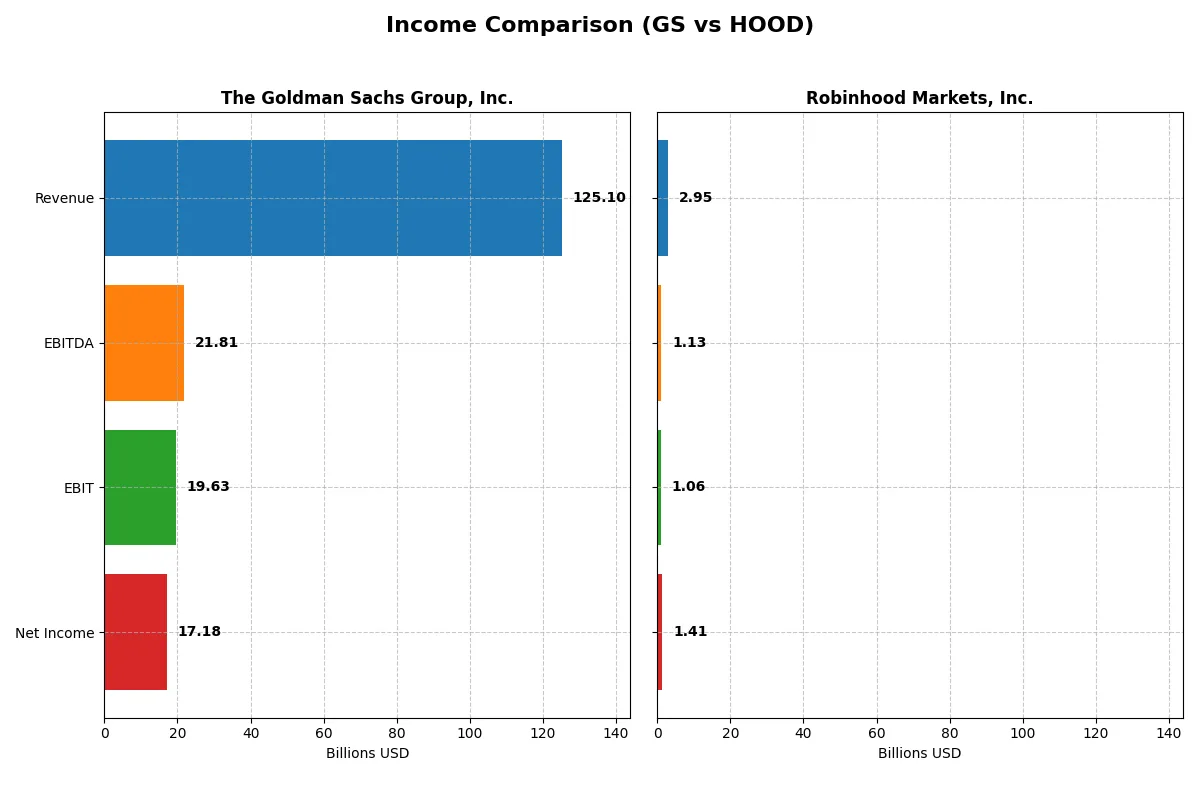
Income Statement Comparison
This data dissects the core profitability and scalability of both corporate engines to reveal who dominates the bottom line:
| Metric | The Goldman Sachs Group, Inc. (GS) | Robinhood Markets, Inc. (HOOD) |
|---|---|---|
| Revenue | 125.1B | 2.95B |
| Cost of Revenue | 67.9B | 504M |
| Operating Expenses | 37.5B | 1.39B |
| Gross Profit | 57.2B | 2.45B |
| EBITDA | 21.8B | 1.13B |
| EBIT | 19.6B | 1.06B |
| Interest Expense | 66.8B | 0 |
| Net Income | 17.2B | 1.41B |
| EPS | 51.95 | 1.6 |
| Fiscal Year | 2025 | 2024 |
Income Statement Analysis: The Bottom-Line Duel
This income statement comparison reveals each company’s operational efficiency and profitability momentum over recent years.
The Goldman Sachs Group, Inc. Analysis
Goldman Sachs’s revenue climbs steadily from 65B in 2021 to 125B in 2025, with net income showing volatility, peaking at 21B in 2021 then dipping and recovering to 16.3B in 2025. Gross margin remains solid at 45.7%, while net margin holds a favorable 13.7%, reflecting disciplined cost management despite a slight revenue decline in 2025.
Robinhood Markets, Inc. Analysis
Robinhood’s revenue surged from 958M in 2020 to 2.95B in 2024, with net income swinging from deep losses to 1.41B profit in 2024. Margins improved dramatically, with a gross margin of 82.9% and net margin at 47.8%, signaling accelerating operational leverage and a sharp turnaround in efficiency and profitability in the latest year.
Margin Strength vs. Growth Breakthrough
Goldman Sachs delivers steady scale and consistent margins, while Robinhood posts explosive revenue and profit growth with superior margins. Robinhood’s rapid margin expansion and profit turnaround position it as the fundamental winner on growth and efficiency. Investors favoring dynamic growth may find Robinhood’s profile more compelling, while Goldman Sachs offers stability and scale.
Financial Ratios Comparison
These vital ratios act as a diagnostic tool to expose the underlying fiscal health, valuation premiums, and capital efficiency of the companies analyzed:
| Ratios | The Goldman Sachs Group, Inc. (GS) | Robinhood Markets, Inc. (HOOD) |
|---|---|---|
| ROE | 13.7% | 17.7% |
| ROIC | 1.0% | 6.8% |
| P/E | 16.0 | 23.3 |
| P/B | 2.20 | 4.12 |
| Current Ratio | 1.21 | 1.39 |
| Quick Ratio | 1.21 | 1.39 |
| D/E | 4.95 | 0.94 |
| Debt-to-Assets | 34.2% | 28.5% |
| Interest Coverage | 0.29 | 0.00 |
| Asset Turnover | 0.069 | 0.113 |
| Fixed Asset Turnover | 3.47 | 21.23 |
| Payout ratio | 25.5% | 0.0% |
| Dividend yield | 1.59% | 0.0% |
| Fiscal Year | 2025 | 2024 |
Efficiency & Valuation Duel: The Vital Signs
Financial ratios act as a company’s DNA, uncovering hidden risks and operational strengths that drive investment decisions.
The Goldman Sachs Group, Inc.
Goldman Sachs shows a solid 13.7% net margin and a neutral 13.7% ROE, indicating stable profitability. Its P/E of 16.0 and P/B of 2.2 suggest fair valuation, neither cheap nor stretched. The 1.59% dividend yield rewards shareholders, balancing capital return with cautious reinvestment in core operations.
Robinhood Markets, Inc.
Robinhood boasts a strong 47.8% net margin and a favorable 17.7% ROE, reflecting operational efficiency. The higher P/E of 23.3 and P/B of 4.12 mark the stock as relatively expensive. It pays no dividend, focusing instead on growth through heavy R&D investment, evident from its elevated expense ratios.
Premium Valuation vs. Operational Safety
Robinhood offers higher profitability but trades at a premium, reflecting growth ambitions with no dividends. Goldman Sachs provides balanced valuation and consistent shareholder returns, signaling operational stability. Investors seeking growth may favor Robinhood’s profile; those prioritizing income and risk control may lean toward Goldman Sachs.
Which one offers the Superior Shareholder Reward?
I observe Goldman Sachs (GS) delivers a consistent dividend yield near 2–3% with a payout ratio around 25–50%, backed by solid free cash flow. GS pairs dividends with intense buybacks, enhancing total returns. Robinhood (HOOD) pays no dividends, reinvesting all cash into growth and R&D, but its negative free cash flow and volatile margins raise sustainability concerns. GS’s balanced distribution model offers a more reliable and attractive total return profile for 2026 investors.
Comparative Score Analysis: The Strategic Profile
The radar chart reveals the fundamental DNA and trade-offs of The Goldman Sachs Group, Inc. and Robinhood Markets, Inc., highlighting their core financial strengths and weaknesses:
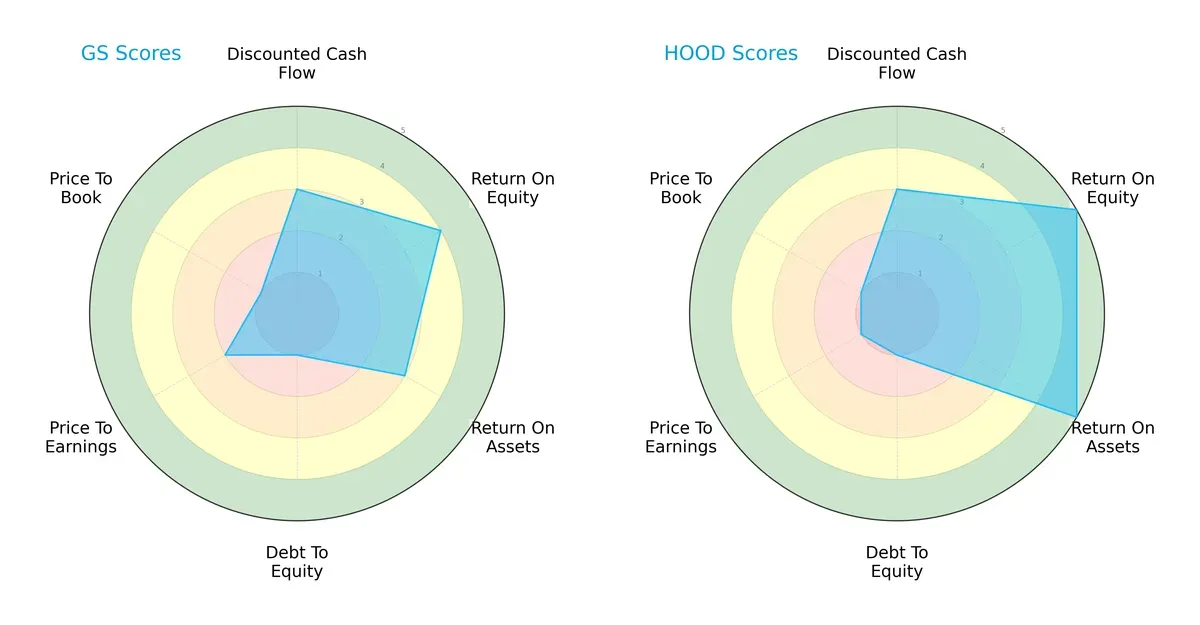
Goldman Sachs shows a moderate overall score with balanced DCF (3), ROE (4), and ROA (3) but struggles with debt-to-equity (1) and valuation metrics (P/E: 2, P/B: 1). Robinhood excels in profitability (ROE 5, ROA 5) but suffers from very unfavorable valuation scores (P/E 1, P/B 1) and weak debt management (1). Goldman Sachs offers a more balanced profile, while Robinhood relies heavily on operational efficiency despite valuation risks.
Bankruptcy Risk: Solvency Showdown
The Altman Z-Score delta indicates significant solvency risk differences between the firms:
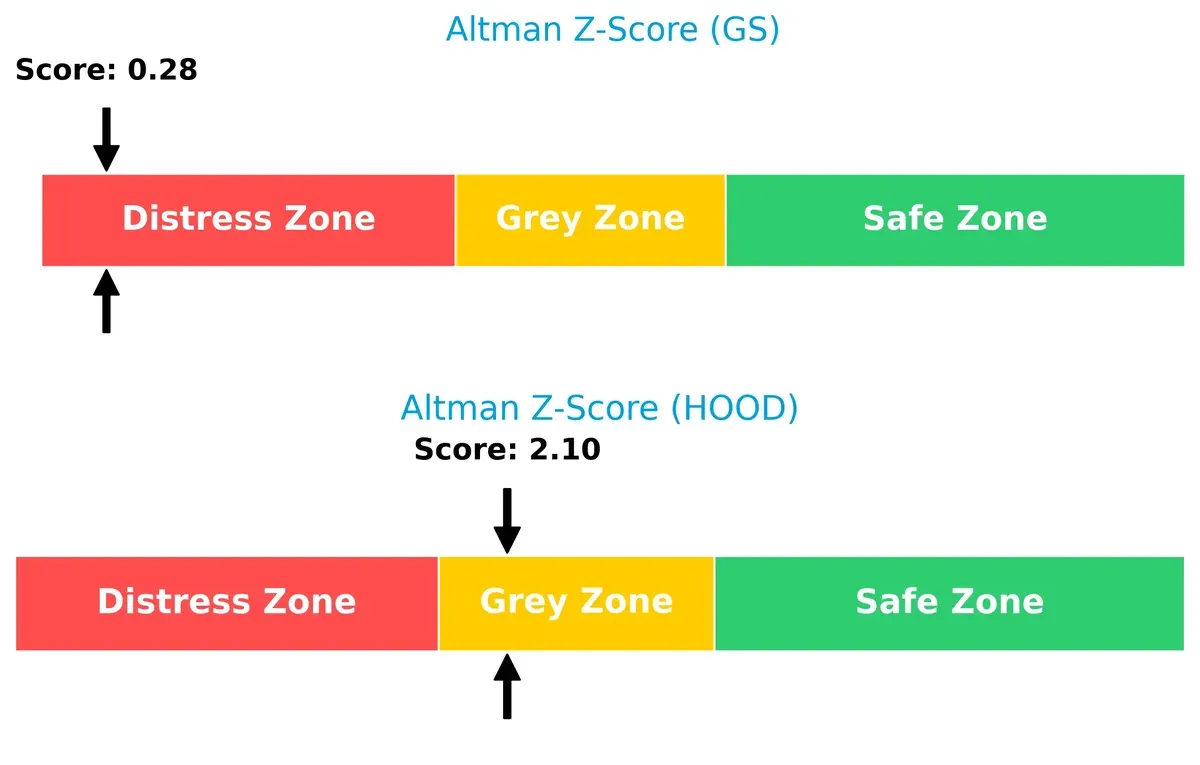
Goldman Sachs is deep in the distress zone (0.28), signaling high bankruptcy risk in adverse cycles. Robinhood sits in the grey zone (2.10), reflecting moderate default risk but better resilience. Investors should weigh Goldman’s financial fragility against Robinhood’s comparatively safer position.
Financial Health: Quality of Operations
Piotroski F-Scores reveal internal operational health contrasts:
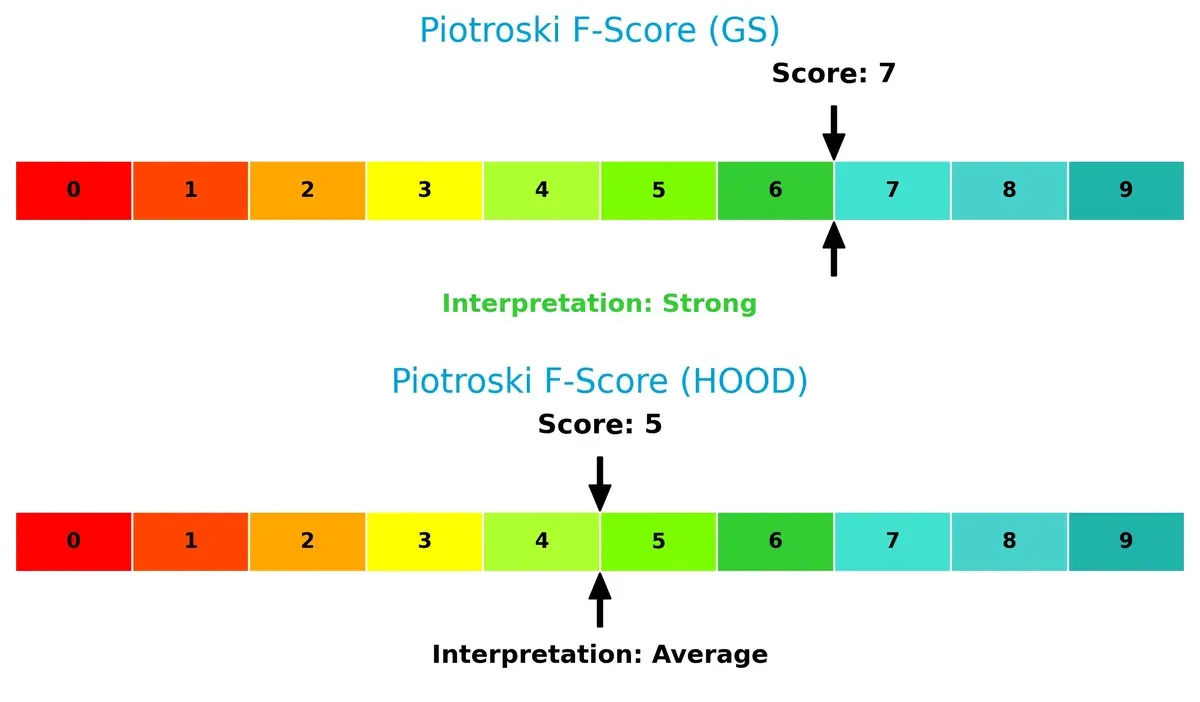
Goldman Sachs scores a strong 7, indicating robust profitability, leverage, and liquidity management. Robinhood’s average score of 5 flags potential red flags in operational efficiency or financial quality. This suggests Goldman Sachs currently maintains superior financial discipline relative to Robinhood.
How are the two companies positioned?
This section dissects the operational DNA of GS and HOOD by comparing their revenue distribution and internal strengths and weaknesses. The goal is to confront their economic moats to identify which model offers the most resilient, sustainable advantage today.
Revenue Segmentation: The Strategic Mix
This visual comparison dissects how The Goldman Sachs Group, Inc. and Robinhood Markets, Inc. diversify their income streams and where their primary sector bets lie:
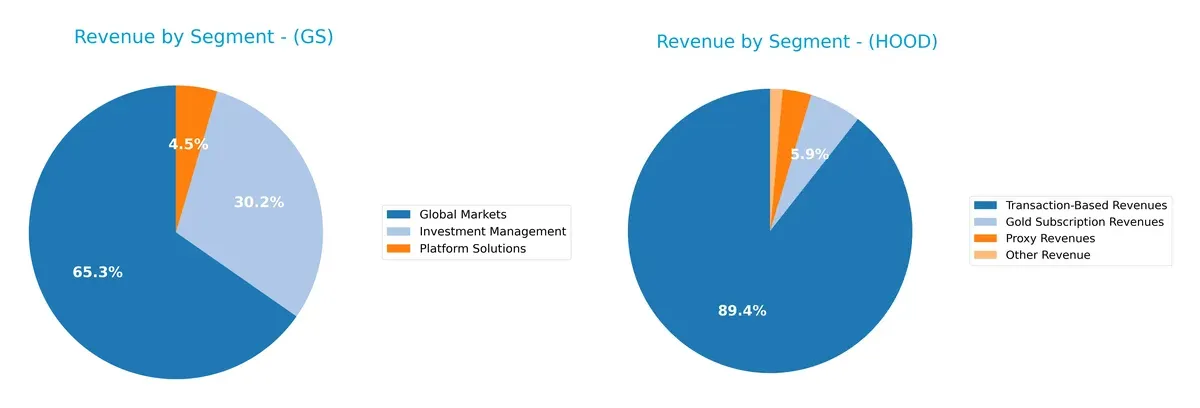
Goldman Sachs anchors revenue in Global Markets with $34.9B, complemented by $16.1B in Investment Management and $2.4B in Platform Solutions, revealing a balanced, multi-segment approach. Robinhood relies heavily on Transaction-Based Revenues, $1.65B in 2024, which dwarfs its $109M Gold Subscription and $60M Proxy Revenues. Goldman Sachs’s diversity mitigates concentration risk, while Robinhood’s focus pivots on transaction volume, exposing it to market volatility but leveraging ecosystem lock-in.
Strengths and Weaknesses Comparison
This table compares the Strengths and Weaknesses of Goldman Sachs and Robinhood Markets:
GS Strengths
- Diversified revenue streams across Investment Management, Global Markets, and Platform Solutions
- Strong global presence with significant Americas, EMEA, and Asia revenues
- Favorable quick ratio and fixed asset turnover indicate operational efficiency
HOOD Strengths
- High net margin and ROE show strong profitability
- Favorable debt-to-assets and interest coverage indicate solid financial health
- High fixed asset turnover highlights asset use efficiency
GS Weaknesses
- Unfavorable ROIC and interest coverage suggest capital allocation challenges
- Elevated debt-to-equity ratio raises leverage concerns
- Unfavorable asset turnover signals lower asset utilization
HOOD Weaknesses
- Unfavorable WACC and price-to-book ratio may pressure valuation
- Absence of dividend yield could deter income investors
- Unfavorable asset turnover points to efficiency issues
Goldman Sachs demonstrates broad diversification and global reach but faces challenges in capital efficiency and leverage. Robinhood excels in profitability and financial health yet shows valuation and efficiency risks. Both companies’ profiles reflect strategic trade-offs between scale and operational metrics.
The Moat Duel: Analyzing Competitive Defensibility
A structural moat is the sole barrier protecting long-term profits from relentless competition’s erosion. Let’s dissect the moats of two financial giants:
The Goldman Sachs Group, Inc.: Legacy Intangible Assets and Client Relationships
Goldman’s moat stems from deep client trust and a diversified financial services portfolio. It shows margin stability but declining ROIC signals weakening capital efficiency. New markets in digital assets pose growth and disruption risks in 2026.
Robinhood Markets, Inc.: Digital Network Effects and User Base Growth
Robinhood’s moat relies on rapid user acquisition and platform engagement. It delivers exceptional margin expansion and explosive revenue growth, yet its ROIC remains below cost of capital. Scalability and regulatory hurdles will shape its moat durability.
Traditional Prestige vs. Digital Disruption: Which Moat Holds?
Goldman Sachs’s intangible asset moat is broad but weakening, while Robinhood’s digital network effect moat is narrow but rapidly expanding. Goldman is better positioned to defend entrenched market share; Robinhood must prove sustainable profitability to fortify its position.
Which stock offers better returns?
Over the past year, The Goldman Sachs Group, Inc. and Robinhood Markets, Inc. showed significant price movements with contrasting recent trading dynamics.
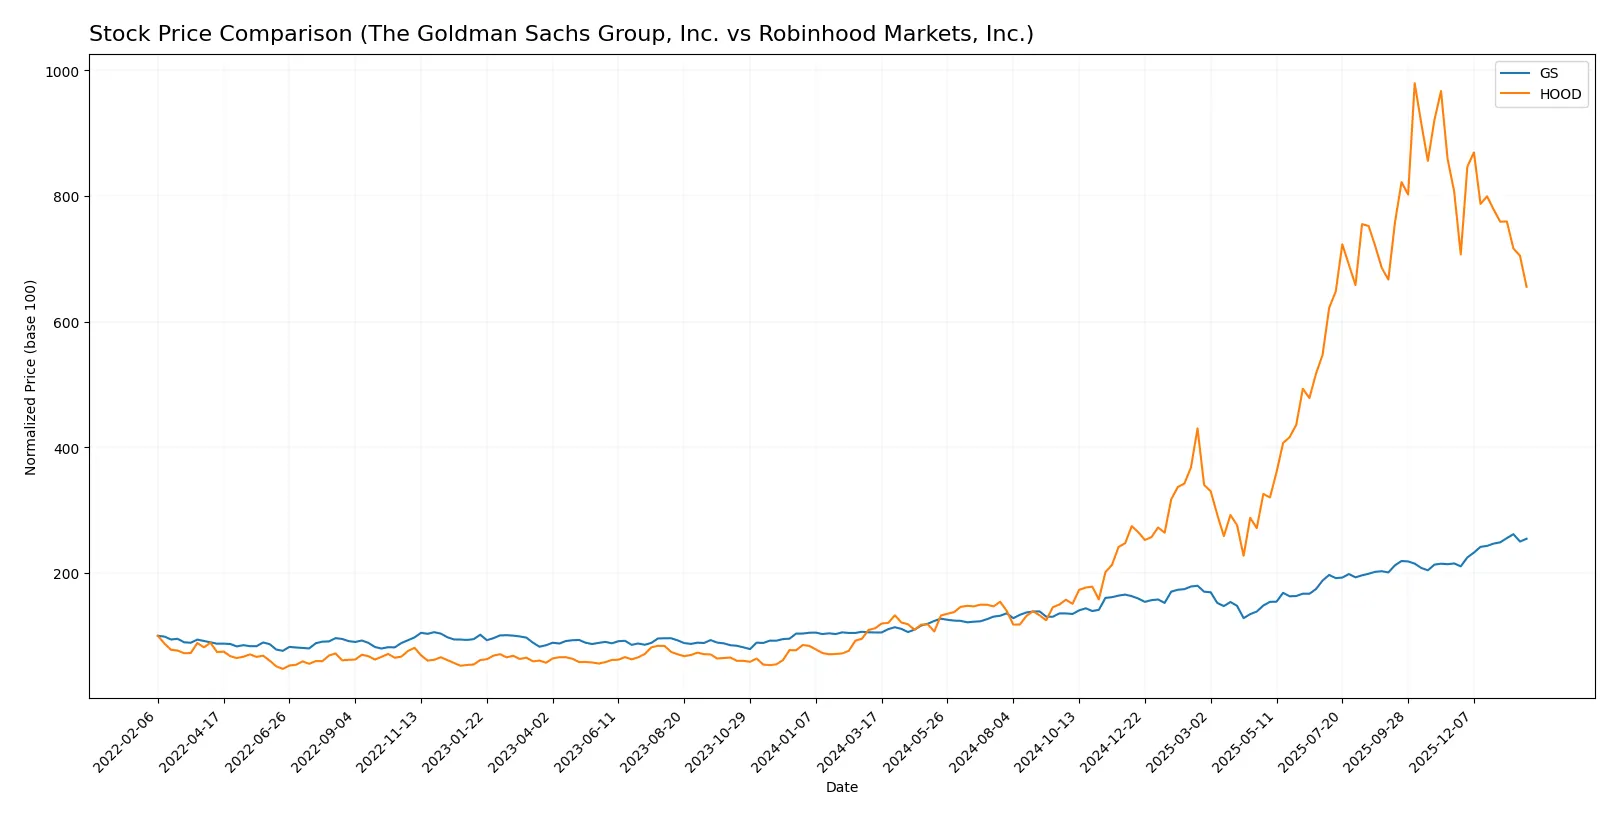
Trend Comparison
The Goldman Sachs Group, Inc. gained 142% over the past 12 months, showing a bullish trend with acceleration and notable volatility (std dev 149.43). Recent months saw an 18% rise with strong buyer dominance.
Robinhood Markets, Inc. surged 485% over the year, maintaining a bullish trend but with deceleration. Volatility was lower (std dev 41.47). However, recent months revealed an 18.8% decline and seller dominance.
Robinhood outperformed Goldman Sachs overall. Yet, Goldman Sachs showed recent positive momentum, while Robinhood’s recent trend reversed downward.
Target Prices
Analysts present a wide but confident target price range for both Goldman Sachs and Robinhood Markets.
| Company | Target Low | Target High | Consensus |
|---|---|---|---|
| The Goldman Sachs Group, Inc. | 604 | 1100 | 902.83 |
| Robinhood Markets, Inc. | 135 | 170 | 151.25 |
Analysts expect Goldman Sachs to trade moderately above current levels, reflecting steady confidence. Robinhood’s consensus target price suggests significant upside potential versus its current price.

Don’t Let Luck Decide Your Entry Point
Optimize your entry points with our advanced ProRealTime indicators. You’ll get efficient buy signals with precise price targets for maximum performance. Start outperforming now!
How do institutions grade them?
The Goldman Sachs Group, Inc. Grades
Below is a summary of recent institutional grades for The Goldman Sachs Group, Inc.:
| Grading Company | Action | New Grade | Date |
|---|---|---|---|
| RBC Capital | maintain | Sector Perform | 2026-01-20 |
| Keefe, Bruyette & Woods | maintain | Market Perform | 2026-01-16 |
| Wells Fargo | maintain | Overweight | 2026-01-16 |
| JP Morgan | maintain | Neutral | 2026-01-08 |
| Barclays | maintain | Overweight | 2026-01-05 |
| Keefe, Bruyette & Woods | maintain | Market Perform | 2025-12-17 |
| JP Morgan | downgrade | Neutral | 2025-10-21 |
| Freedom Capital Markets | upgrade | Hold | 2025-10-17 |
| Keefe, Bruyette & Woods | maintain | Market Perform | 2025-10-17 |
| Citigroup | maintain | Neutral | 2025-10-16 |
Robinhood Markets, Inc. Grades
This table presents the latest institutional grades assigned to Robinhood Markets, Inc.:
| Grading Company | Action | New Grade | Date |
|---|---|---|---|
| Needham | maintain | Buy | 2026-01-28 |
| Barclays | maintain | Overweight | 2026-01-08 |
| Morgan Stanley | maintain | Equal Weight | 2025-12-22 |
| Barclays | maintain | Overweight | 2025-12-12 |
| Cantor Fitzgerald | maintain | Overweight | 2025-12-11 |
| B of A Securities | maintain | Buy | 2025-12-10 |
| Needham | maintain | Buy | 2025-12-05 |
| Needham | maintain | Buy | 2025-11-26 |
| Citizens | maintain | Market Outperform | 2025-11-07 |
| Mizuho | maintain | Outperform | 2025-11-06 |
Which company has the best grades?
Robinhood Markets, Inc. consistently receives more positive ratings, including multiple Buy and Outperform grades. The Goldman Sachs Group, Inc. mostly holds Market Perform and Neutral ratings, with fewer positive upgrades. This could influence investor sentiment and portfolio positioning.
Risks specific to each company
The following categories identify critical pressure points and systemic threats facing both firms in the 2026 market environment:
1. Market & Competition
The Goldman Sachs Group, Inc.
- Faces intense competition from established financial institutions and fintech disruptors, pressuring margins and deal flow.
Robinhood Markets, Inc.
- Competes in a highly volatile retail brokerage space with numerous low-cost and crypto-focused rivals challenging market share.
2. Capital Structure & Debt
The Goldman Sachs Group, Inc.
- High debt-to-equity ratio (4.95) signals financial leverage risk and weak interest coverage (0.29), raising refinancing concerns.
Robinhood Markets, Inc.
- Lower debt-to-equity (0.94) and infinite interest coverage reduce solvency risk, but elevated WACC (14.43%) raises capital cost.
3. Stock Volatility
The Goldman Sachs Group, Inc.
- Beta of 1.32 indicates moderate sensitivity to market swings, typical for financial behemoths with diversified revenues.
Robinhood Markets, Inc.
- Beta at 2.45 signals very high volatility, reflecting investor sensitivity to growth prospects and regulatory shifts.
4. Regulatory & Legal
The Goldman Sachs Group, Inc.
- Subject to stringent banking and securities regulations globally, increasing compliance costs and legal exposure.
Robinhood Markets, Inc.
- Faces heightened regulatory scrutiny around retail trading practices and crypto offerings, posing operational and reputational risks.
5. Supply Chain & Operations
The Goldman Sachs Group, Inc.
- Relies on complex financial infrastructure and technology systems, with operational risks mitigated by scale and expertise.
Robinhood Markets, Inc.
- Dependent on digital platform stability and cybersecurity resilience, with smaller scale posing greater operational vulnerability.
6. ESG & Climate Transition
The Goldman Sachs Group, Inc.
- Increasing pressure to finance sustainable projects while managing climate-related financial risks in asset portfolios.
Robinhood Markets, Inc.
- ESG risks lower given digital focus, but growing investor demand for transparency and ethical data use adds pressure.
7. Geopolitical Exposure
The Goldman Sachs Group, Inc.
- Broad global footprint exposes it to geopolitical tensions, trade policies, and cross-border capital flow disruptions.
Robinhood Markets, Inc.
- Primarily US-focused, limiting geopolitical risk but sensitive to domestic policy shifts and market sentiment fluctuations.
Which company shows a better risk-adjusted profile?
Goldman Sachs faces significant financial leverage risks and regulatory complexities, increasing its vulnerability despite scale advantages. Robinhood’s high stock volatility and regulatory pressures heighten operational risk, but its stronger solvency metrics and lower debt improve resilience. Robinhood’s Altman Z-score in the grey zone versus Goldman Sachs’s distress zone confirms a comparatively better risk-adjusted profile. The stark contrast in interest coverage ratios—0.29 for Goldman Sachs versus infinite for Robinhood—underscores my concern about Goldman’s debt servicing capacity amid market stress.
Final Verdict: Which stock to choose?
The Goldman Sachs Group, Inc. (GS) demonstrates unmatched resilience as a traditional financial powerhouse with strong operational efficiency. Its superpower lies in consistent profitability and robust income quality. A point of vigilance remains its declining ROIC, signaling caution for value-focused investors. GS fits well within conservative or dividend-oriented portfolios seeking steady income.
Robinhood Markets, Inc. (HOOD) boasts a strategic moat rooted in rapid revenue growth and a compelling recurring revenue model. Its superior ROE and earnings yield highlight effective capital use despite a less favorable cost of capital. Compared to GS, HOOD offers higher growth potential with moderate stability, suiting growth-at-a-reasonable-price (GARP) or aggressive growth portfolios.
If you prioritize steady income and proven operational efficiency, GS is the compelling choice due to its reliable earnings and favorable income statement metrics. However, if you seek high growth and capital appreciation with a tolerance for volatility, HOOD offers better upside potential and a more dynamic growth trajectory. Both present analytical scenarios with distinct risk-reward profiles aligned to specific investor strategies.
Disclaimer: Investment carries a risk of loss of initial capital. The past performance is not a reliable indicator of future results. Be sure to understand risks before making an investment decision.
Go Further
I encourage you to read the complete analyses of The Goldman Sachs Group, Inc. and Robinhood Markets, Inc. to enhance your investment decisions: