Home > Comparison > Financial Services > SCHW vs HOOD
The strategic rivalry between The Charles Schwab Corporation and Robinhood Markets defines the current trajectory of the financial services sector. Schwab operates as a capital-intensive wealth management and brokerage powerhouse with a broad service portfolio. In contrast, Robinhood disrupts as a high-growth digital trading platform targeting retail investors. This analysis will determine which model offers a superior risk-adjusted return for a diversified portfolio amid evolving market dynamics.
Table of contents
Companies Overview
The Charles Schwab Corporation and Robinhood Markets, Inc. each wield significant influence in the evolving financial services landscape.
The Charles Schwab Corporation: Full-Service Wealth Manager
The Charles Schwab Corporation stands as a diversified financial powerhouse with core revenue from wealth management, brokerage, banking, and advisory services. Its two segments—Investor Services and Advisor Services—drive income through retail brokerage, asset management, and trust services. In 2026, Schwab emphasizes expanding personalized advice and integrated banking solutions, reinforcing its comprehensive client service model.
Robinhood Markets, Inc.: Digital Brokerage Innovator
Robinhood Markets, Inc. operates a technology-driven investment platform focused on retail investors. It earns primarily from commission-free trading in stocks, ETFs, options, and cryptocurrencies, complemented by educational content and cash management. In 2026, Robinhood prioritizes user engagement and product diversification, aiming to deepen market penetration among younger, tech-savvy investors.
Strategic Collision: Similarities & Divergences
Schwab champions a full-service, advice-centric approach with broad product access, while Robinhood pursues a lean, digital-first model emphasizing low-cost and accessibility. Both compete fiercely for retail investor attention, but Schwab leverages scale and trust, whereas Robinhood bets on innovation and user experience. Their investment profiles diverge sharply: Schwab offers stability and diversification, Robinhood embodies growth with higher volatility.
Income Statement Comparison
The following data dissects the core profitability and scalability of both corporate engines to reveal who dominates the bottom line:
| Metric | The Charles Schwab Corporation (SCHW) | Robinhood Markets, Inc. (HOOD) |
|---|---|---|
| Revenue | 26.8B | 2.95B |
| Cost of Revenue | 2.92B | 504M |
| Operating Expenses | 12.5B | 1.39B |
| Gross Profit | 23.9B | 2.45B |
| EBITDA | 12.8B | 1.13B |
| EBIT | 11.5B | 1.06B |
| Interest Expense | 3.75B | 0 |
| Net Income | 8.85B | 1.41B |
| EPS | 4.68 | 1.60 |
| Fiscal Year | 2025 | 2024 |
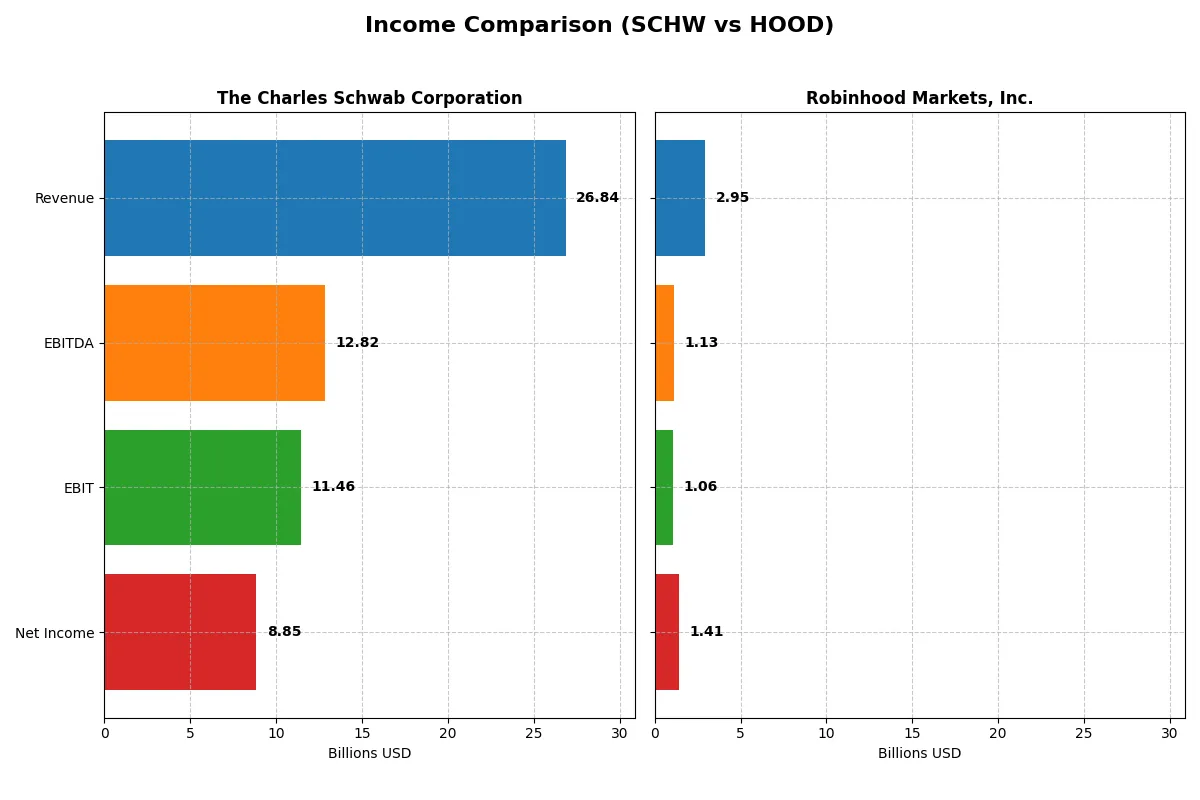
Income Statement Analysis: The Bottom-Line Duel
This income statement comparison reveals which company operates with greater efficiency and drives stronger profitability in their business engines.
The Charles Schwab Corporation Analysis
Schwab’s revenue grew steadily from $19B in 2021 to $26.8B in 2025, with net income surging from $5.4B to $8.9B. Its gross margin remains robust at 89%, while net margin stands at a healthy 33%. The 2025 metrics highlight Schwab’s operational momentum, with a 49% EBIT growth and a 56% EPS jump, signaling strong profit expansion despite rising interest expenses.
Robinhood Markets, Inc. Analysis
Robinhood’s revenue rocketed from $958M in 2020 to $2.95B in 2024, accompanied by a dramatic turnaround from a -$541M net loss in 2023 to a $1.41B net profit in 2024. Its gross margin at 83% and net margin near 48% show efficient cost control and profitability. The latest year marks explosive growth in net margin (+265%) and EPS (+357%), reflecting rapid scaling and improving bottom-line strength.
Margin Stability vs. Rapid Growth
Schwab delivers consistent, high-margin earnings with steady revenue and profit growth, showcasing a mature, efficient model. Robinhood, however, exhibits extraordinary top-line and bottom-line momentum, turning losses into sizable profits with exceptional margin improvements. Investors valuing stability may prefer Schwab’s proven efficiency, while those seeking high-growth potential might find Robinhood’s dynamic trajectory more appealing.
Financial Ratios Comparison
These vital ratios act as a diagnostic tool to expose the underlying fiscal health, valuation premiums, and capital efficiency of each company:
| Ratios | The Charles Schwab Corporation (SCHW) | Robinhood Markets, Inc. (HOOD) |
|---|---|---|
| ROE | 12.3% (2024) | 17.7% (2024) |
| ROIC | 5.6% (2024) | 6.8% (2024) |
| P/E | 22.8 (2024) | 23.3 (2024) |
| P/B | 2.8 (2024) | 4.1 (2024) |
| Current Ratio | 0.54 (2024) | 1.39 (2024) |
| Quick Ratio | 0.54 (2024) | 1.39 (2024) |
| D/E | 0.93 (2024) | 0.94 (2024) |
| Debt-to-Assets | 9.4% (2024) | 28.5% (2024) |
| Interest Coverage | 1.20 (2024) | 0 (2024) |
| Asset Turnover | 0.05 (2024) | 0.11 (2024) |
| Fixed Asset Turnover | 6.6 (2024) | 21.2 (2024) |
| Payout Ratio | 21.6% (2025) | 0% (2024) |
| Dividend Yield | 1.08% (2025) | 0% (2024) |
| Fiscal Year | 2025 | 2024 |
Efficiency & Valuation Duel: The Vital Signs
Ratios serve as a company’s DNA, exposing hidden risks and operational strengths that shape investor confidence and valuation.
The Charles Schwab Corporation
Schwab shows a solid net margin near 33%, indicating operational efficiency despite a zero ROE and ROIC, which raise concerns. Its P/E of 20 marks a neutral valuation, neither cheap nor stretched. The company pays a modest 1.08% dividend, balancing shareholder returns with reinvestment prudence, though some liquidity ratios remain unfavorable.
Robinhood Markets, Inc.
Robinhood posts a robust 47.8% net margin and a favorable 17.7% ROE, signaling strong profitability. Its P/E of 23.27 suggests a fairly valued, though slightly premium, stock. The firm skips dividends, investing heavily in R&D (27.7% of revenue) and growth initiatives, reflecting a reinvestment strategy amid moderately favorable liquidity and leverage metrics.
Profitability Edge vs. Valuation Discipline
Robinhood outperforms Schwab on profitability and reinvestment, while Schwab offers steadier dividend income with a more moderate valuation. Schwab suits investors favoring income and stability; Robinhood appeals to those prioritizing growth and operational upside.
Which one offers the Superior Shareholder Reward?
I observe The Charles Schwab Corporation (SCHW) pays dividends with a 1.08% yield and a moderate 21.6% payout ratio in 2025, supported by steady free cash flow. SCHW also maintains consistent buybacks, enhancing total shareholder return sustainably. Robinhood Markets, Inc. (HOOD) pays no dividends, focusing on reinvestment and growth, but reports negative free cash flow and operating cash flow in recent years, raising sustainability concerns. HOOD’s buybacks are minimal or absent, limiting immediate shareholder rewards. Given SCHW’s balanced dividend, buyback strategy, and stable cash flow, I conclude SCHW offers a more attractive total return profile for investors in 2026.
Comparative Score Analysis: The Strategic Profile
The radar chart reveals the fundamental DNA and trade-offs of The Charles Schwab Corporation and Robinhood Markets, Inc., highlighting their core financial strengths and vulnerabilities:
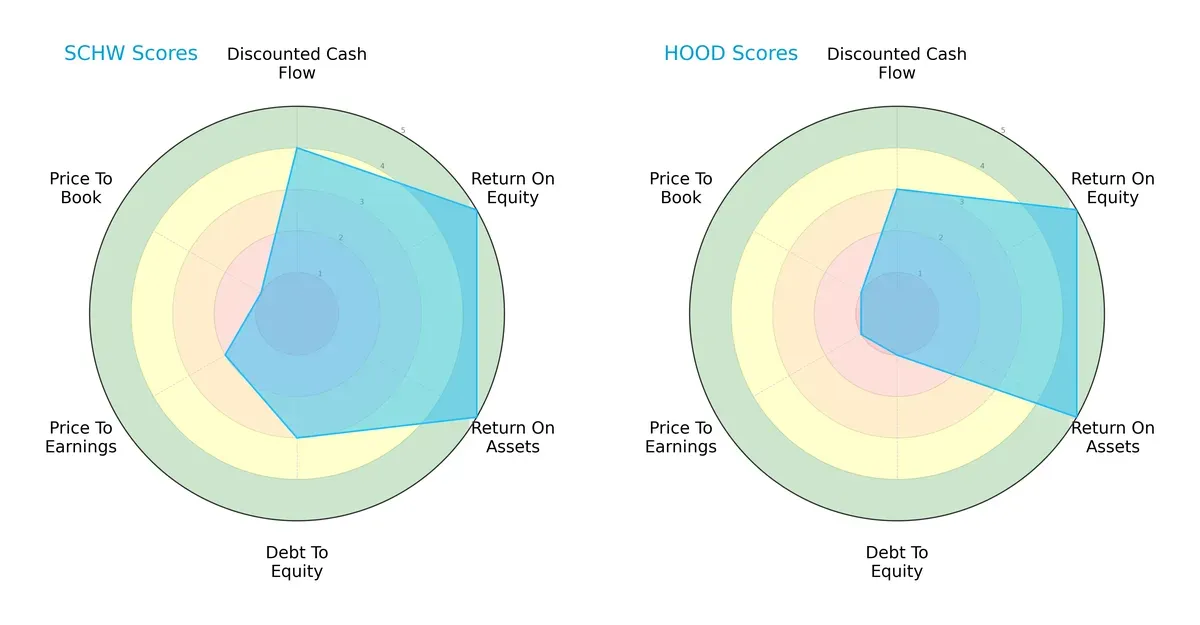
Schwab presents a more balanced profile with strong DCF (4) and return metrics (ROE and ROA at 5), coupled with moderate debt management (3). Robinhood matches Schwab’s top returns but suffers from weak debt control (1) and poor valuation scores (PE and PB at 1), indicating reliance on profitability without financial stability or favorable pricing. Schwab’s diversified strengths offer a more stable investment foundation.
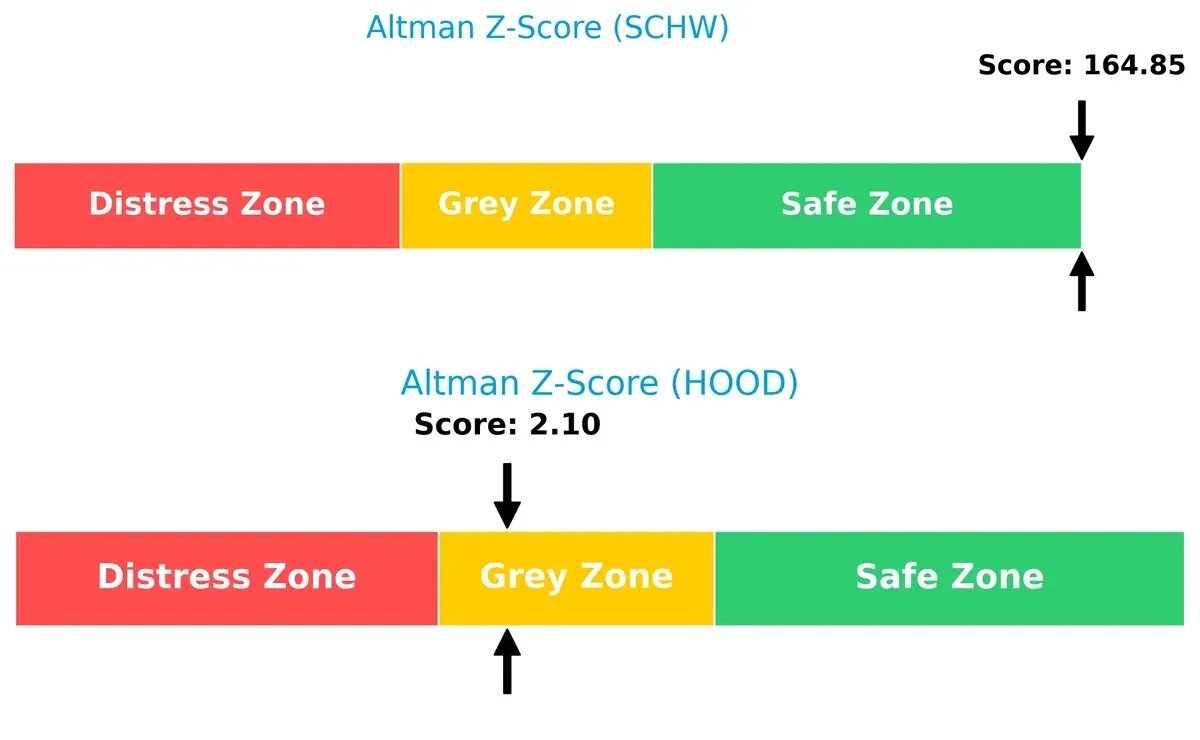
Bankruptcy Risk: Solvency Showdown
The Altman Z-Score gap signals Schwab’s superior long-term solvency with a safe-zone score of 165 versus Robinhood’s grey-zone 2.1, underscoring Schwab’s robust financial resilience while Robinhood faces moderate bankruptcy risk in this cycle:
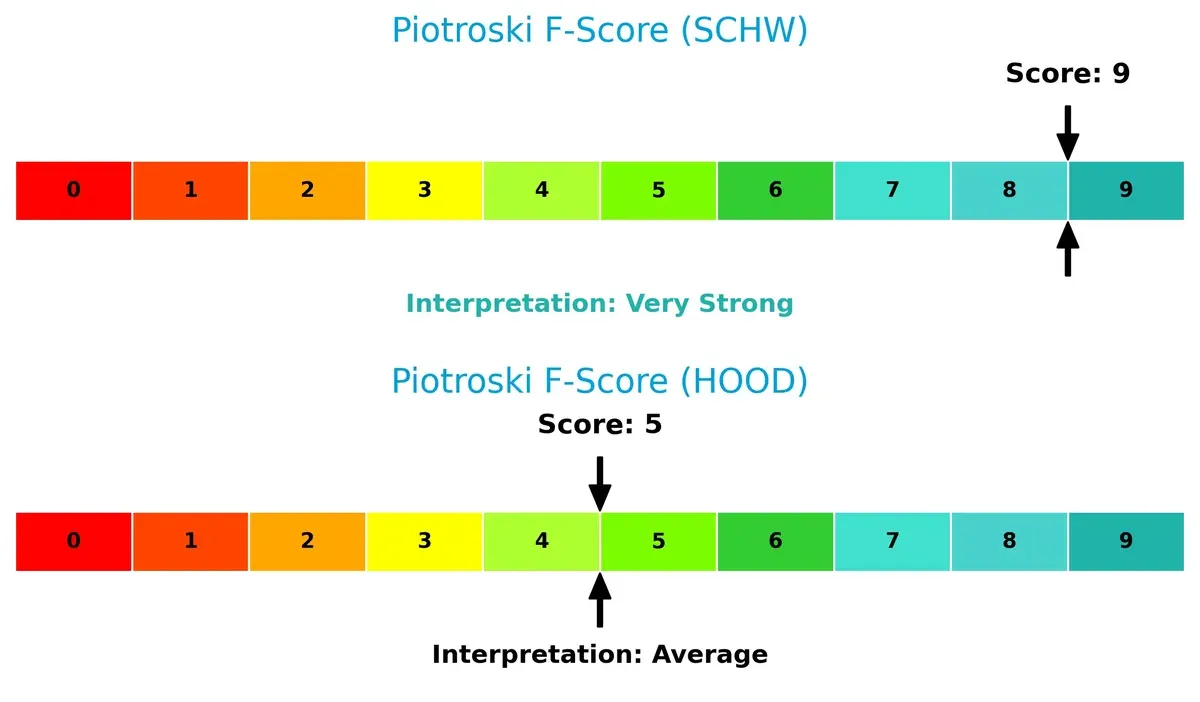
Financial Health: Quality of Operations
Schwab achieves a peak Piotroski F-Score of 9, indicating very strong operational health and internal controls. Robinhood’s 5 signals average financial quality and potential red flags in profitability or liquidity compared to Schwab’s excellence:
How are the two companies positioned?
This section dissects the operational DNA of Schwab and Robinhood by comparing their revenue distribution and internal dynamics. The goal is to confront their economic moats to reveal which model offers the most resilient competitive advantage.
Revenue Segmentation: The Strategic Mix
The following visual comparison dissects how The Charles Schwab Corporation and Robinhood Markets diversify their income streams and where their primary sector bets lie:
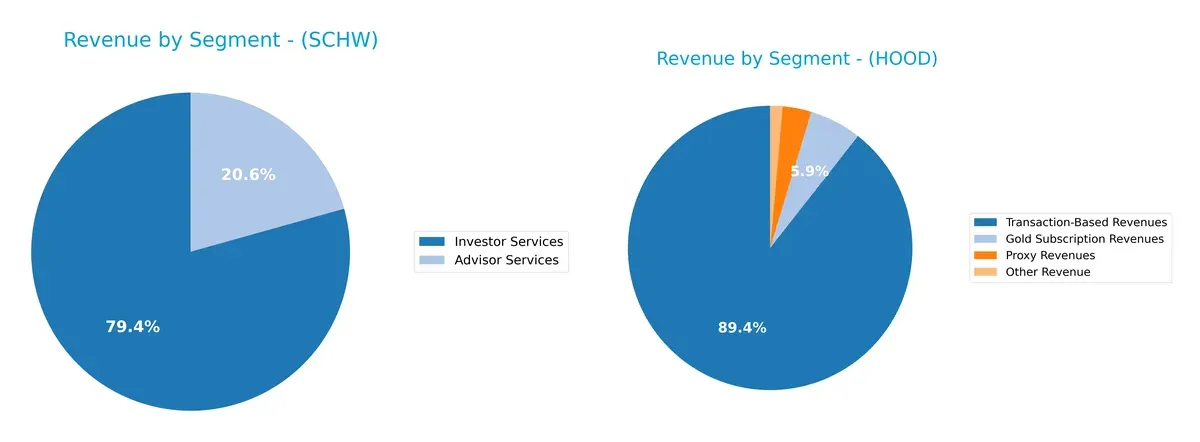
Charles Schwab anchors its revenue in Investor Services with $15.6B in 2024, complemented by $4.0B from Advisor Services, showing moderate diversification. Robinhood, by contrast, pivots heavily on Transaction-Based Revenues, earning $1.65B in 2024, while smaller segments like Gold Subscriptions ($109M) and Proxy Revenues ($60M) play minor roles. Schwab’s mix suggests ecosystem lock-in, reducing concentration risk. Robinhood’s reliance signals vulnerability to trading volume shifts.
Strengths and Weaknesses Comparison
This table compares the strengths and weaknesses of The Charles Schwab Corporation and Robinhood Markets, Inc.:
SCHW Strengths
- Strong net margin at 33%
- Favorable debt to equity and debt to assets ratios
- Large, diversified revenue from Advisor and Investor Services
HOOD Strengths
- Higher net margin at 48%
- Favorable return on equity at 18%
- Strong quick ratio and interest coverage
- High fixed asset turnover
SCHW Weaknesses
- Unfavorable ROE and ROIC
- Poor liquidity ratios (current and quick ratio)
- Unavailable WACC
- Unfavorable asset turnover metrics
HOOD Weaknesses
- Unfavorable WACC at 14.43%
- High price-to-book ratio at 4.12
- Zero dividend yield
- Unfavorable asset turnover
The Charles Schwab shows strength in profitability and conservative leverage but faces liquidity and efficiency challenges. Robinhood excels in profitability and asset utilization but carries risks from high cost of capital and valuation metrics. Both must address these weaknesses to sustain competitive advantage.
The Moat Duel: Analyzing Competitive Defensibility
A structural moat is the only reliable barrier protecting long-term profits from relentless competitive erosion. Let’s dissect how Schwab and Robinhood defend their turf:
The Charles Schwab Corporation: Intangible Asset Moat
Schwab’s moat hinges on trusted brand and regulatory licenses, reflected in steady margin stability and 33% net margin. However, declining ROIC signals pressure on capital efficiency. Expansion in advisory services offers some moat deepening in 2026.
Robinhood Markets, Inc.: Network Effects Moat
Robinhood leverages a platform-driven network effect, fueling explosive 58% revenue growth and surging profitability. Unlike Schwab, it struggles with value destruction (ROIC < WACC). New crypto and cash management products could bolster defensibility.
Brand Trust vs. Platform Network Effects: The Moat Battle
Schwab holds a deeper moat through established brand and regulatory entrenchment despite waning capital returns. Robinhood’s network effect drives rapid growth but lacks sustainable value creation. Schwab is better positioned to defend its market share long-term.
Which stock offers better returns?
The past year showed distinct price dynamics: SCHW gained steadily with accelerating momentum, while HOOD surged sharply overall but faced recent downward pressure and decelerating gains.
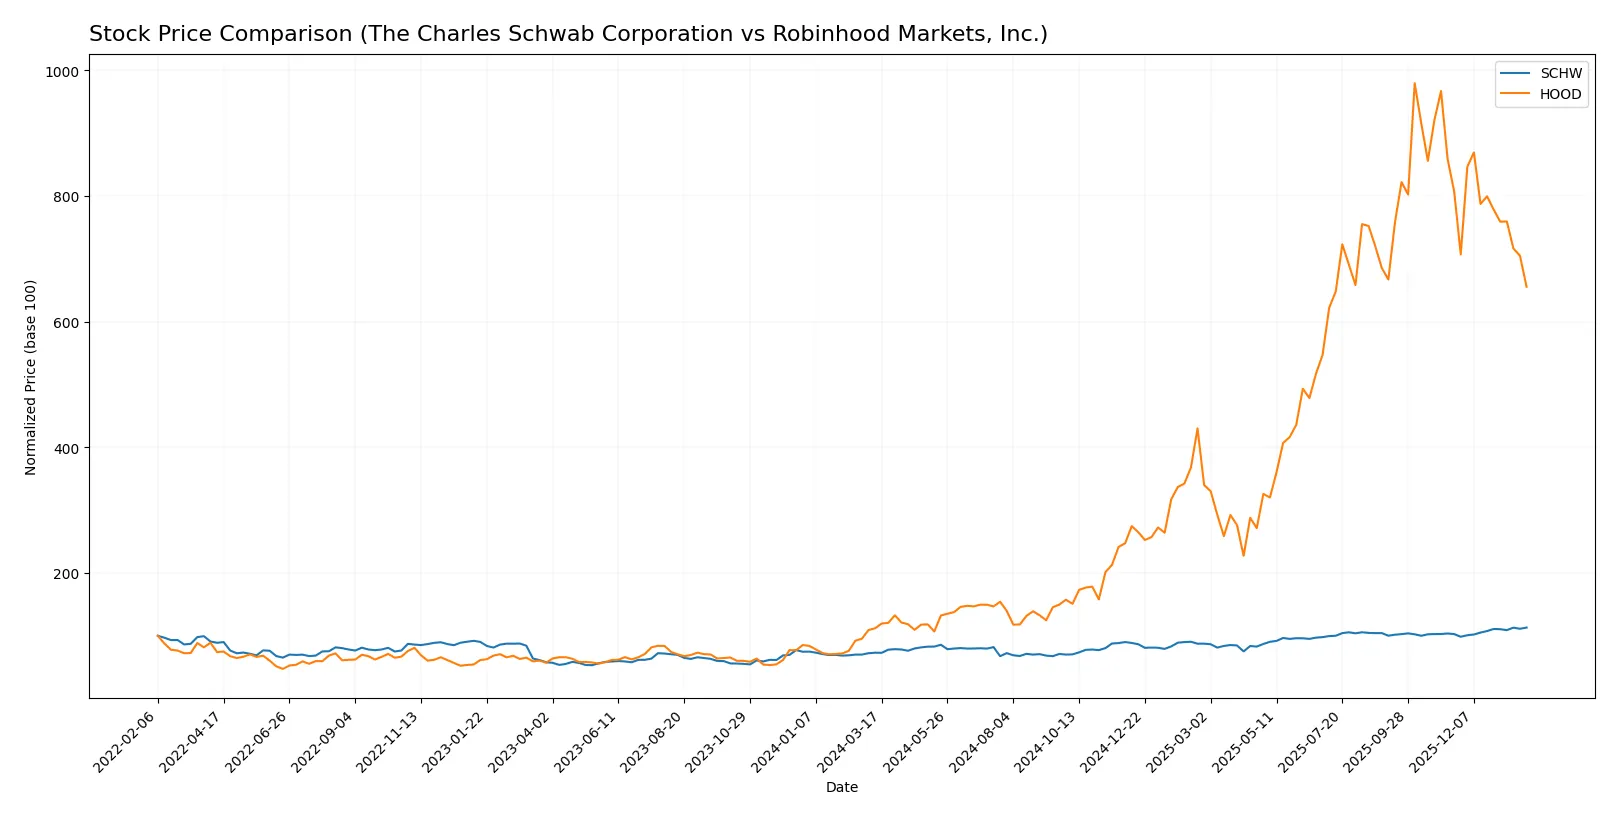
Trend Comparison
The Charles Schwab Corporation (SCHW) posted a bullish 54.71% gain over 12 months with accelerating momentum and moderate volatility (11.65 std deviation). Recent months show a 10.1% rise and steady upward slope.
Robinhood Markets, Inc. (HOOD) delivered a strong 485.18% bullish gain over the year but with decelerating trend and high volatility (41.47 std deviation). Recently, it declined 18.79% with a notable negative slope.
Comparing both, HOOD outperformed SCHW significantly over the full year despite recent weakness. SCHW’s trend remains steadily bullish, while HOOD shows higher risk and recent correction.
Target Prices
Analysts present a bullish consensus for both The Charles Schwab Corporation and Robinhood Markets, Inc.
| Company | Target Low | Target High | Consensus |
|---|---|---|---|
| The Charles Schwab Corporation | 105 | 148 | 122.78 |
| Robinhood Markets, Inc. | 135 | 170 | 151.25 |
The consensus target prices for SCHW and HOOD exceed their current prices by 18% and 52% respectively, signaling strong expected upside. This reflects robust growth optimism despite market volatility.

Don’t Let Luck Decide Your Entry Point
Optimize your entry points with our advanced ProRealTime indicators. You’ll get efficient buy signals with precise price targets for maximum performance. Start outperforming now!
How do institutions grade them?
The Charles Schwab Corporation Grades
Below is a recent summary of grades issued by reputable firms for Charles Schwab.
| Grading Company | Action | New Grade | Date |
|---|---|---|---|
| Barclays | Maintain | Overweight | 2026-01-26 |
| Barclays | Maintain | Overweight | 2026-01-22 |
| TD Cowen | Maintain | Buy | 2026-01-22 |
| UBS | Maintain | Buy | 2026-01-22 |
| Truist Securities | Maintain | Buy | 2026-01-22 |
| Piper Sandler | Maintain | Neutral | 2026-01-14 |
| TD Cowen | Maintain | Buy | 2026-01-14 |
| Citizens | Maintain | Market Outperform | 2026-01-12 |
| Barclays | Maintain | Overweight | 2026-01-08 |
| Truist Securities | Maintain | Buy | 2026-01-07 |
Robinhood Markets, Inc. Grades
This table lists recent grades provided by established grading companies for Robinhood.
| Grading Company | Action | New Grade | Date |
|---|---|---|---|
| Needham | Maintain | Buy | 2026-01-28 |
| Barclays | Maintain | Overweight | 2026-01-08 |
| Morgan Stanley | Maintain | Equal Weight | 2025-12-22 |
| Barclays | Maintain | Overweight | 2025-12-12 |
| Cantor Fitzgerald | Maintain | Overweight | 2025-12-11 |
| B of A Securities | Maintain | Buy | 2025-12-10 |
| Needham | Maintain | Buy | 2025-12-05 |
| Needham | Maintain | Buy | 2025-11-26 |
| Citizens | Maintain | Market Outperform | 2025-11-07 |
| Mizuho | Maintain | Outperform | 2025-11-06 |
Which company has the best grades?
Charles Schwab consistently receives high marks, mainly Buy and Overweight ratings from top-tier firms. Robinhood also earns positive grades but includes some Equal Weight ratings. Schwab’s stronger consensus grading suggests greater institutional confidence, potentially influencing investor sentiment more favorably.
Risks specific to each company
The following categories identify the critical pressure points and systemic threats facing both firms in the 2026 market environment:
1. Market & Competition
The Charles Schwab Corporation
- Established market leader with diversified services faces intense competition from fintech disruptors.
Robinhood Markets, Inc.
- High-growth fintech with innovative platform but faces fierce competition and pressure to maintain market share.
2. Capital Structure & Debt
The Charles Schwab Corporation
- Strong balance sheet with favorable debt-to-equity metrics and moderate interest coverage.
Robinhood Markets, Inc.
- Elevated debt levels with a debt-to-equity ratio close to 1, raising financial risk concerns.
3. Stock Volatility
The Charles Schwab Corporation
- Beta under 1 (0.937) indicates below-market volatility, providing relative stability.
Robinhood Markets, Inc.
- High beta (2.447) signals large price swings and higher investor risk exposure.
4. Regulatory & Legal
The Charles Schwab Corporation
- Established compliance framework but still exposed to evolving financial regulations.
Robinhood Markets, Inc.
- Faces heightened regulatory scrutiny due to business model and past compliance challenges.
5. Supply Chain & Operations
The Charles Schwab Corporation
- Large branch network and robust operations support diversified revenue streams.
Robinhood Markets, Inc.
- Relies heavily on digital infrastructure, vulnerable to tech disruptions and cybersecurity risks.
6. ESG & Climate Transition
The Charles Schwab Corporation
- Progressive ESG initiatives but financial sector-wide transition risks persist.
Robinhood Markets, Inc.
- Early-stage ESG programs; climate transition impact less direct but increasing investor demand for transparency.
7. Geopolitical Exposure
The Charles Schwab Corporation
- U.S.-centric with some international presence, facing moderate geopolitical risks.
Robinhood Markets, Inc.
- Primarily U.S.-based platform, limited global exposure but sensitive to domestic policy changes.
Which company shows a better risk-adjusted profile?
The Charles Schwab Corporation’s strongest risk is market competition from fintech disruptors, while Robinhood’s greatest risk is high financial leverage combined with elevated stock volatility. Schwab’s lower beta, stronger balance sheet, and very strong Altman Z-Score (164.8) reflect a safer, risk-adjusted profile. Robinhood’s moderate Altman Z-Score (2.1) and high beta expose it to more pronounced financial and market risks. Schwab’s stability amid fintech disruption justifies cautious optimism despite competitive pressures.
Final Verdict: Which stock to choose?
The Charles Schwab Corporation excels as a cash-generating powerhouse with resilient income growth and operational efficiency. Its main point of vigilance lies in a declining ROIC trend, signaling potential challenges in capital allocation. Schwab suits investors seeking steady, long-term value within a core portfolio.
Robinhood Markets, Inc. leverages a strategic moat built on rapid revenue expansion and innovative platform engagement. Its recurring revenue model offers growth safety, though its higher leverage and valuation multiples suggest elevated risk. Robinhood fits portfolios aiming for GARP—growth at a reasonable price—with appetite for volatility.
If you prioritize stable cash flow and proven income growth, Schwab is the compelling choice due to its robust operational track record and defensive profile. However, if you seek dynamic growth with disruptive potential, Robinhood offers superior top-line momentum, albeit with greater financial risk and valuation premiums.
Disclaimer: Investment carries a risk of loss of initial capital. The past performance is not a reliable indicator of future results. Be sure to understand risks before making an investment decision.
Go Further
I encourage you to read the complete analyses of The Charles Schwab Corporation and Robinhood Markets, Inc. to enhance your investment decisions: