Home > Comparison > Healthcare > WAT vs RVTY
The strategic rivalry between Waters Corporation and Revvity, Inc. shapes the future of the healthcare diagnostics and research industry. Waters operates as a specialized manufacturer of high-performance analytical instruments, while Revvity functions as a diversified provider of diagnostic and life sciences solutions. This analysis explores their contrasting approaches and aims to identify which company presents the stronger risk-adjusted growth potential for a diversified investor portfolio in this critical sector.
Table of contents
Companies Overview
Waters Corporation and Revvity, Inc. command substantial influence in medical diagnostics and life sciences research.
Waters Corporation: Specialty Measurement Innovator
Waters Corporation dominates the analytical workflow solutions market with high and ultra-performance liquid chromatography and mass spectrometry technology. Its core revenue stems from designing, manufacturing, and servicing advanced instruments and consumables. In 2026, it focuses strategically on expanding its product applications in pharmaceutical development and environmental testing, reinforcing its competitive edge in laboratory instrument innovation.
Revvity, Inc.: Life Sciences & Diagnostics Powerhouse
Revvity, Inc. drives growth through instruments, reagents, and software solutions tailored to diagnostics and life sciences. Its revenue engine blends analytical technologies with diagnostics products for genetic disorder detection and genomic workflows. In 2026, the company emphasizes enhancing its integrated solutions for oncology and immunodiagnostics, expanding its footprint across pharmaceutical, industrial, and public health markets.
Strategic Collision: Similarities & Divergences
Both companies compete in diagnostics and life sciences but diverge in business models. Waters pursues a focused instrument-centric approach, while Revvity integrates diagnostics with broad analytical services and software. The battleground centers on innovation in analytical precision and diagnostic breadth. Waters offers a concentrated niche investment profile; Revvity presents a diversified exposure with broader market applications.
Income Statement Comparison
This data dissects the core profitability and scalability of both corporate engines to reveal who dominates the bottom line:
| Metric | Waters Corporation (WAT) | Revvity, Inc. (RVTY) |
|---|---|---|
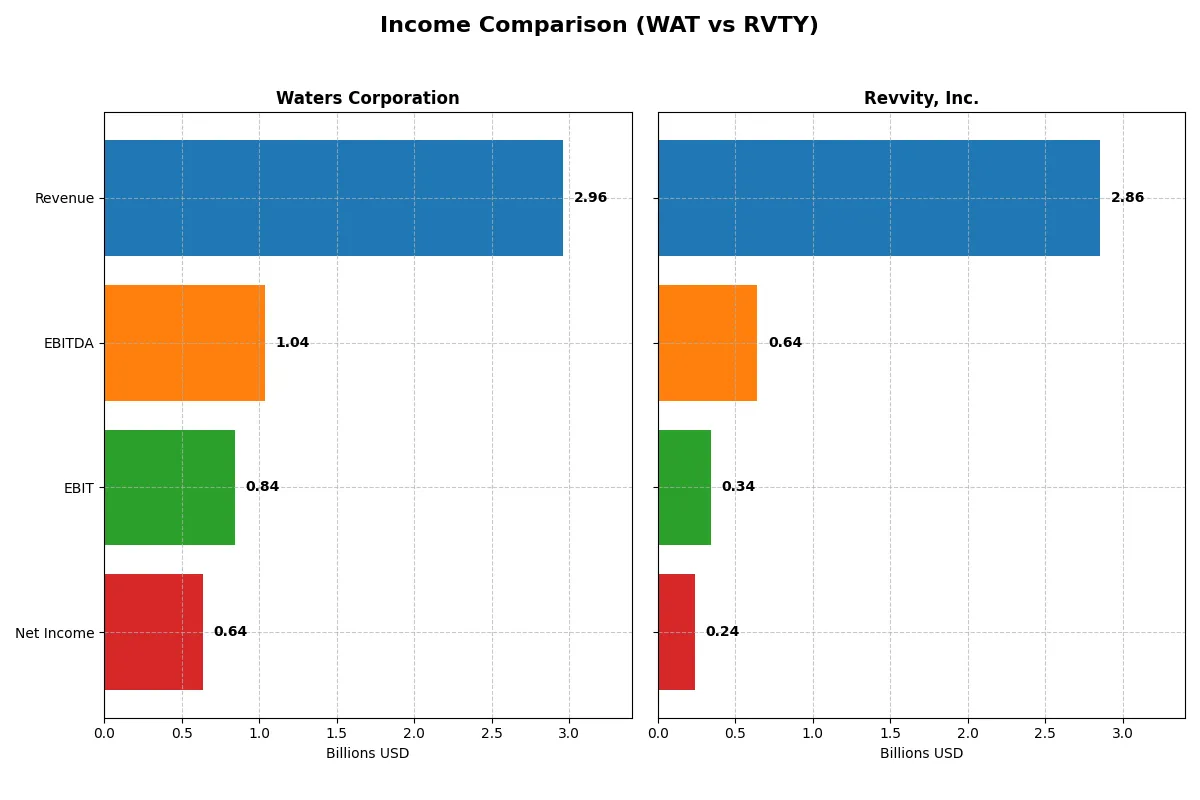
| Revenue | 2.96B | 2.86B |
| Cost of Revenue | 1.20B | 1.34B |
| Operating Expenses | 932M | 1.16B |
| Gross Profit | 1.76B | 1.52B |
| EBITDA | 1.04B | 644M |
| EBIT | 845M | 341M |
| Interest Expense | 90M | 92M |
| Net Income | 638M | 242M |
| EPS | 10.75 | 2.08 |
| Fiscal Year | 2024 | 2025 |
Income Statement Analysis: The Bottom-Line Duel
The following income statement comparison reveals the true efficiency and profitability of Waters Corporation and Revvity, Inc. as corporate engines in their sector.
Waters Corporation Analysis
Waters Corporation’s revenue hovered near 2.96B in 2024, showing flat year-over-year growth but a solid 25% rise since 2020. Net income remained robust at 638M, though slightly down from the previous year. Gross and net margins stand favorably at 59.4% and 21.6%, respectively, reflecting efficient cost control and strong profitability.
Revvity, Inc. Analysis
Revvity posted 2.86B in revenue for 2025, up modestly from 2.76B the year before, but down 25% from 2021. Net income came in at 242M, a sharp decline from prior years. Its gross margin held at a decent 53.1%, but the net margin contracted to 8.5%, signaling margin pressure and weaker bottom-line efficiency.
Verdict: Margin Strength vs. Revenue Resilience
Waters Corporation clearly outperforms Revvity in profitability and margin stability, delivering a higher and more consistent net margin near 22%. Revvity’s declining net income and slimmer margins highlight operational challenges. Investors seeking durable profit generation will find Waters’ profile more compelling amid market cycles.
Financial Ratios Comparison
These vital ratios act as a diagnostic tool to expose the underlying fiscal health, valuation premiums, and capital efficiency of the companies compared below:
| Ratios | Waters Corporation (WAT) | Revvity, Inc. (RVTY) |
|---|---|---|
| ROE | 34.9% | 3.3% |
| ROIC | 18.4% | 2.8% |
| P/E | 34.5 | 45.3 |
| P/B | 12.0 | 1.5 |
| Current Ratio | 2.11 | 1.68 |
| Quick Ratio | 1.51 | 1.40 |
| D/E (Debt-to-Equity) | 0.93 | 0.46 |
| Debt-to-Assets | 37.4% | 27.7% |
| Interest Coverage | 9.21 | 3.87 |
| Asset Turnover | 0.65 | 0.23 |
| Fixed Asset Turnover | 4.08 | 4.43 |
| Payout ratio | 0% | 13.6% |
| Dividend yield | 0% | 0.30% |
| Fiscal Year | 2024 | 2025 |
Efficiency & Valuation Duel: The Vital Signs
Ratios serve as a company’s DNA, unveiling hidden risks and operational excellence that raw numbers alone cannot disclose.
Waters Corporation
Waters Corporation demonstrates robust profitability with a 34.9% ROE and a strong 21.6% net margin. However, its valuation appears stretched, with a P/E of 34.5 and a P/B of 12.0, signaling premium pricing. Waters reinvests heavily in R&D, as it pays no dividends, fueling growth and innovation.
Revvity, Inc.
Revvity shows modest profitability, posting a 3.3% ROE and an 8.5% net margin, reflecting operational challenges. Its valuation is expensive, with a P/E of 45.3, though the P/B of 1.51 suggests reasonable asset pricing. Revvity offers a minimal 0.3% dividend yield, balancing modest returns with ongoing reinvestment in research.
Premium Valuation vs. Operational Safety
Waters commands higher profitability but trades at a stretched premium, while Revvity faces weaker returns despite expensive multiples. Waters offers a better risk-reward balance, suiting investors favoring operational strength and growth. Revvity fits those seeking exposure to turnaround potential with cautious risk tolerance.
Which one offers the Superior Shareholder Reward?
I find Waters Corporation (WAT) and Revvity, Inc. (RVTY) offer contrasting shareholder rewards through distinct distribution strategies. WAT pays no dividends but maintains strong free cash flow (10.4/share in 2024) and robust buybacks, signaling reinvestment and capital return via buybacks. RVTY pays a modest dividend yield (~0.25%-0.3%) with a low payout ratio (~12-14%), supported by stable free cash flow (~4.5/share in 2025), but with a weaker operating margin (~12%) than WAT (~28%). WAT’s aggressive leverage (debt/equity ~0.93) and high valuation multiples (P/E ~34.5) reflect confidence in growth and buybacks. RVTY’s lower leverage and modest dividend provide steady income but less capital appreciation potential. I conclude WAT offers a superior total return profile in 2026 due to sustainable buyback intensity and reinvestment capacity, outweighing RVTY’s conservative dividend approach.
Comparative Score Analysis: The Strategic Profile
The radar chart reveals the fundamental DNA and trade-offs of Waters Corporation and Revvity, Inc., highlighting their core financial strengths and valuation nuances:
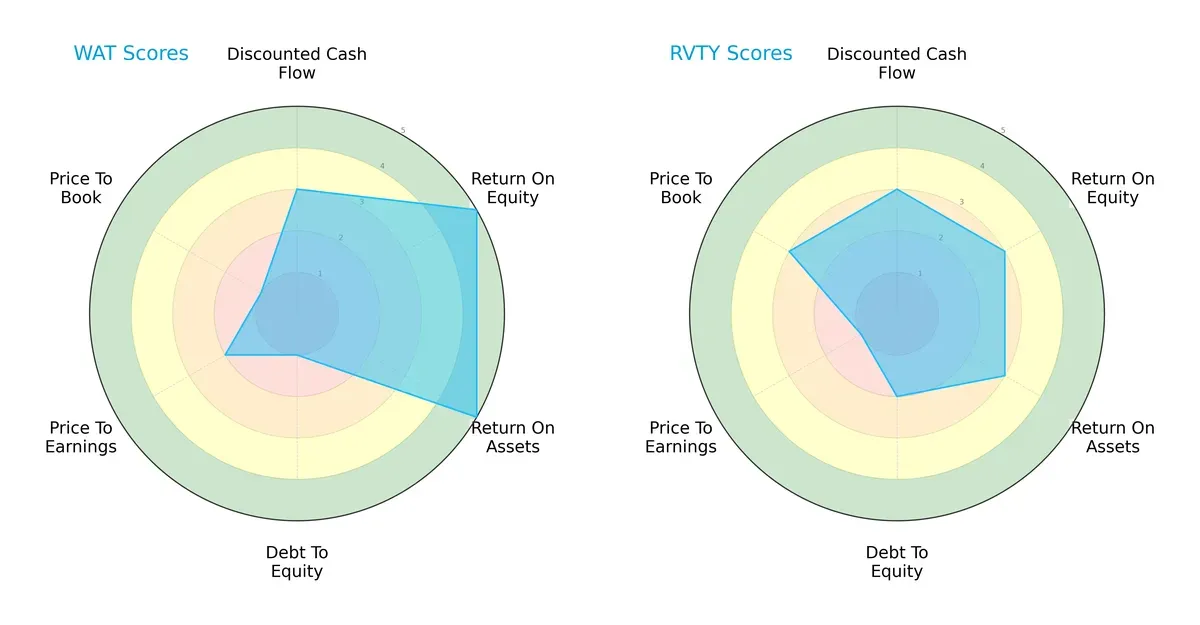
Waters Corporation excels in profitability with very favorable ROE (5) and ROA (5) scores but suffers from a weak balance sheet, shown by a very unfavorable debt-to-equity score (1). Revvity offers a more balanced financial risk profile (debt-to-equity score 2) but lags in profitability metrics (ROE 3, ROA 3). Valuation measures suggest Waters trades at a premium risk (P/B 1 very unfavorable), while Revvity appears moderately valued. Overall, Waters relies on profit efficiency, whereas Revvity leans on financial stability.
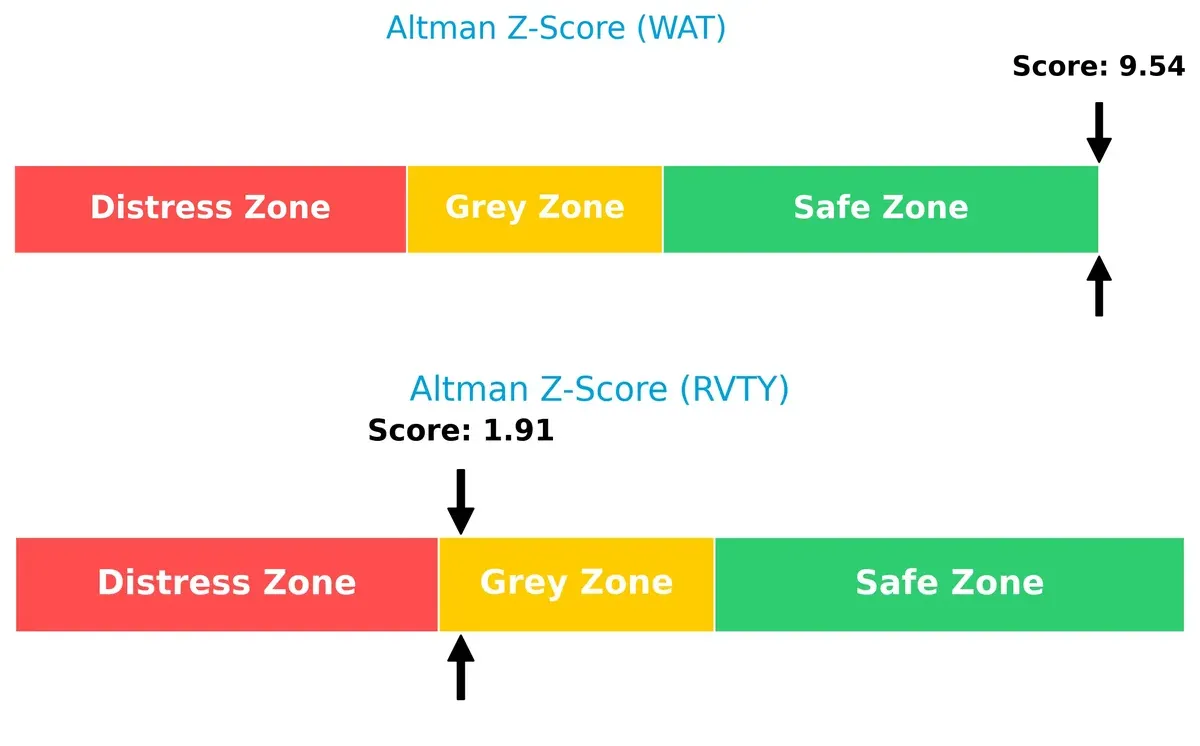
Bankruptcy Risk: Solvency Showdown
Waters Corporation’s Altman Z-Score (9.54) places it safely above bankruptcy risk, while Revvity’s score (1.91) positions it in a grey zone, implying moderate financial distress potential in this cycle:
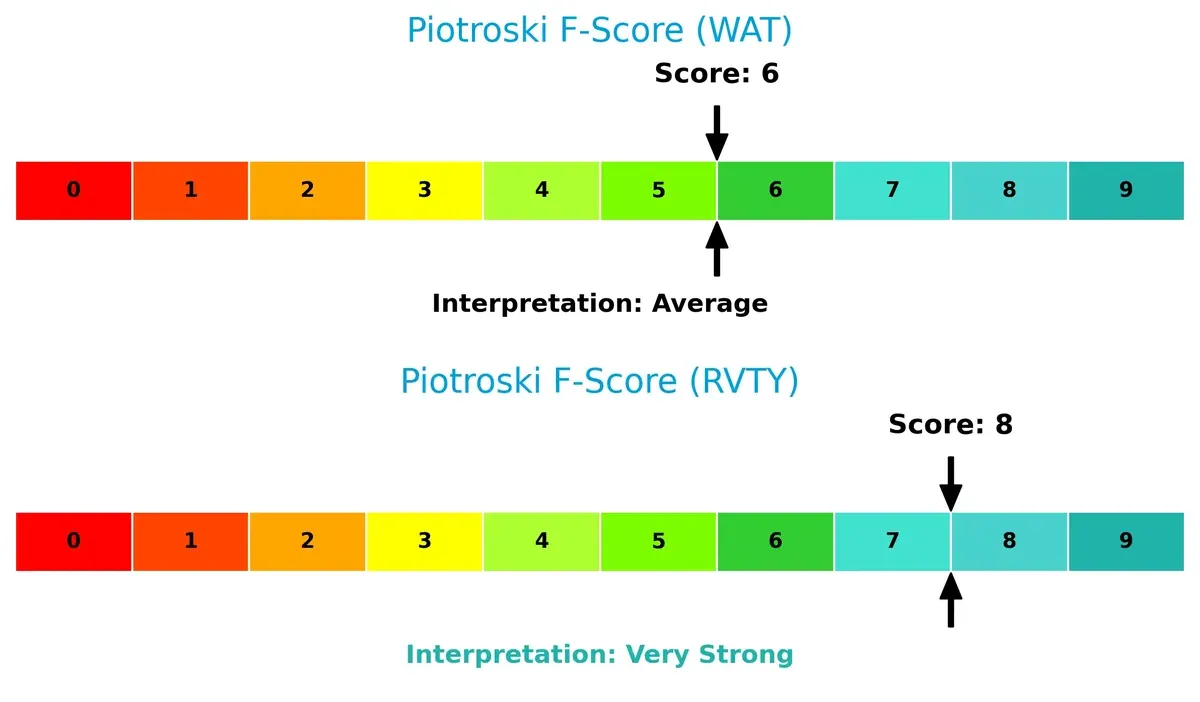
Financial Health: Quality of Operations
Revvity’s Piotroski F-Score of 8 signals very strong operational health and internal metrics. Waters’ score of 6 is average, indicating some caution on financial quality compared to Revvity’s robustness:
How are the two companies positioned?
This section dissects the operational DNA of Waters Corporation and Revvity by comparing their revenue distribution and internal dynamics of strengths and weaknesses. The final objective confronts their economic moats to reveal which model delivers the most resilient and sustainable competitive advantage today.
Revenue Segmentation: The Strategic Mix
This visual comparison dissects how Waters Corporation and Revvity, Inc. diversify their income streams and where their primary sector bets lie:
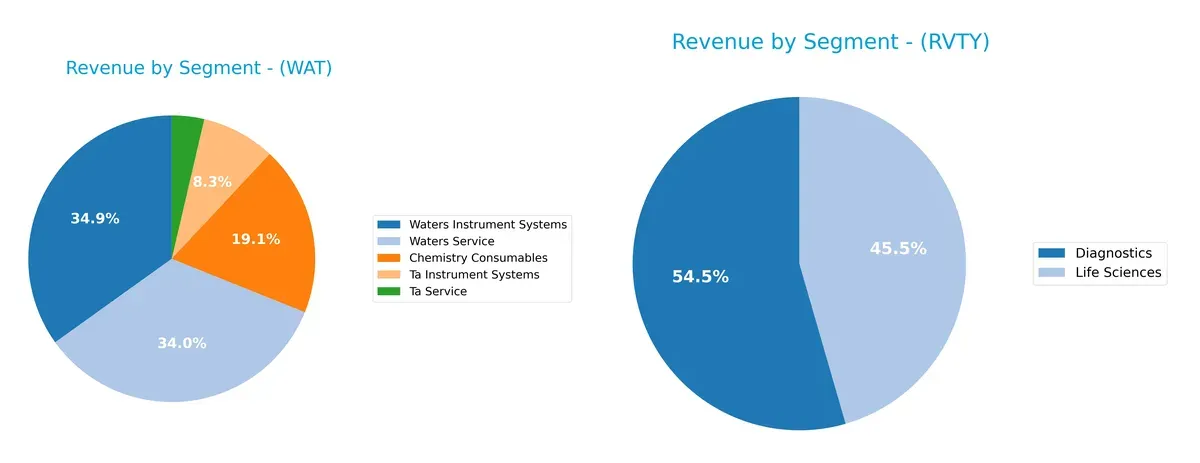
Waters anchors its revenue in Waters Instrument Systems ($1.03B) and Services ($1.01B), with Chemistry Consumables ($565M) and TA segments adding depth. Revvity pivots on two large segments: Diagnostics ($1.5B) and Life Sciences ($1.25B). Waters’ multiple smaller segments suggest ecosystem lock-in and resilience, while Revvity’s concentration in two segments exposes it to sector-specific risks despite strong scale.
Strengths and Weaknesses Comparison
This table compares the Strengths and Weaknesses of Waters Corporation and Revvity, Inc.:
Waters Corporation Strengths
- Strong profitability with 21.56% net margin and 34.88% ROE
- Favorable liquidity ratios (current 2.11, quick 1.51)
- Diverse product segments including instruments and services
- Global revenue diversified across Americas, Asia Pacific, and Europe
- High fixed asset turnover at 4.08
Revvity, Inc. Strengths
- Favorable capital cost with 7.52% WACC below ROIC
- Low leverage with debt-to-assets at 27.68% and debt/equity 0.46
- Reasonable liquidity (current ratio 1.68, quick 1.4)
- Product focus on Diagnostics and Life Sciences segments
- Revenue geographically spread with significant international exposure
Waters Corporation Weaknesses
- High valuation multiples, PE 34.51 and PB 12.04, indicating expensive stock
- No dividend yield, missing income for investors
- Moderate leverage with debt/equity 0.93 and debt/assets 37.38%
- Neutral asset turnover at 0.65 may indicate capital efficiency limits
Revvity, Inc. Weaknesses
- Low profitability with 8.46% net margin and 3.33% ROE
- ROIC of 2.82% below WACC, signaling value destruction
- Unfavorable asset turnover at 0.23, indicating inefficient asset use
- Elevated PE at 45.32 and minimal dividend yield at 0.3%
- Interest coverage ratio weak at 3.7, increasing financial risk
Waters Corporation demonstrates robust profitability and global diversification but faces valuation and dividend yield concerns. Revvity shows prudent capital structure and global reach but struggles with profitability and asset efficiency, highlighting challenges in operational performance.
The Moat Duel: Analyzing Competitive Defensibility
A structural moat is the sole safeguard protecting long-term profits from competitive erosion. Here’s how Waters Corporation and Revvity, Inc. stack up:
Waters Corporation: Precision Instruments with High ROIC Stability
Waters leverages intangible assets and advanced chromatography technology. Its strong 28.55% EBIT margin signals durable pricing power. In 2026, expanding software integration could deepen this moat.
Revvity, Inc.: Diverse Diagnostics Facing Profitability Pressures
Revvity relies on a broad product portfolio and scale but suffers from declining ROIC and shrinking margins. Unlike Waters, it struggles to convert growth into profits. New genomic workflows offer upside if operational efficiency improves.
Precision Technology vs. Broad Diagnostics: The Moat Battle
Waters boasts a wider, more sustainable moat, consistently creating value with a ROIC well above WACC. Revvity’s profitability erosion and negative value creation reveal a fragile competitive position. Waters stands better poised to defend its market share through innovation and margin resilience.
Which stock offers better returns?
Over the past year, Waters Corporation’s stock gained 8.9%, slowing its upward momentum, while Revvity, Inc. showed a modest 1% decline with accelerating volatility.
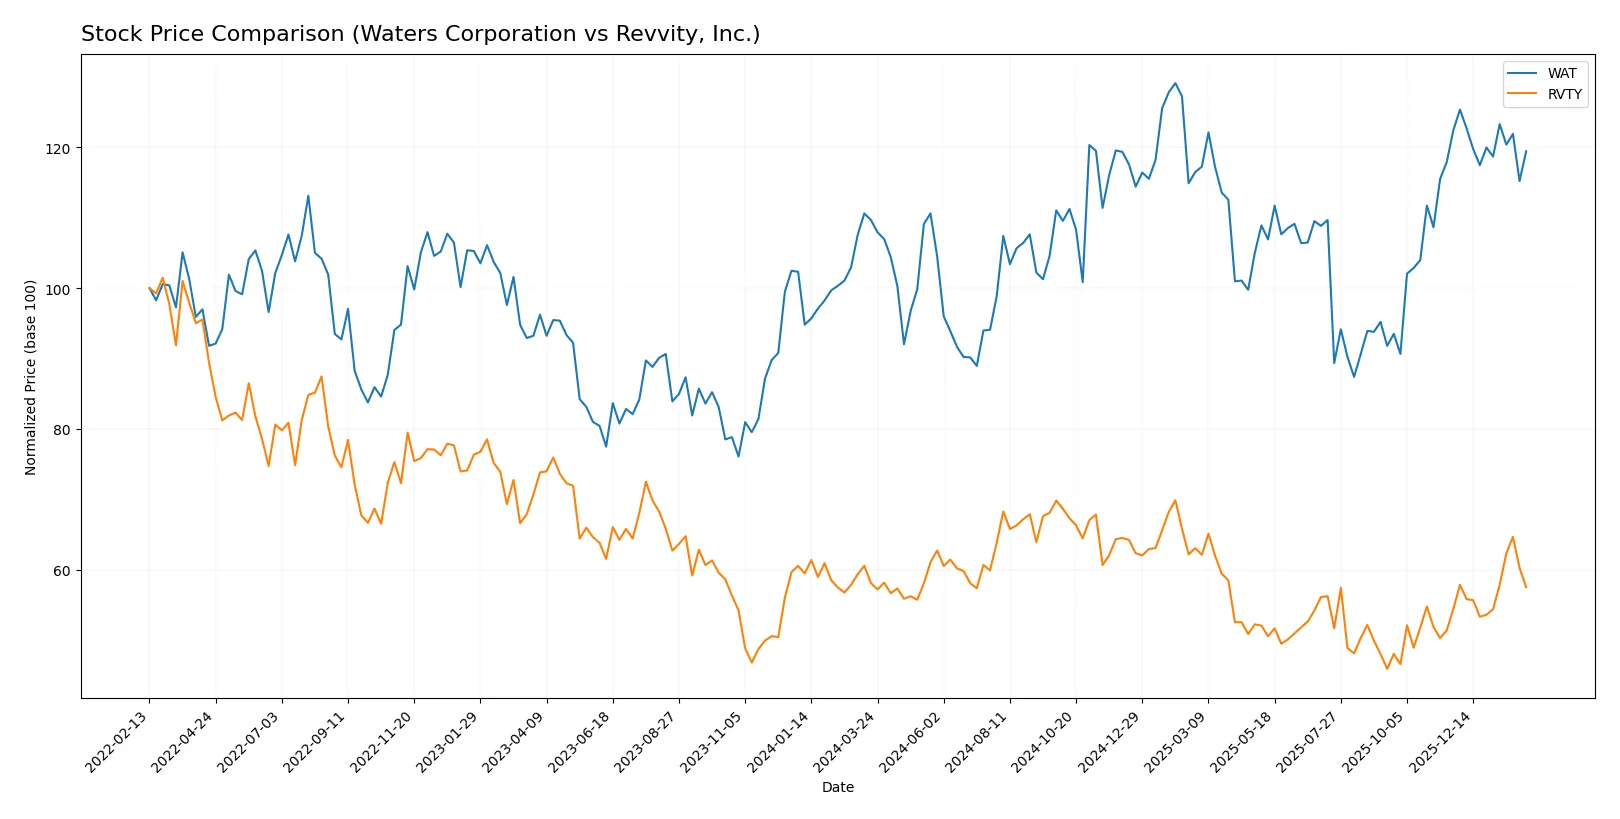
Trend Comparison
Waters Corporation experienced a bullish trend with an 8.91% rise over 12 months, though momentum decelerated recently, reflected in a -2.45% drop from late 2025 to early 2026.
Revvity, Inc. posted an overall bearish trend with a 1.02% decline in the past year but showed recent acceleration, gaining 5.66% from November 2025 to February 2026.
Waters Corporation delivered the highest market performance overall, despite short-term weakness, while Revvity’s recent gains suggest improving momentum but lower yearly returns.
Target Prices
Analysts present a moderate upside potential for Waters Corporation and Revvity, Inc. based on current consensus estimates.
| Company | Target Low | Target High | Consensus |
|---|---|---|---|
| Waters Corporation | 315 | 480 | 410.5 |
| Revvity, Inc. | 105 | 129 | 115.14 |
The target consensus for Waters Corporation sits about 7% above its current price of $384, signaling cautious optimism. Revvity’s consensus target exceeds the current $103.83 price by roughly 11%, indicating modest analyst confidence.

Don’t Let Luck Decide Your Entry Point
Optimize your entry points with our advanced ProRealTime indicators. You’ll get efficient buy signals with precise price targets for maximum performance. Start outperforming now!
How do institutions grade them?
Waters Corporation Grades
The table below shows recent institutional grades for Waters Corporation from multiple firms.
| Grading Company | Action | New Grade | Date |
|---|---|---|---|
| Wells Fargo | Maintain | Equal Weight | 2025-12-15 |
| Wolfe Research | Upgrade | Outperform | 2025-12-10 |
| Wells Fargo | Maintain | Equal Weight | 2025-11-05 |
| TD Cowen | Maintain | Hold | 2025-11-05 |
| JP Morgan | Maintain | Neutral | 2025-10-09 |
| Wells Fargo | Maintain | Equal Weight | 2025-08-05 |
| Deutsche Bank | Maintain | Hold | 2025-08-05 |
| Jefferies | Maintain | Buy | 2025-08-04 |
| Baird | Maintain | Outperform | 2025-07-16 |
| Wells Fargo | Downgrade | Equal Weight | 2025-07-15 |
Revvity, Inc. Grades
Below are the latest institutional grades for Revvity, Inc. from several grading companies.
| Grading Company | Action | New Grade | Date |
|---|---|---|---|
| Jefferies | Maintain | Hold | 2026-02-03 |
| Wells Fargo | Maintain | Equal Weight | 2026-02-03 |
| TD Cowen | Maintain | Buy | 2026-02-03 |
| Barclays | Maintain | Overweight | 2026-02-03 |
| JP Morgan | Maintain | Neutral | 2026-02-03 |
| Evercore ISI Group | Maintain | Outperform | 2026-02-03 |
| Wells Fargo | Maintain | Equal Weight | 2025-12-15 |
| Barclays | Maintain | Overweight | 2025-12-15 |
| Barclays | Maintain | Overweight | 2025-10-28 |
| Baird | Maintain | Outperform | 2025-10-28 |
Which company has the best grades?
Revvity, Inc. holds generally stronger grades, including multiple Overweight and Outperform ratings. Waters Corporation has more Neutral and Equal Weight grades with fewer upgrades. This difference may influence investors toward Revvity due to its stronger institutional sentiment.
Risks specific to each company
The following categories identify the critical pressure points and systemic threats facing both firms in the 2026 market environment:
1. Market & Competition
Waters Corporation
- Strong market position with innovative chromatography and mass spectrometry products; faces intense competition in diagnostics and research sectors.
Revvity, Inc.
- Broad product portfolio in diagnostics and life sciences; competition from specialized biotech and larger diversified firms pressures margins.
2. Capital Structure & Debt
Waters Corporation
- Moderate debt with a debt-to-assets ratio of 37.4%; interest coverage strong at 9.42x, indicating manageable leverage risk.
Revvity, Inc.
- Lower leverage with debt-to-assets at 27.7%; interest coverage weaker at 3.7x, raising moderate concerns over debt serviceability.
3. Stock Volatility
Waters Corporation
- Beta of 1.18 suggests moderately higher volatility than the market; stable trading volume supports liquidity.
Revvity, Inc.
- Beta at 1.09 implies slightly lower volatility; higher average volume indicates active trading and investor interest.
4. Regulatory & Legal
Waters Corporation
- Operates in tightly regulated healthcare diagnostics; compliance costs and regulatory changes pose ongoing risks.
Revvity, Inc.
- Similar regulatory environment with added exposure to genomic and early detection technologies, which face evolving legal hurdles.
5. Supply Chain & Operations
Waters Corporation
- Global footprint with diversified supply chains; potential disruption risks from geopolitical tensions remain a concern.
Revvity, Inc.
- Larger workforce and broader product range increase operational complexity and supply chain vulnerability.
6. ESG & Climate Transition
Waters Corporation
- Increasing focus on sustainability in manufacturing and products; ESG compliance may drive costs but enhance brand.
Revvity, Inc.
- Stronger emphasis on environmental testing and sustainability solutions, aligning with climate transition but requiring capital investment.
7. Geopolitical Exposure
Waters Corporation
- Revenue diversification across Americas, Europe, and Asia mitigates regional risks but exposure to trade tensions persists.
Revvity, Inc.
- Similar global exposure; reliance on international markets may amplify risks from geopolitical instability and regulatory divergence.
Which company shows a better risk-adjusted profile?
Waters Corporation’s most significant risk is its relatively high valuation multiples and moderate leverage amid competitive pressure. Revvity faces critical risks from weaker profitability metrics and debt servicing capacity despite a stronger balance sheet. Waters’ high Altman Z-score (9.54) signals robust financial health and lower bankruptcy risk. Revvity’s Z-score near the grey zone (1.91) flags caution despite a strong Piotroski score. Overall, Waters offers a superior risk-adjusted profile supported by better returns on invested capital and stronger interest coverage. The recent market valuation gap and debt metrics justify my concern for Revvity’s financial resilience in 2026.
Final Verdict: Which stock to choose?
Waters Corporation’s superpower lies in its strong value creation, consistently generating returns well above its cost of capital. Its efficiency in capital allocation and robust profitability underpin a slightly favorable moat. The point of vigilance is its declining ROIC trend, signaling pressure on future margins. It fits an Aggressive Growth portfolio seeking high-quality earnings.
Revvity, Inc. offers a strategic moat centered on its intangible asset base and innovation-driven growth potential, supported by a very strong Piotroski score. While its financial stability is less robust than Waters, it presents a lower leverage profile and a more conservative balance sheet. Revvity suits a GARP portfolio aiming for growth with moderate risk control.
If you prioritize durable economic moats and superior capital returns, Waters outshines due to its value creation and income strength. However, if you seek a growth trajectory with better balance sheet safety and innovation leverage, Revvity offers better stability despite its current profitability challenges. Both present analytical scenarios worthy of consideration based on your risk tolerance and investment horizon.
Disclaimer: Investment carries a risk of loss of initial capital. The past performance is not a reliable indicator of future results. Be sure to understand risks before making an investment decision.
Go Further
I encourage you to read the complete analyses of Waters Corporation and Revvity, Inc. to enhance your investment decisions: