Home > Comparison > Healthcare > TMO vs RVTY
The strategic rivalry between Thermo Fisher Scientific Inc. and Revvity, Inc. shapes the competitive landscape of the healthcare diagnostics and research sector. Thermo Fisher operates as a capital-intensive industrial giant with a broad product portfolio and global reach. Revvity, by contrast, positions itself as a focused innovator with specialized diagnostics and analytical solutions. This analysis will evaluate which company’s strategy offers superior risk-adjusted returns for a diversified portfolio.

Table of contents
Companies Overview
Thermo Fisher Scientific and Revvity shape innovation in the diagnostics and life sciences markets.
Thermo Fisher Scientific Inc.: Global Life Sciences Leader
Thermo Fisher dominates as a provider of life sciences solutions worldwide. It earns revenue through reagents, instruments, and biopharma services supporting drug discovery, diagnostics, and research markets. In 2026, its strategic focus remains on integrating specialty diagnostics and analytical instruments to enhance pharmaceutical and healthcare innovation.
Revvity, Inc.: Specialty Diagnostics and Analytical Innovator
Revvity operates in diagnostics and life sciences, generating revenue from instruments, reagents, and informatics. It emphasizes genomic workflows and early disease detection technologies. In its latest strategy, Revvity targets expanding analytical solutions for environmental and industrial markets alongside precision diagnostics.
Strategic Collision: Similarities & Divergences
Both firms excel in medical diagnostics but differ sharply in scope: Thermo Fisher pursues a broad integrated platform approach, while Revvity focuses on specialized genomic and environmental analytics. Their primary battleground is advanced diagnostics and research solutions. Investors face distinct profiles—Thermo Fisher offers scale and diversification; Revvity delivers niche innovation with growth potential.
Income Statement Comparison
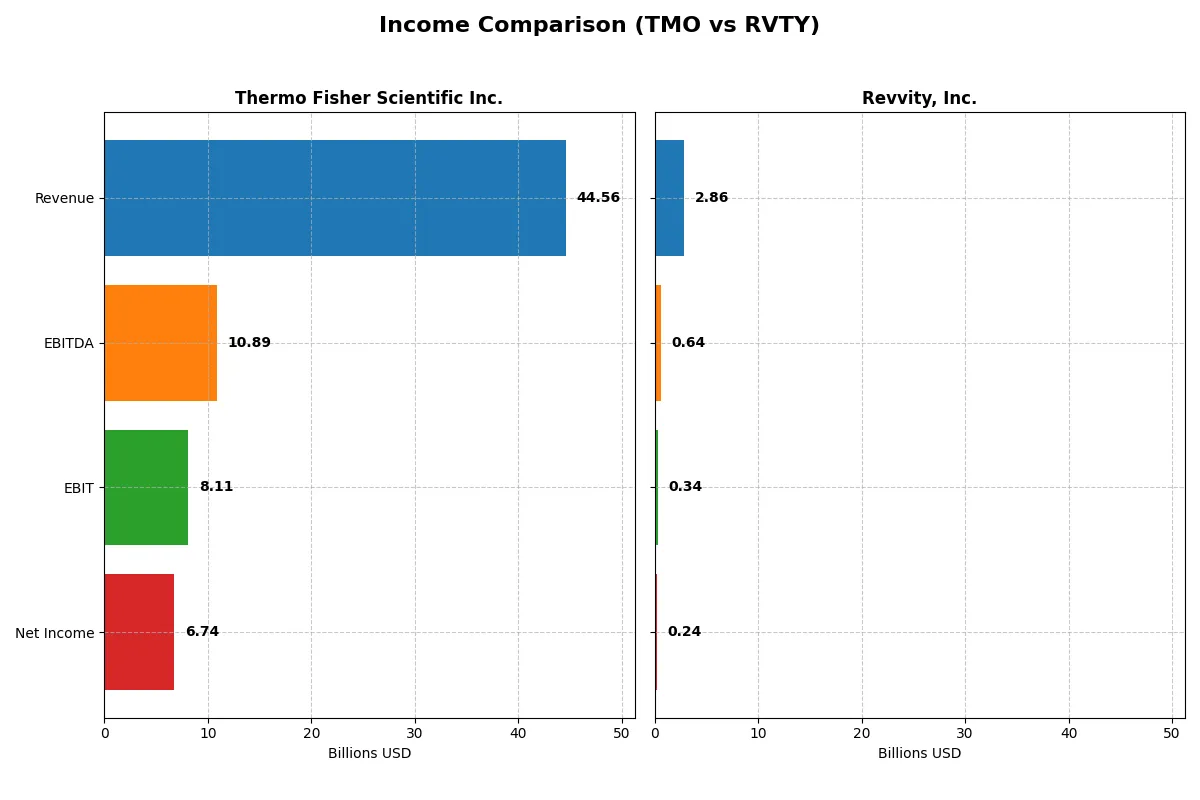
This data dissects the core profitability and scalability of both corporate engines to reveal who dominates the bottom line:
| Metric | Thermo Fisher Scientific Inc. (TMO) | Revvity, Inc. (RVTY) |
|---|---|---|
| Revenue | 44.6B | 2.86B |
| Cost of Revenue | 27.8B | 1.34B |
| Operating Expenses | 8.67B | 1.16B |
| Gross Profit | 16.8B | 1.52B |
| EBITDA | 10.9B | 644M |
| EBIT | 8.11B | 341M |
| Interest Expense | 1.42B | 92M |
| Net Income | 6.74B | 242M |
| EPS | 17.77 | 2.08 |
| Fiscal Year | 2025 | 2025 |
Income Statement Analysis: The Bottom-Line Duel
This income statement comparison exposes the core efficiency and profitability dynamics powering each company’s financial engine.
Thermo Fisher Scientific Inc. Analysis
Thermo Fisher’s revenue grew modestly by 3.9% in 2025, reaching $44.6B, while net income advanced 6.2% to $6.7B. Its gross margin slipped to 37.7%, but net margin held steady at 15.1%, reflecting resilient operational control. Despite slight margin contraction, the company maintains robust profitability with improving EPS momentum.
Revvity, Inc. Analysis
Revvity’s 2025 revenue rose 3.7% to $2.86B, but net income fell 18.3% to $242M. Its gross margin expanded to a healthy 53.1%, though net margin declined to 8.5%, signaling margin pressure beyond cost of goods sold. The sharp EPS drop and negative net income growth highlight operational challenges despite top-line growth.
Margin Strength vs. Profit Sustainability
Thermo Fisher dominates with higher absolute profits and stable net margins, contrasting with Revvity’s stronger gross margins but weaker bottom-line results. Thermo’s scale and margin resilience underpin a clearer fundamental advantage. Investors seeking steady profit delivery will find Thermo Fisher’s profile more attractive than Revvity’s volatile earnings performance.
Financial Ratios Comparison
These vital ratios act as a diagnostic tool to expose the underlying fiscal health, valuation premiums, and capital efficiency of the companies compared below:
| Ratios | Thermo Fisher Scientific Inc. (TMO) | Revvity, Inc. (RVTY) |
|---|---|---|
| ROE | 12.6% | 3.3% |
| ROIC | 7.6% | 2.8% |
| P/E | 32.3 | 45.3 |
| P/B | 4.08 | 1.51 |
| Current Ratio | 1.89 | 1.68 |
| Quick Ratio | 1.53 | 1.40 |
| D/E | 0.74 | 0.46 |
| Debt-to-Assets | 35.7% | 27.7% |
| Interest Coverage | 5.71 | 3.87 |
| Asset Turnover | 0.40 | 0.23 |
| Fixed Asset Turnover | 4.22 | 4.43 |
| Payout ratio | 9.44% | 13.6% |
| Dividend yield | 0.29% | 0.30% |
| Fiscal Year | 2025 | 2025 |
Efficiency & Valuation Duel: The Vital Signs
Ratios act as a company’s DNA, unveiling hidden operational strengths and risks that raw numbers alone cannot expose.
Thermo Fisher Scientific Inc.
Thermo Fisher delivers solid profitability with a 12.6% ROE and a 15.1% net margin, showing operational competence. However, its P/E ratio at 32.3 signals a stretched valuation compared to industry norms. The company returns value through a modest 0.29% dividend yield, balancing shareholder payback with investment in R&D.
Revvity, Inc.
Revvity posts weaker profitability with a 3.3% ROE and an 8.5% net margin, indicating operational challenges. Its P/E at 45.3 reflects an expensive stock price relative to earnings. Despite a low dividend yield, Revvity favors reinvestment into growth and R&D, signaling a focus on future expansion rather than immediate shareholder returns.
Premium Valuation vs. Operational Safety
Thermo Fisher offers a better risk-reward balance with stronger profitability and slightly more reasonable valuation metrics. Revvity’s expensive valuation and weaker returns fit investors seeking high growth potential but willing to accept higher risk.
Which one offers the Superior Shareholder Reward?
I observe Thermo Fisher Scientific (TMO) offers a conservative dividend yield around 0.29% with a low payout ratio near 9.4%, supported by robust free cash flow coverage above 80%. Its substantial buyback activity amplifies total shareholder returns sustainably. Revvity (RVTY) yields slightly higher at about 0.30%, but with a more volatile payout ratio fluctuating around 11-13% and weaker debt service coverage, signaling higher risk. RVTY’s smaller buyback scale and reinvestment focus suggest growth priority over distributions. I conclude TMO’s balanced, sustainable distribution strategy delivers superior shareholder reward in 2026.
Comparative Score Analysis: The Strategic Profile
The radar chart reveals the fundamental DNA and trade-offs of Thermo Fisher Scientific Inc. and Revvity, Inc., highlighting their strategic strengths and weaknesses:
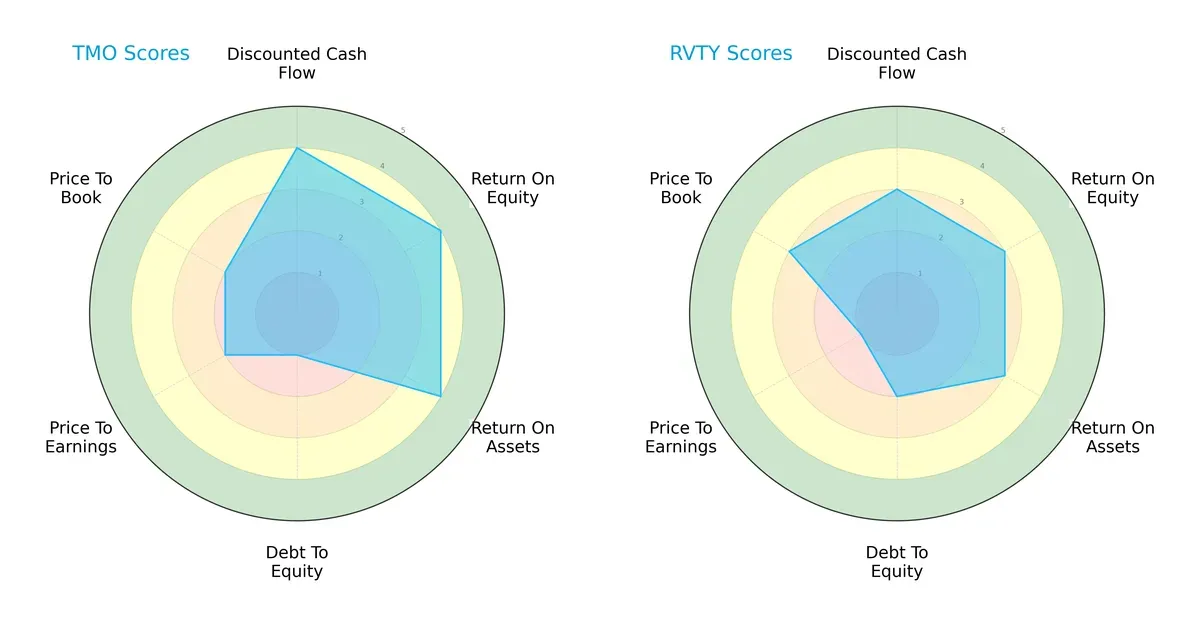
Thermo Fisher dominates with stronger DCF, ROE, and ROA scores, signaling superior profitability and asset efficiency. However, it bears a heavy debt load, reflected in a very unfavorable debt-to-equity score. Revvity shows a more moderate but balanced approach, with less financial leverage risk but weaker valuation metrics, especially its very unfavorable P/E score. Thermo Fisher’s profile relies on operational excellence, while Revvity leans on conservative financial risk.
Bankruptcy Risk: Solvency Showdown
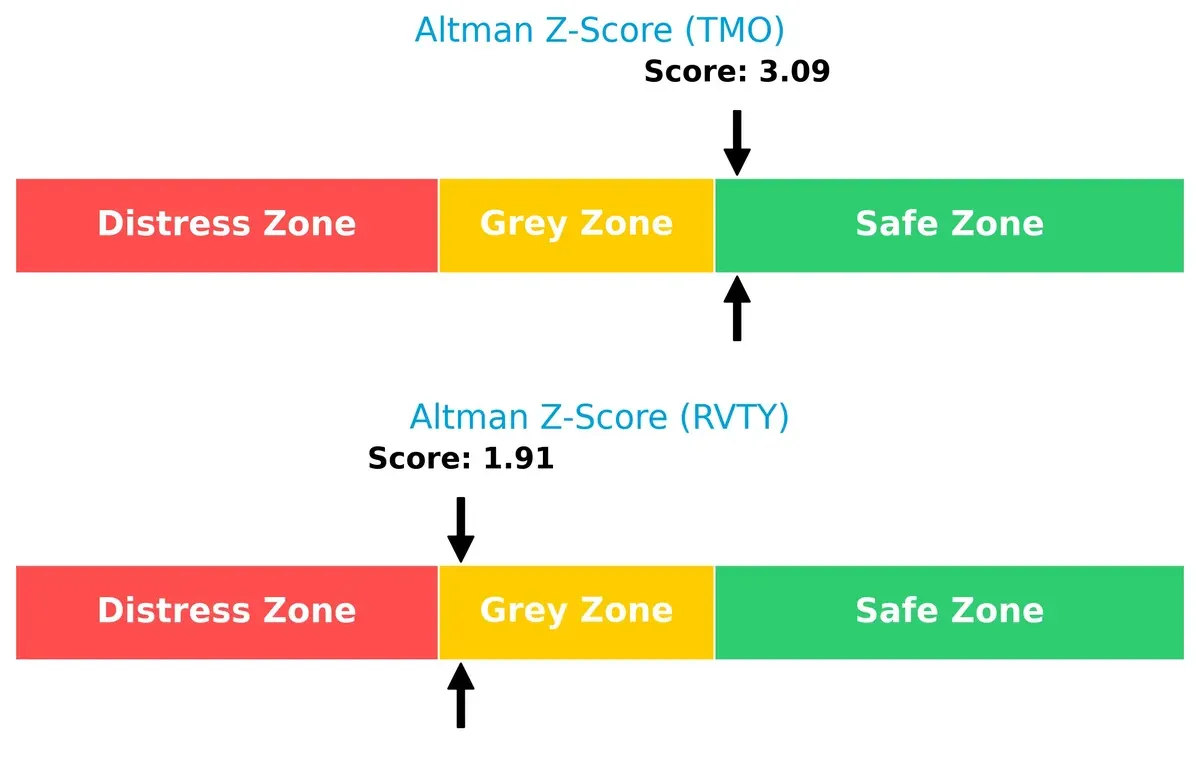
Thermo Fisher’s Altman Z-Score of 3.09 places it firmly in the safe zone, indicating low bankruptcy risk. Revvity’s 1.91 score lands in the grey zone, signaling moderate financial distress risk in this cycle:
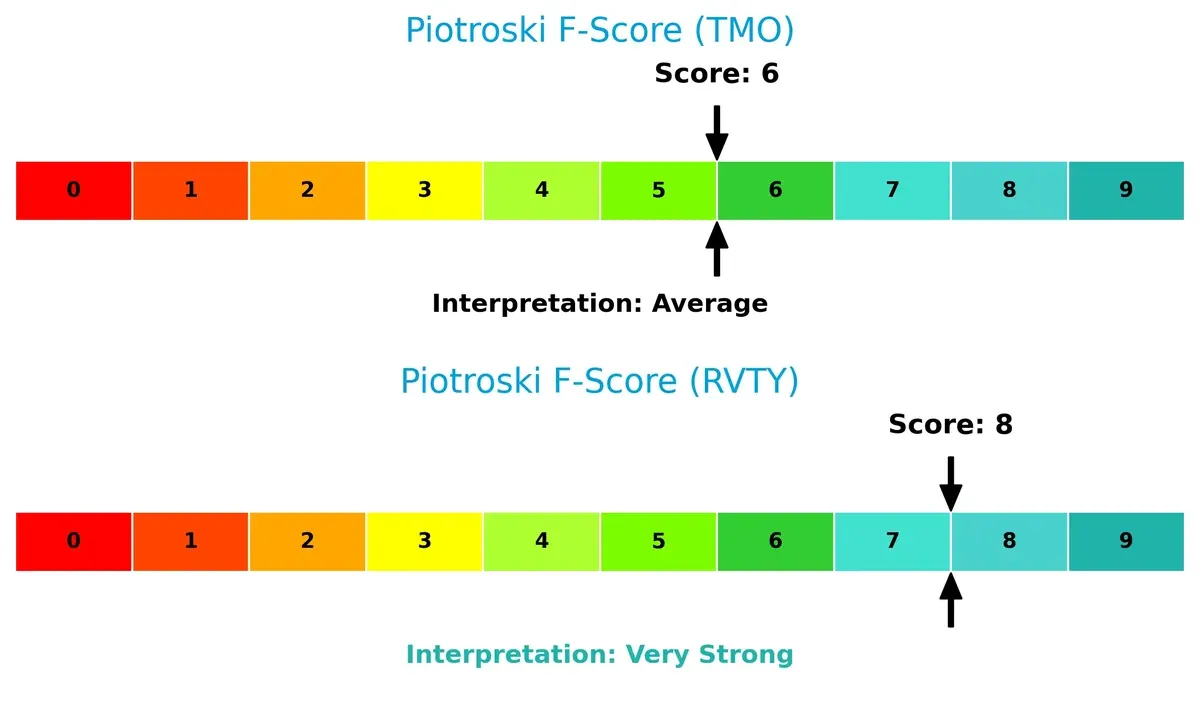
Financial Health: Quality of Operations
Revvity’s Piotroski F-Score of 8 demonstrates very strong financial health, reflecting robust internal metrics. Thermo Fisher’s score of 6 is average, highlighting some operational concerns relative to Revvity’s strength:
How are the two companies positioned?
This section dissects the operational DNA of TMO and RVTY by comparing their revenue distribution by segment alongside internal strengths and weaknesses. The goal is to confront their economic moats to identify which model offers the most resilient and sustainable competitive advantage today.
Revenue Segmentation: The Strategic Mix
This visual comparison dissects how Thermo Fisher Scientific Inc. and Revvity, Inc. diversify their income streams and where their primary sector bets lie:
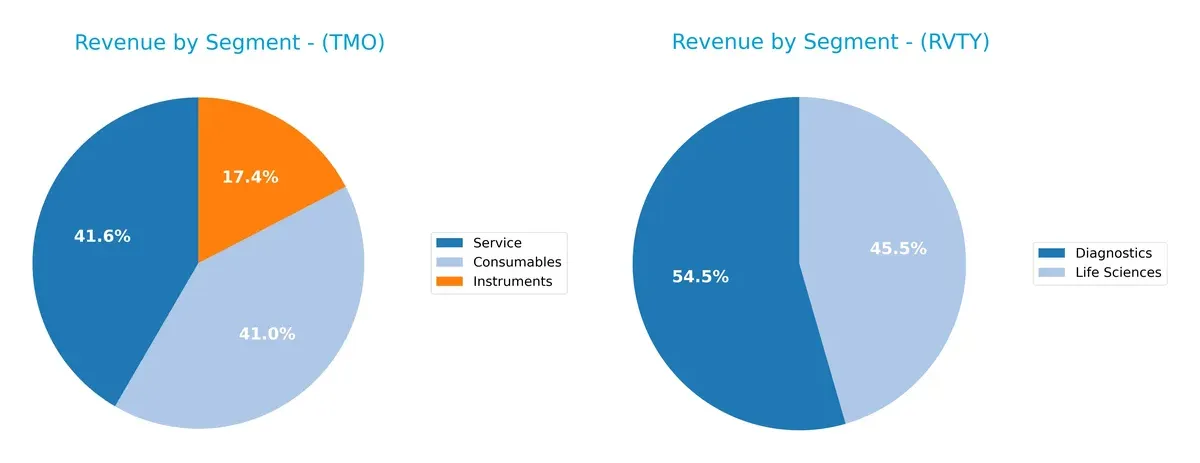
Thermo Fisher dominates with a broad portfolio: $17.6B in Consumables, $7.4B in Instruments, and $17.8B in Service. Revvity pivots narrowly, anchoring $1.5B in Diagnostics and $1.25B in Life Sciences. Thermo Fisher’s diversification mitigates risk and fosters ecosystem lock-in. Revvity’s concentrated mix signals higher exposure but sharper focus on niche innovation. The contrast highlights Thermo Fisher’s infrastructure dominance versus Revvity’s targeted growth strategy.
Strengths and Weaknesses Comparison
This table compares the strengths and weaknesses of Thermo Fisher Scientific Inc. and Revvity, Inc.:
Thermo Fisher Scientific Inc. Strengths
- Diverse revenue streams across consumables, instruments, and services
- Strong global presence with significant sales in the US, Europe, and Asia Pacific
- Favorable net margin of 15.12%
- Solid liquidity ratios: current ratio 1.89 and quick ratio 1.53
- Favorable interest coverage ratio 5.71
- ROIC near WACC at 7.6%, indicating efficient capital use
Revvity, Inc. Strengths
- Focused segments in diagnostics and life sciences with clear product specialization
- Favorable capital structure with low debt-to-equity 0.46 and debt-to-assets 27.68%
- Favorable WACC at 7.52% supports cost of capital
- Favorable liquidity ratios: current ratio 1.68 and quick ratio 1.4
- Favorable fixed asset turnover 4.43, indicating operational efficiency
Thermo Fisher Scientific Inc. Weaknesses
- Unfavorable valuation multiples: high P/E 32.34 and P/B 4.08
- Asset turnover low at 0.4, suggesting underutilized assets
- Dividend yield low at 0.29%, less attractive for income investors
- Neutral ROE 12.61% signals moderate shareholder returns
- Moderate leverage with debt-to-assets 35.69%
Revvity, Inc. Weaknesses
- Unfavorable ROE 3.33% and ROIC 2.82%, indicating weak profitability
- High P/E 45.32 suggests overvaluation risk
- Lower net margin at 8.46% compared to peers
- Unfavorable asset turnover 0.23, reflecting lower asset efficiency
- Neutral interest coverage at 3.7 could pressure debt servicing
Both companies show slightly favorable overall financial profiles but differ strategically. Thermo Fisher’s diversified business and global footprint underpin stronger profitability and liquidity. Revvity’s focused product lines and conservative leverage contrast with weaker profitability and asset use. These differences shape their respective competitive positioning and capital allocation priorities.
The Moat Duel: Analyzing Competitive Defensibility
A structural moat is the only thing protecting long-term profits from relentless competition erosion. Let’s dissect the moats of two healthcare giants:
Thermo Fisher Scientific Inc.: Diversified Science Platform Moat
Thermo Fisher’s moat stems from its intangible assets and broad product ecosystem. It sustains high ROIC and stable margins, though ROIC is declining. Expansion into biopharma services in 2026 could deepen its competitive edge.
Revvity, Inc.: Specialized Diagnostic Innovation Moat
Revvity relies on cutting-edge diagnostics and niche technologies, unlike Thermo’s broad base. Its margins compress and ROIC deteriorates sharply, risking moat erosion. However, novel genomic workflows may present future growth opportunities.
Moat Strength: Diversification vs. Specialization
Thermo Fisher enjoys a wider moat through diversified offerings and stable profitability. Revvity’s specialized focus yields a narrower, more fragile moat. Thermo Fisher is better positioned to defend market share amid intensifying competition.
Which stock offers better returns?
The past year shows contrasting price movements for Thermo Fisher Scientific Inc. and Revvity, Inc., with notable shifts in trend direction and trading volume dynamics.
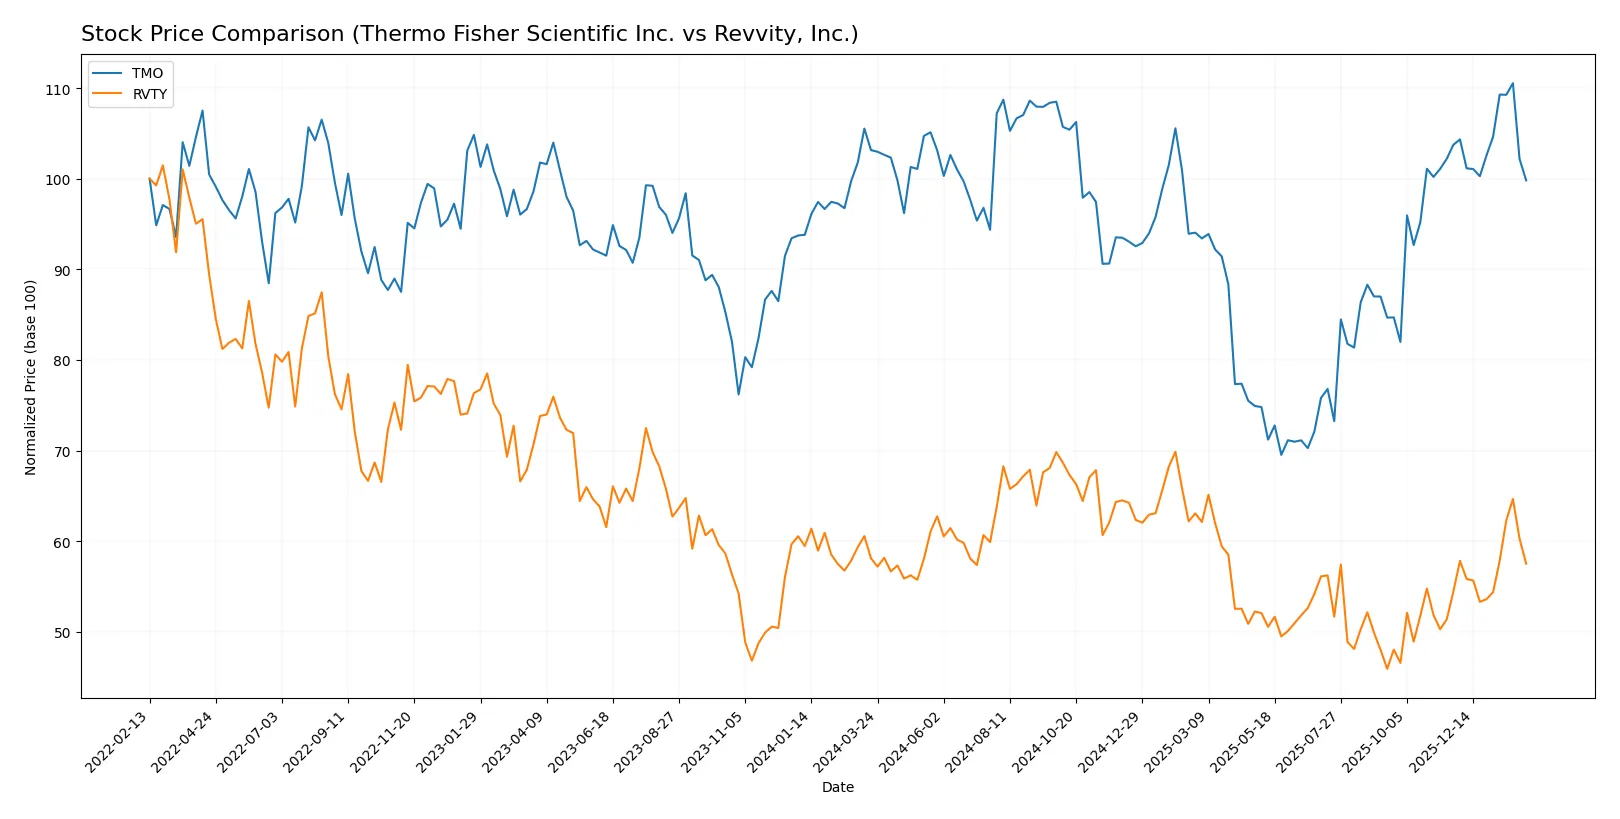
Trend Comparison
Thermo Fisher Scientific’s stock declined 3.24% over the past year, marking a bearish trend with accelerating downward momentum and a high price range between 394 and 626.
Revvity’s stock dropped 1.02% over the year, also bearish but less steep, with accelerating trends and a tighter price range from 83 to 126; recent gains suggest possible reversal.
Revvity delivered the highest market performance, showing a smaller overall loss and recent positive momentum compared to Thermo Fisher’s steeper decline.
Target Prices
Analysts show a clear upside consensus for both Thermo Fisher Scientific Inc. and Revvity, Inc.
| Company | Target Low | Target High | Consensus |
|---|---|---|---|
| Thermo Fisher Scientific Inc. | 561 | 750 | 643.69 |
| Revvity, Inc. | 105 | 129 | 115.14 |
The target consensus for Thermo Fisher suggests a 14% upside from the current 565 price, signaling strong confidence. Revvity’s targets imply roughly 11% growth potential from the 104 price, reflecting moderate optimism.

Don’t Let Luck Decide Your Entry Point
Optimize your entry points with our advanced ProRealTime indicators. You’ll get efficient buy signals with precise price targets for maximum performance. Start outperforming now!
How do institutions grade them?
Thermo Fisher Scientific Inc. Grades
The latest institutional grades for Thermo Fisher Scientific Inc. are as follows:
| Grading Company | Action | New Grade | Date |
|---|---|---|---|
| TD Cowen | Maintain | Buy | 2026-01-30 |
| Barclays | Maintain | Overweight | 2026-01-30 |
| Citigroup | Maintain | Buy | 2026-01-30 |
| Stifel | Maintain | Buy | 2026-01-09 |
| TD Cowen | Maintain | Buy | 2026-01-07 |
| Wells Fargo | Maintain | Overweight | 2025-12-15 |
| Citigroup | Upgrade | Buy | 2025-12-11 |
| Keybanc | Upgrade | Overweight | 2025-12-08 |
| Morgan Stanley | Maintain | Overweight | 2025-12-02 |
| HSBC | Upgrade | Buy | 2025-12-01 |
Revvity, Inc. Grades
The most recent grades given to Revvity, Inc. by institutional analysts are:
| Grading Company | Action | New Grade | Date |
|---|---|---|---|
| Jefferies | Maintain | Hold | 2026-02-03 |
| Wells Fargo | Maintain | Equal Weight | 2026-02-03 |
| TD Cowen | Maintain | Buy | 2026-02-03 |
| Barclays | Maintain | Overweight | 2026-02-03 |
| JP Morgan | Maintain | Neutral | 2026-02-03 |
| Evercore ISI Group | Maintain | Outperform | 2026-02-03 |
| Wells Fargo | Maintain | Equal Weight | 2025-12-15 |
| Barclays | Maintain | Overweight | 2025-12-15 |
| Barclays | Maintain | Overweight | 2025-10-28 |
| Baird | Maintain | Outperform | 2025-10-28 |
Which company has the best grades?
Thermo Fisher Scientific consistently receives Buy and Overweight ratings. Revvity’s grades range from Hold to Outperform, showing more variability. Investors may see Thermo Fisher as having stronger analyst conviction, which could affect confidence and valuation.
Risks specific to each company
The following categories identify the critical pressure points and systemic threats facing both firms in the 2026 market environment:
1. Market & Competition
Thermo Fisher Scientific Inc.
- Dominates with a $212B market cap and strong global presence, yet faces intense innovation pressure.
Revvity, Inc.
- Smaller $12B market cap with niche focus but higher beta, indicating greater sensitivity to competitive shifts.
2. Capital Structure & Debt
Thermo Fisher Scientific Inc.
- Moderate leverage (D/E 0.74), solid interest coverage (5.7x), but debt-to-equity score is very unfavorable.
Revvity, Inc.
- Lower leverage (D/E 0.46) with moderate interest coverage, reflecting a more conservative balance sheet stance.
3. Stock Volatility
Thermo Fisher Scientific Inc.
- Beta near 0.95 shows relatively stable stock behavior compared to market averages.
Revvity, Inc.
- Beta above 1.08 implies higher volatility and risk relative to the overall market.
4. Regulatory & Legal
Thermo Fisher Scientific Inc.
- Operates globally in diagnostics and biopharma, facing stringent regulations but with established compliance frameworks.
Revvity, Inc.
- Exposure to evolving genetic testing regulations may increase uncertainty, regulatory adaptability remains unproven.
5. Supply Chain & Operations
Thermo Fisher Scientific Inc.
- Extensive global supply chain with strong fixed asset turnover (4.22), but overall asset turnover is low (0.4).
Revvity, Inc.
- Lower asset turnover (0.23) may signal operational inefficiencies, though fixed asset turnover is slightly better (4.43).
6. ESG & Climate Transition
Thermo Fisher Scientific Inc.
- Large scale offers resources for ESG initiatives, yet slow asset turnover could indicate lagging operational efficiency improvements.
Revvity, Inc.
- Smaller scale but stronger Piotroski score suggests operational improvements that may support ESG goals effectively.
7. Geopolitical Exposure
Thermo Fisher Scientific Inc.
- Global footprint exposes it to geopolitical risks, but diversified markets mitigate concentrated impacts.
Revvity, Inc.
- Narrower international exposure heightens risk from regional disruptions but limits broad geopolitical volatility.
Which company shows a better risk-adjusted profile?
Thermo Fisher faces its biggest risk in managing high debt levels despite strong market dominance and operational scale. Revvity’s key risk lies in higher stock volatility and weaker profitability metrics. Overall, Thermo Fisher’s safer Altman Z-score and stable beta suggest a better risk-adjusted profile. Its debt-to-equity remains a red flag, but Revvity’s elevated beta and lower profitability amplify investor risk. The recent divergence in Altman Z-scores (3.09 safe zone for Thermo Fisher vs. 1.91 grey zone for Revvity) underscores my caution.
Final Verdict: Which stock to choose?
Thermo Fisher Scientific’s superpower lies in its robust operational efficiency and consistent cash generation. Despite a slightly declining ROIC and stretched valuation multiples, it sustains a strong market position with solid liquidity. It suits portfolios aiming for steady, large-cap exposure with moderate growth ambitions and risk tolerance.
Revvity stands out with a specialized moat anchored in its high gross margins and focused R&D intensity. While it carries more risk with weaker profitability and a volatile earnings trajectory, its lower leverage and improving free cash flow profile offer a cushion. It fits well within a GARP strategy for investors seeking niche growth with some margin of safety.
If you prioritize resilient cash flows and operational scale, Thermo Fisher outshines due to its dominant market presence and liquidity buffer. However, if you seek targeted growth with a tolerance for execution risk, Revvity offers better upside potential through its innovation-driven niche. Both present analytical scenarios that align with distinct investor profiles balancing growth and risk.
Disclaimer: Investment carries a risk of loss of initial capital. The past performance is not a reliable indicator of future results. Be sure to understand risks before making an investment decision.
Go Further
I encourage you to read the complete analyses of Thermo Fisher Scientific Inc. and Revvity, Inc. to enhance your investment decisions: