Home > Comparison > Industrials > WM vs RSG
The competitive dynamic between Waste Management, Inc. and Republic Services, Inc. shapes the U.S. waste management sector. Waste Management operates as a capital-intensive industrial leader with extensive landfill and energy assets. Republic Services focuses on integrated environmental solutions with a broad network of collection and recycling operations. This analysis examines their strategic positioning to identify which offers a superior risk-adjusted return for a diversified portfolio in today’s industrial landscape.
Table of contents
Companies Overview
Waste Management and Republic Services dominate the North American waste management market with distinct operational footprints.
Waste Management, Inc.: North America’s Leading Waste Solutions Provider
Waste Management, Inc. dominates the waste management sector through comprehensive collection, landfill operation, and recycling services. Its revenue stems mainly from residential, commercial, and municipal waste processing. In 2021, the company emphasized expanding landfill gas-to-energy projects and enhancing material recovery facilities, reinforcing its strategic focus on sustainable environmental services.
Republic Services, Inc.: Diversified Environmental Services Specialist
Republic Services, Inc. focuses on broad environmental solutions including waste collection, recycling, and non-hazardous disposal. Its core revenue arises from large-scale collection operations and landfill management across 41 states. The 2021 strategy centered on growing renewable energy projects from landfill gas and optimizing logistics for increased operational efficiency.
Strategic Collision: Similarities & Divergences
Both companies pursue environmental sustainability via landfill gas-to-energy but differ in scale and service breadth. Waste Management operates more landfills and recovery facilities, favoring a closed-loop infrastructure, while Republic Services adopts a more decentralized, service-diverse model. Their primary competition lies in municipal and commercial contracts. Investors face distinct profiles: Waste Management offers scale and integration; Republic Services provides diversification and regional agility.
Income Statement Comparison
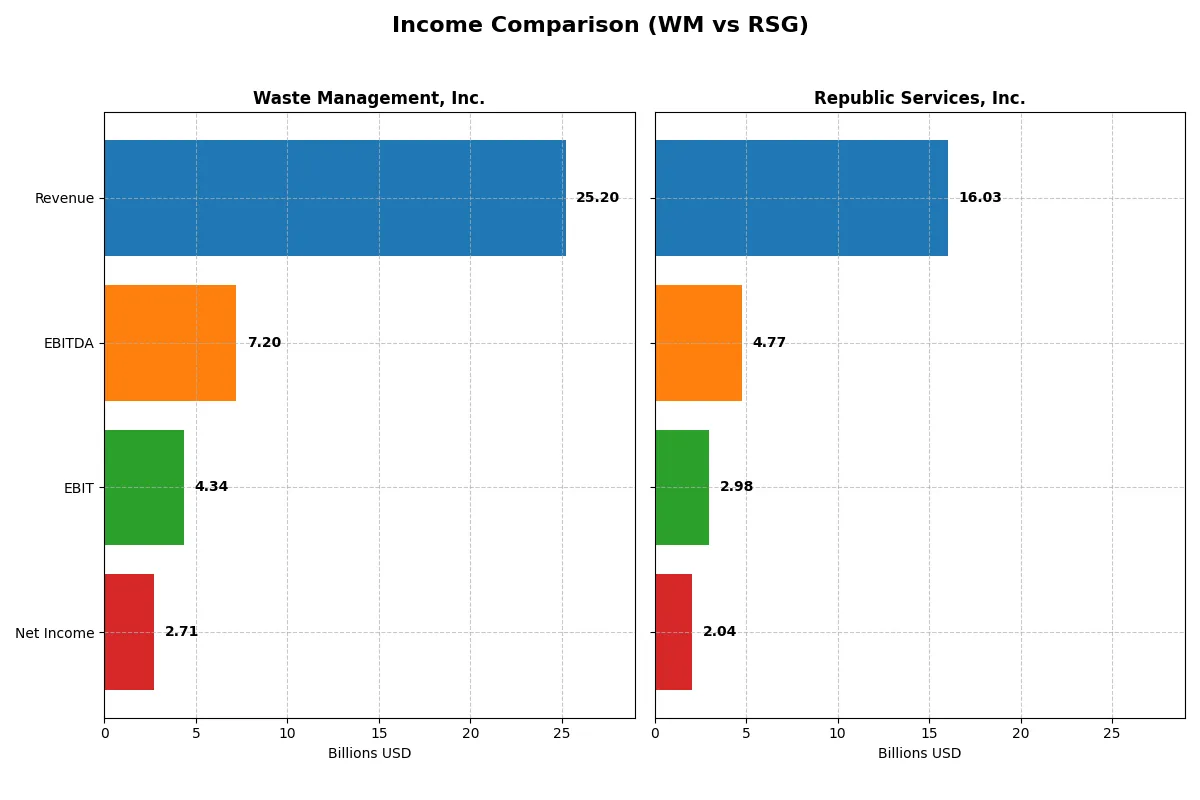
This data dissects the core profitability and scalability of both corporate engines to reveal who dominates the bottom line:
| Metric | Waste Management, Inc. (WM) | Republic Services, Inc. (RSG) |
|---|---|---|
| Revenue | 25.2B | 16.0B |
| Cost of Revenue | 17.9B | 11.1B |
| Operating Expenses | 2.72B | 1.67B |
| Gross Profit | 7.33B | 4.90B |
| EBITDA | 7.20B | 4.77B |
| EBIT | 4.34B | 2.98B |
| Interest Expense | 912M | 550M |
| Net Income | 2.71B | 2.04B |
| EPS | 6.72 | 6.50 |
| Fiscal Year | 2025 | 2024 |
Income Statement Analysis: The Bottom-Line Duel
The following income statement comparison uncovers which company delivers stronger operational efficiency and sustainable profit generation.
Waste Management, Inc. Analysis
Waste Management’s revenue climbed steadily from 17.9B in 2021 to 25.2B in 2025, with net income rising from 1.8B to 2.7B. Its gross margin held firm around 29%, while net margin remained favorable near 10.7%. Despite a slight net margin dip in 2025, the company demonstrated robust top-line growth and solid operating leverage.
Republic Services, Inc. Analysis
Republic Services grew revenue from 11.3B in 2021 to 16.0B in 2024, with net income surging from 1.3B to 2.0B. Gross margin stayed healthy at 30.5%, and net margin improved to 12.7%. The firm showed strong earnings momentum and efficiency gains, with double-digit EPS growth and expanding net margins in the latest year.
Margin Power vs. Revenue Scale
Republic Services excels in margin expansion and earnings growth, boasting a higher net margin and stronger EPS momentum. Waste Management leads in revenue scale and absolute profit but showed some margin pressure in 2025. Investors seeking growth and margin improvement may favor Republic’s profile; those valuing market dominance and steady scale might lean toward Waste Management.
Financial Ratios Comparison
These vital ratios act as a diagnostic tool to expose the underlying fiscal health, valuation premiums, and capital efficiency of the companies analyzed:
| Ratios | Waste Management (WM) | Republic Services (RSG) |
|---|---|---|
| ROE | 27.1% | 17.9% |
| ROIC | 8.9% | 9.3% |
| P/E | 32.7x | 31.0x |
| P/B | 8.9x | 5.5x |
| Current Ratio | 0.89 | 0.58 |
| Quick Ratio | 0.89 | 0.56 |
| D/E | 2.29 | 1.14 |
| Debt-to-Assets | 50.0% | 40.0% |
| Interest Coverage | 5.1x | 5.9x |
| Asset Turnover | 0.55 | 0.49 |
| Fixed Asset Turnover | 1.24 | 1.32 |
| Payout Ratio | 49.3% | 33.6% |
| Dividend Yield | 1.51% | 1.09% |
| Fiscal Year | 2025 | 2024 |
Efficiency & Valuation Duel: The Vital Signs
Ratios act as the company’s DNA, unveiling hidden risks and operational excellence crucial for informed investment decisions.
Waste Management, Inc.
Waste Management boasts a strong 27.1% ROE and a solid 10.7% net margin, signaling robust profitability. Yet, its P/E of 32.7 and P/B near 8.9 indicate an expensive valuation. The company returns value through a 1.5% dividend yield, balancing growth with shareholder income.
Republic Services, Inc.
Republic Services presents a lower 17.9% ROE but a higher 12.7% net margin, showing efficient profit conversion. Its P/E of 31.0 and P/B of 5.6 suggest a relatively stretched valuation. Dividend yield stands at 1.1%, reflecting moderate shareholder returns alongside reinvestment.
Premium Valuation vs. Operational Safety
Waste Management offers stronger profitability but trades at a higher valuation multiple than Republic Services. Republic’s metrics suggest more conservative leverage and operational efficiency. Investors seeking robust returns may prefer Waste Management, while those favoring steadier operational risk may lean toward Republic.
Which one offers the Superior Shareholder Reward?
I compare Waste Management (WM) and Republic Services (RSG) based on dividends, payout ratios, and buybacks. WM yields 1.51% with a 49% payout, supported by strong free cash flow coverage (1.32x). RSG offers a lower 1.09% yield and 34% payout but boasts a slightly higher free cash flow conversion (0.53x). WM’s buyback intensity is modest but consistent, while RSG maintains disciplined buybacks enhancing total return. WM’s higher payout ratio risks sustainability if cash flow dips, whereas RSG’s conservative model preserves capital for growth. For 2026, I favor RSG’s balanced distribution and reinvestment strategy as a more sustainable and superior total shareholder reward.
Comparative Score Analysis: The Strategic Profile
The radar chart reveals the fundamental DNA and trade-offs of Waste Management, Inc. and Republic Services, Inc., highlighting their financial strengths and vulnerabilities:
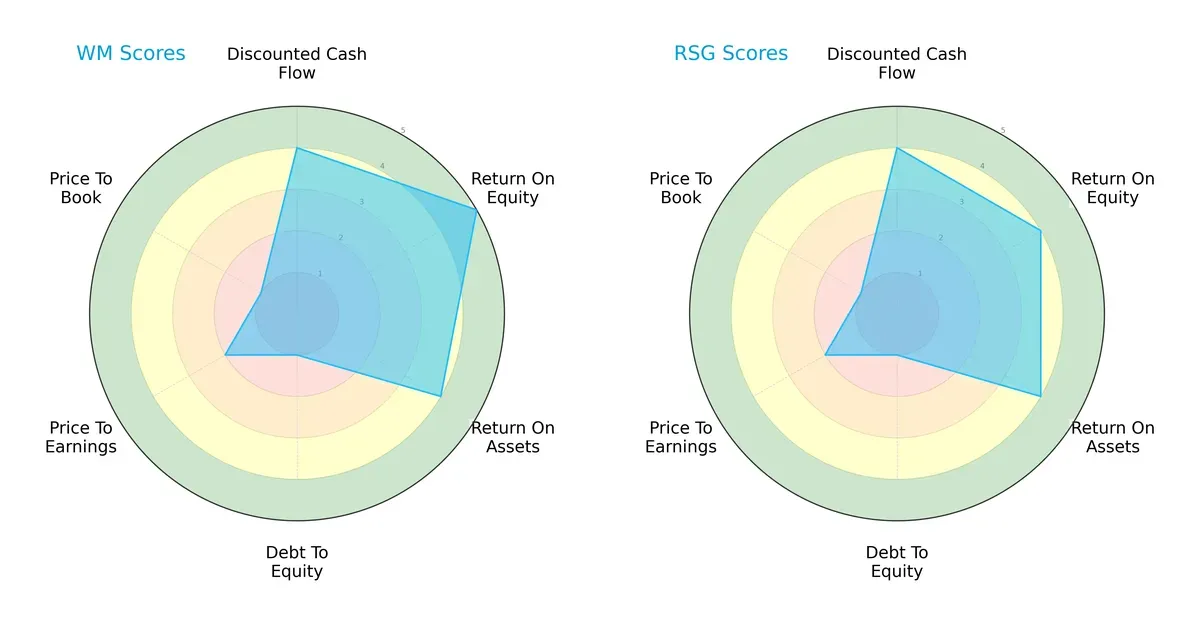
Waste Management edges out with a stronger ROE (5 vs. 4) and matching ROA (4 each), showing superior profit generation and asset efficiency. Both firms share identical DCF (4), Debt/Equity (1), and valuation scores (PE 2, PB 1), indicating similar market perceptions and leverage risks. Waste Management presents a more balanced profile with its return metrics advantage, while Republic Services relies evenly on moderate returns but suffers equally from leverage concerns.
—
Bankruptcy Risk: Solvency Showdown
The Altman Z-Score gap favors Republic Services, scoring safely at 3.01 versus Waste Management’s 2.38 in the grey zone, signaling differing bankruptcy risk levels in this cycle:
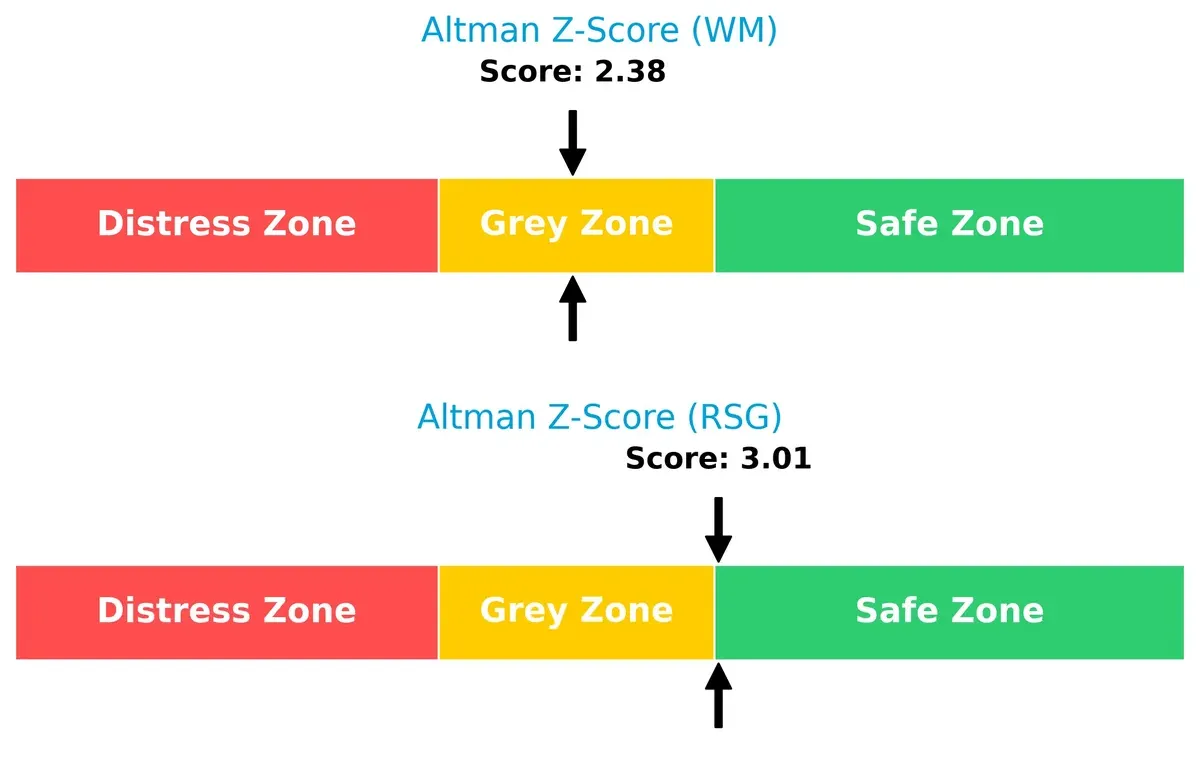
Republic Services currently maintains a safer financial footing with lower bankruptcy risk. Waste Management’s grey zone score indicates moderate vulnerability, signaling investors to monitor its solvency closely amid economic fluctuations.
—
Financial Health: Quality of Operations
Waste Management leads with a Piotroski F-Score of 7, signaling strong financial health, compared to Republic Services’ average 5, marking some operational red flags:
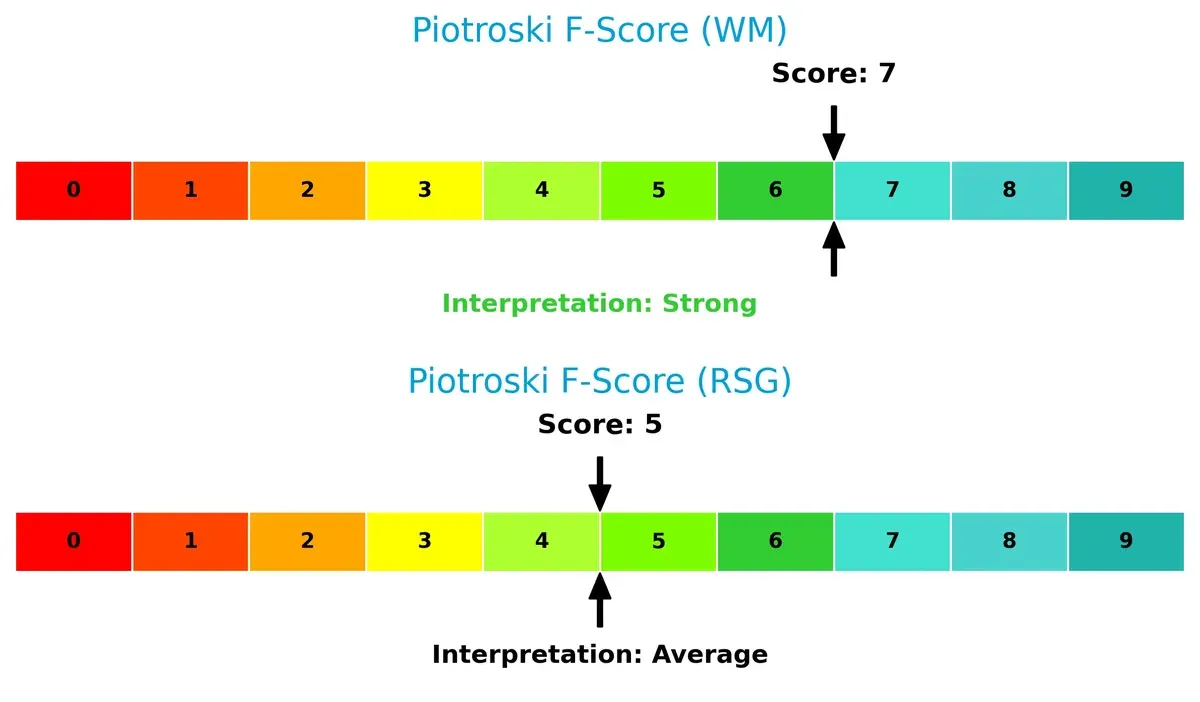
Waste Management demonstrates healthier internal metrics, reflecting robust profitability and efficiency. Republic Services’ lower score suggests weaker internal controls or financial stress points, warranting caution for risk-averse investors.
How are the two companies positioned?
This section dissects WM and RSG’s operational DNA by comparing their revenue distribution and internal strengths and weaknesses. The goal is to confront their economic moats to reveal which model delivers the most resilient, sustainable competitive advantage today.
Revenue Segmentation: The Strategic Mix
This visual comparison dissects how Waste Management, Inc. and Republic Services, Inc. diversify their income streams and highlights where their primary sector bets lie:
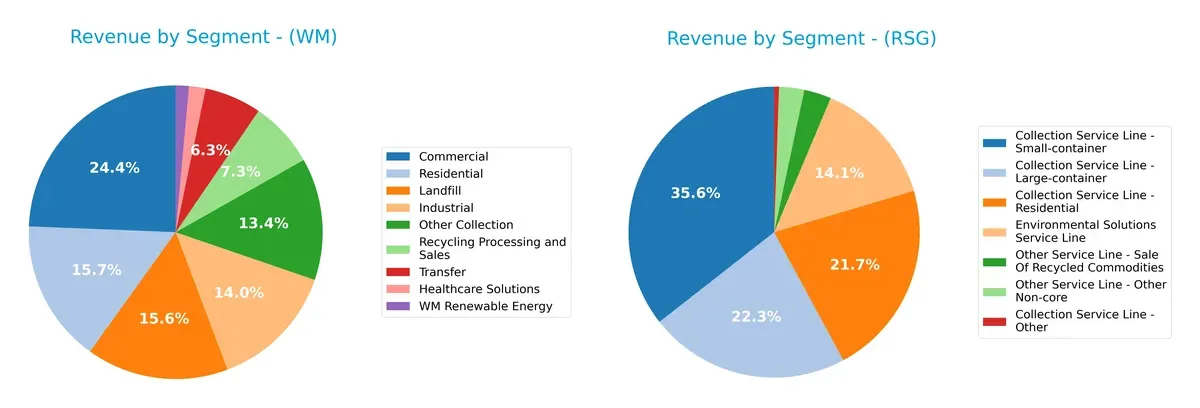
Waste Management anchors revenue in Commercial at $5.37B and Landfill at $3.45B, but also pivots across Residential ($3.47B) and Industrial ($3.09B), showing a balanced portfolio. Republic Services relies heavily on Collection Service Line – Small-container at $4.82B, with significant Residential ($2.94B) and Large-container ($3.02B) revenues, yet less segment diversity. WM’s broader spread mitigates concentration risk, while RSG’s focused mix leverages specialized collection dominance.
Strengths and Weaknesses Comparison
This table compares the strengths and weaknesses of Waste Management, Inc. (WM) and Republic Services, Inc. (RSG):
WM Strengths
- Diverse revenue streams across Commercial, Industrial, Residential, and Landfill segments
- Strong U.S. market presence with $21B revenue
- Favorable net margin at 10.74%
- High return on equity at 27.11%
- WACC below ROIC indicates efficient capital use
RSG Strengths
- Favorable net margin at 12.74%
- Solid return on equity at 17.91%
- Favorable interest coverage ratio of 5.42
- Diverse collection service lines including large and small containers
- Maintains a foothold in Canada market
WM Weaknesses
- Unfavorable current ratio at 0.89 signals liquidity risk
- High debt-to-equity ratio of 2.29 suggests leverage concerns
- Unfavorable price multiples (PE 32.67, PB 8.86) indicate stretched valuation
- Neutral ROIC vs WACC suggests limited incremental value creation
RSG Weaknesses
- Low current and quick ratios (0.58 and 0.56) imply liquidity constraints
- High debt-to-equity ratio at 1.14
- Unfavorable asset turnover at 0.49 points to inefficient asset use
- Unfavorable price multiples (PE 30.96, PB 5.55) reflect valuation pressure
Both companies show strengths in profitability and diversified service lines but face liquidity and leverage challenges. WM’s broader U.S. revenue base contrasts with RSG’s more segmented collection services and smaller international presence. These factors shape their strategic priorities amid sector dynamics.
The Moat Duel: Analyzing Competitive Defensibility
A structural moat is the only reliable shield protecting long-term profits from relentless competitive erosion. Let’s dissect the moats of two industry leaders:
Waste Management, Inc.: Scale and Intangible Asset Moat
Waste Management leverages vast scale and regulatory barriers as its moat. Its stable 17% EBIT margin and 3% ROIC premium show value creation despite a slight ROIC decline. New landfill gas-to-energy projects could reinforce this moat in 2026.
Republic Services, Inc.: Operational Efficiency and Growth Moat
Republic Services competes with a slightly different edge — operational efficiency and accelerating ROIC growth, surpassing WM with a 3.3% ROIC premium and rising profitability. Expansion into renewable energy projects enhances its moat’s depth.
Scale vs. Efficiency: The Moat Showdown
Republic Services boasts a deeper, expanding moat driven by improving ROIC and margin growth. Waste Management’s moat, while wide due to scale, faces challenges from declining profitability. Republic is better positioned to defend and grow market share.
Which stock offers better returns?
Over the past year, Waste Management, Inc. and Republic Services, Inc. showed distinct price movements and trading patterns, highlighting contrasting momentum and buyer-seller dynamics.
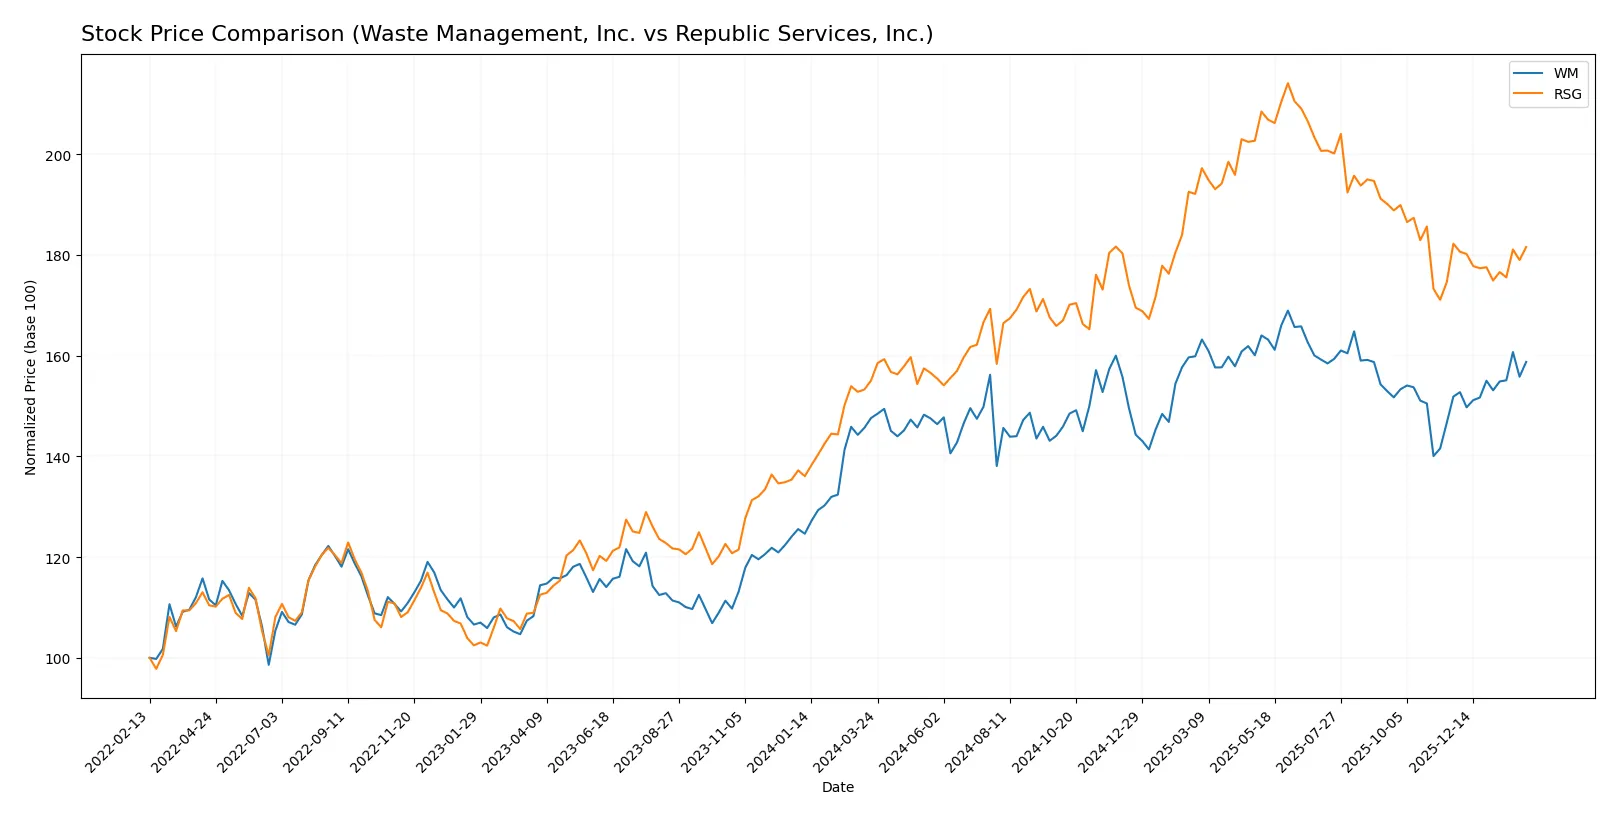
Trend Comparison
Waste Management, Inc. posted a 7.55% price increase over 12 months, indicating a bullish trend with accelerating momentum and moderate volatility (std dev 10.15). It reached a high of 240.97 and a low of 196.96.
Republic Services, Inc. gained 17.12% over the same period, also bullish but with decelerating momentum and higher volatility (std dev 19.47). Its price ranged between 185.19 and 257.29.
Comparing trends, Republic Services outperformed Waste Management in total returns despite slowing momentum, delivering the highest market performance over the past year.
Target Prices
Analysts present a bullish target consensus for both Waste Management, Inc. and Republic Services, Inc.
| Company | Target Low | Target High | Consensus |
|---|---|---|---|
| Waste Management, Inc. | 238 | 264 | 253.75 |
| Republic Services, Inc. | 220 | 257 | 243.1 |
The target consensus prices exceed current trading levels, indicating analyst expectations of 10-15% upside potential. This suggests confidence in sector resilience and operational strength.

Don’t Let Luck Decide Your Entry Point
Optimize your entry points with our advanced ProRealTime indicators. You’ll get efficient buy signals with precise price targets for maximum performance. Start outperforming now!
How do institutions grade them?
Waste Management, Inc. Grades
Here are the latest institutional grades for Waste Management, Inc.:
| Grading Company | Action | New Grade | Date |
|---|---|---|---|
| Wells Fargo | Maintain | Overweight | 2026-01-30 |
| Stifel | Maintain | Buy | 2026-01-30 |
| TD Cowen | Maintain | Buy | 2026-01-30 |
| RBC Capital | Maintain | Sector Perform | 2026-01-30 |
| Oppenheimer | Maintain | Outperform | 2026-01-30 |
| Wells Fargo | Maintain | Overweight | 2026-01-23 |
| Scotiabank | Downgrade | Sector Perform | 2026-01-21 |
| Barclays | Maintain | Overweight | 2026-01-20 |
| Citigroup | Maintain | Buy | 2026-01-16 |
| UBS | Upgrade | Buy | 2026-01-09 |
Republic Services, Inc. Grades
Below are the recent institutional grades for Republic Services, Inc.:
| Grading Company | Action | New Grade | Date |
|---|---|---|---|
| Oppenheimer | Maintain | Outperform | 2026-01-23 |
| Scotiabank | Maintain | Sector Perform | 2026-01-21 |
| Barclays | Maintain | Equal Weight | 2026-01-20 |
| Citigroup | Maintain | Buy | 2026-01-16 |
| Bernstein | Maintain | Market Perform | 2026-01-05 |
| B of A Securities | Maintain | Buy | 2025-12-22 |
| Scotiabank | Maintain | Sector Perform | 2025-10-31 |
| Stifel | Maintain | Buy | 2025-10-31 |
| JP Morgan | Maintain | Neutral | 2025-10-31 |
| UBS | Maintain | Neutral | 2025-10-16 |
Which company has the best grades?
Waste Management generally receives higher grades, including multiple “Buy” and “Overweight” ratings with recent upgrades. Republic Services shows more “Sector Perform” and “Neutral” ratings, indicating a more cautious outlook. Investors may interpret Waste Management’s stronger grades as a sign of greater confidence from analysts.
Risks specific to each company
The following categories identify critical pressure points and systemic threats facing Waste Management, Inc. and Republic Services, Inc. in the 2026 market environment:
1. Market & Competition
Waste Management, Inc.
- Dominates with larger market cap and scale, but faces high competitive pressure in waste management services.
Republic Services, Inc.
- Smaller market cap but aggressive growth in recycling and environmental solutions markets.
2. Capital Structure & Debt
Waste Management, Inc.
- High debt-to-equity ratio (2.29) signals elevated leverage risk. Interest coverage at 4.76 is moderate.
Republic Services, Inc.
- Lower debt-to-equity (1.14) but weaker liquidity ratios; interest coverage at 5.42 is healthier.
3. Stock Volatility
Waste Management, Inc.
- Beta of 0.586 shows moderate volatility below market average, reflecting stable investor sentiment.
Republic Services, Inc.
- Beta of 0.554 indicates slightly lower volatility, suggesting marginally better risk management.
4. Regulatory & Legal
Waste Management, Inc.
- Subject to stringent environmental regulations due to landfill operations and hazardous waste disposal.
Republic Services, Inc.
- Faces complex compliance challenges across multiple states, especially in renewable energy project permitting.
5. Supply Chain & Operations
Waste Management, Inc.
- Extensive asset base with 255 landfills and 340 transfer stations creates operational complexity.
Republic Services, Inc.
- Operates fewer landfills but with significant recycling facilities and injection wells, adding operational risk.
6. ESG & Climate Transition
Waste Management, Inc.
- Leading landfill gas-to-energy initiatives promote ESG compliance but face transition risks from stricter climate policies.
Republic Services, Inc.
- Strong focus on renewable energy projects but exposed to regulatory uncertainties impacting ESG goals.
7. Geopolitical Exposure
Waste Management, Inc.
- Primarily North America-focused, limiting exposure but vulnerable to US regulatory shifts.
Republic Services, Inc.
- Similar North American focus but diversified state-level regulatory environments increase geopolitical complexity.
Which company shows a better risk-adjusted profile?
The most impactful risk for Waste Management is its elevated leverage, reflected in a debt-to-equity ratio above 2, increasing financial vulnerability. Republic Services faces greater operational and regulatory complexity, particularly in renewable energy projects. While both have slightly unfavorable financial ratios, Republic Services’ stronger Altman Z-Score (3.01 vs. 2.38) places it in the safer zone. Hence, Republic Services shows a marginally better risk-adjusted profile, supported by its healthier interest coverage and lower beta, despite its operational challenges.
Final Verdict: Which stock to choose?
Waste Management, Inc. shines as a cash-generating powerhouse with a strong return on equity that supports sustained value creation. Its main point of vigilance is a somewhat stretched balance sheet, reflected in a low current ratio and high debt levels. This stock suits aggressive growth investors who tolerate leverage for higher returns.
Republic Services, Inc. offers a strategic moat through steadily growing profitability and a solid capital efficiency trend. Its lower leverage and better Altman Z-Score reflect comparatively stronger financial stability than Waste Management. It fits well within Growth at a Reasonable Price (GARP) portfolios seeking a blend of growth and safety.
If you prioritize aggressive growth and are comfortable with financial leverage, Waste Management outshines due to its superior equity returns and cash flow engine. However, if you seek better stability and a sustainable competitive advantage, Republic Services offers a compelling scenario with its improving ROIC trend and healthier balance sheet metrics. Both stocks carry risks, but each appeals to distinct investor profiles.
Disclaimer: Investment carries a risk of loss of initial capital. The past performance is not a reliable indicator of future results. Be sure to understand risks before making an investment decision.
Go Further
I encourage you to read the complete analyses of Waste Management, Inc. and Republic Services, Inc. to enhance your investment decisions: