Home > Comparison > Financial Services > USB vs RF
The strategic rivalry between U.S. Bancorp and Regions Financial Corporation shapes the competitive landscape of regional banking. U.S. Bancorp operates as a diversified financial services powerhouse with broad geographic reach and varied business lines. In contrast, Regions Financial focuses on a leaner regional banking model emphasizing commercial and consumer banking in the South and Midwest. This analysis will identify which company’s strategy offers superior risk-adjusted returns for diversified portfolios.

Table of contents
Companies Overview
U.S. Bancorp and Regions Financial Corporation both hold significant positions in the regional banking sector, shaping financial services across distinct U.S. regions.
U.S. Bancorp: Midwest and West Banking Powerhouse
U.S. Bancorp is a regional banking leader with a broad financial services portfolio. It generates revenue from corporate and commercial banking, consumer banking, wealth management, and payment services. In 2021, it focused on expanding digital channels and enhancing treasury management, leveraging a network of 2,230 branches and 4,059 ATMs to deepen market penetration.
Regions Financial Corporation: Southern and Midwest Regional Bank
Regions Financial Corporation operates primarily in the South, Midwest, and Texas with a focus on commercial and consumer banking. Its core revenue streams include commercial loans, residential mortgages, and wealth management services. In 2022, Regions emphasized growth in commercial real estate and consumer credit products, supported by 1,300 branches and 2,000 ATMs, aiming to strengthen relationships in its core markets.
Strategic Collision: Similarities & Divergences
Both banks emphasize regional dominance and diversified banking services, but U.S. Bancorp leans on a larger branch network and a more extensive service suite, while Regions targets specialized commercial real estate and consumer credit growth. They compete intensely for middle-market corporate clients and retail customers in overlapping Midwest areas. Their investment profiles diverge sharply: U.S. Bancorp offers scale and breadth, whereas Regions focuses on niche market expansion and targeted financial products.
Income Statement Comparison
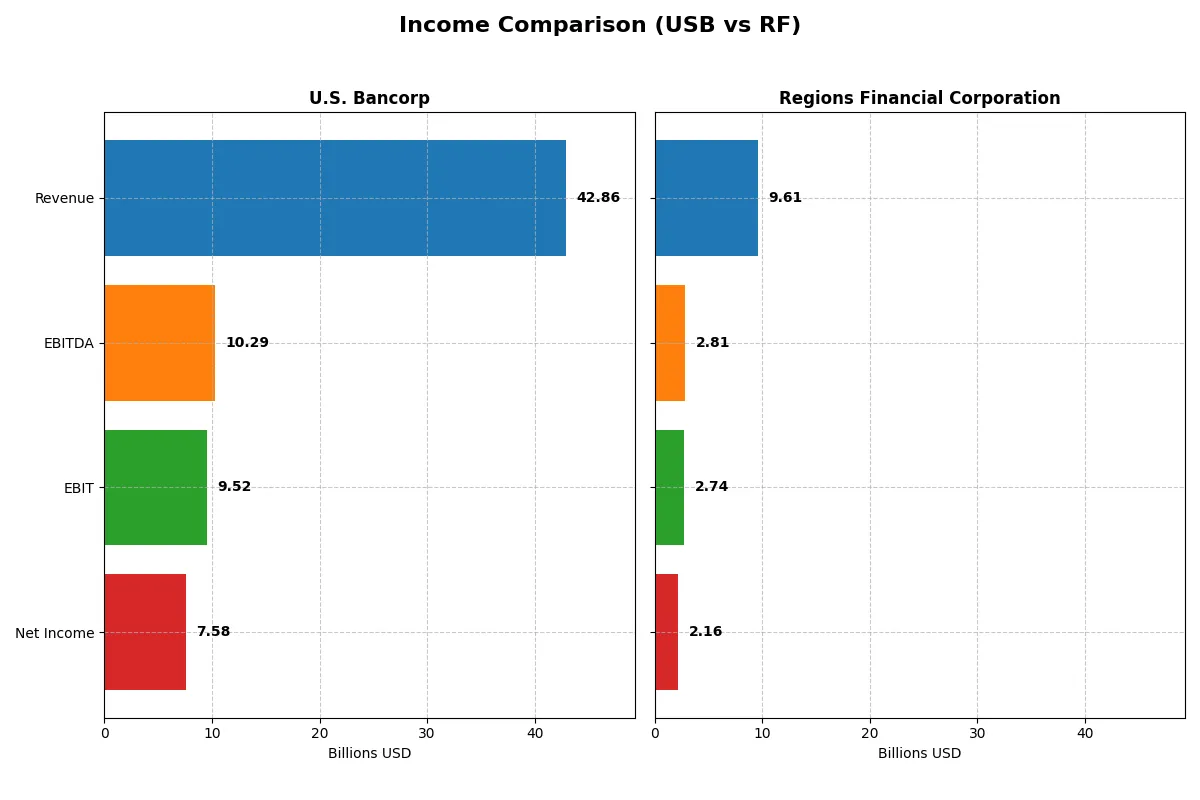
This data dissects the core profitability and scalability of both corporate engines to reveal who dominates the bottom line:
| Metric | U.S. Bancorp (USB) | Regions Financial Corporation (RF) |
|---|---|---|
| Revenue | 42.9B | 9.6B |
| Cost of Revenue | 15.9B | 2.4B |
| Operating Expenses | 17.4B | 4.4B |
| Gross Profit | 26.9B | 7.2B |
| EBITDA | 10.3B | 2.8B |
| EBIT | 9.5B | 2.7B |
| Interest Expense | 14.3B | 2.1B |
| Net Income | 7.6B | 2.2B |
| EPS | 4.62 | 2.31 |
| Fiscal Year | 2025 | 2025 |
Income Statement Analysis: The Bottom-Line Duel
This income statement comparison reveals the true efficiency and profitability of each company’s core business engine over recent years.
U.S. Bancorp Analysis
U.S. Bancorp grew revenue from $23.7B in 2021 to $42.9B in 2025, showing strong top-line expansion. Net income fluctuated, peaking at $7.6B in 2025 but down overall since 2021. Gross margin remains healthy at 62.8%, with net margin at 17.7%, reflecting solid profitability. The 2025 jump in EBIT by 20% signals improving operational efficiency.
Regions Financial Corporation Analysis
Regions Financial expanded revenue from $6.6B in 2021 to $9.6B in 2025, a moderate growth pace. Net income declined from $2.5B in 2021 to $2.2B in 2025 despite margin strength. Gross margin at 74.6% and net margin at 22.4% indicate robust cost management. The 2025 EBIT increased 16.5%, showing steady momentum in operations.
Margin Power vs. Revenue Scale
U.S. Bancorp leads in revenue scale and recent EBIT growth, while Regions Financial exhibits superior margins and consistent profitability ratios. U.S. Bancorp’s size and improving efficiency favor growth-oriented investors. Regions Financial’s margin strength offers a resilient earnings profile. Investors must weigh scale against margin quality when choosing between these profiles.
Financial Ratios Comparison
These vital ratios act as a diagnostic tool to expose the underlying fiscal health, valuation premiums, and capital efficiency of the companies compared below:
| Ratios | U.S. Bancorp (USB) | Regions Financial Corporation (RF) |
|---|---|---|
| ROE | 11.6% | 11.3% |
| ROIC | 11.1% | 13.8% |
| P/E | 10.95 | 10.99 |
| P/B | 1.27 | 1.25 |
| Current Ratio | 2.73 | 0.30 |
| Quick Ratio | 2.73 | 0.30 |
| D/E | 1.20 | 0.26 |
| Debt-to-Assets | 11.3% | 3.1% |
| Interest Coverage | 0.66 | 1.32 |
| Asset Turnover | 0.062 | 0.060 |
| Fixed Asset Turnover | 11.38 | 5.79 |
| Payout Ratio | 41.5% | 41.8% |
| Dividend Yield | 3.79% | 3.80% |
| Fiscal Year | 2025 | 2025 |
Efficiency & Valuation Duel: The Vital Signs
Financial ratios serve as a company’s DNA, exposing hidden risks and operational strengths vital for sound investment decisions.
U.S. Bancorp
U.S. Bancorp posts a solid ROE of 11.6% with a strong net margin of 17.7%, indicating steady profitability. The P/E ratio at 10.95 suggests the stock trades at a reasonable valuation. A healthy dividend yield of 3.79% rewards shareholders, reflecting disciplined capital allocation despite some concerns in ROIC and interest coverage.
Regions Financial Corporation
Regions Financial shows a slightly lower ROE at 11.3% but boasts a higher net margin of 22.4%, signaling efficient operations. Its P/E of 11.0 remains attractive, while a comparable dividend yield of 3.8% complements strong ROIC at 13.8%. However, liquidity ratios remain weak, hinting at potential short-term risk.
Balanced Valuation Meets Operational Resilience
Both firms present favorable valuations and dividend yields, with U.S. Bancorp showing better liquidity and Regions Financial excelling in operational efficiency. Investors prioritizing stable dividends and current ratio safety may prefer U.S. Bancorp, while those seeking higher ROIC might lean toward Regions Financial.
Which one offers the Superior Shareholder Reward?
I observe U.S. Bancorp (USB) delivers a higher dividend yield near 3.8% with a payout ratio of 41%, well-covered by earnings. Regions Financial (RF) offers a similar yield around 3.8% but with a lower payout near 42%. USB’s share buyback program appears more aggressive, enhancing shareholder returns beyond dividends. RF’s lower leverage and higher profit margins hint at sustainable growth but a more conservative capital return approach. USB’s blend of steady dividends and intense buybacks offers a superior total return profile in 2026.
Comparative Score Analysis: The Strategic Profile
The radar chart reveals the fundamental DNA and trade-offs of U.S. Bancorp and Regions Financial Corporation:
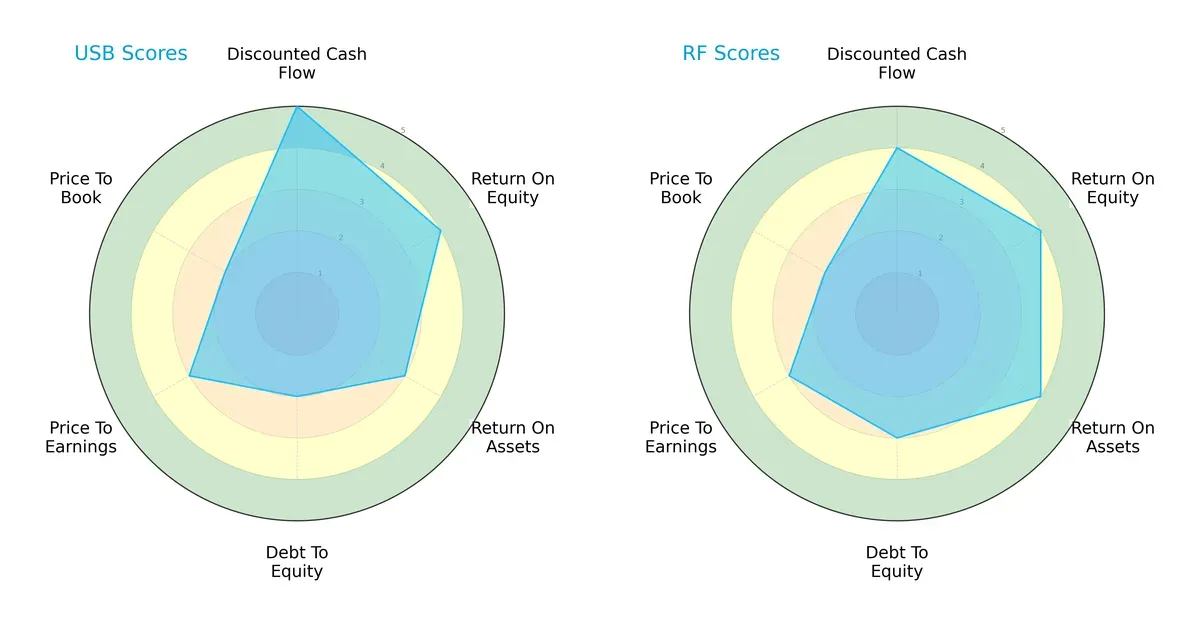
U.S. Bancorp excels in discounted cash flow with a top score of 5 but lags in debt-to-equity at 2, indicating heavier leverage risk. Regions Financial shows a more balanced profile, scoring 4 across ROE, ROA, and DCF metrics, with slightly better debt management. Regions’ steadier operational efficiency contrasts with U.S. Bancorp’s reliance on cash flow strength.
Bankruptcy Risk: Solvency Showdown
The Altman Z-Scores place both banks firmly in the distress zone, highlighting substantial bankruptcy risk in the current cycle:
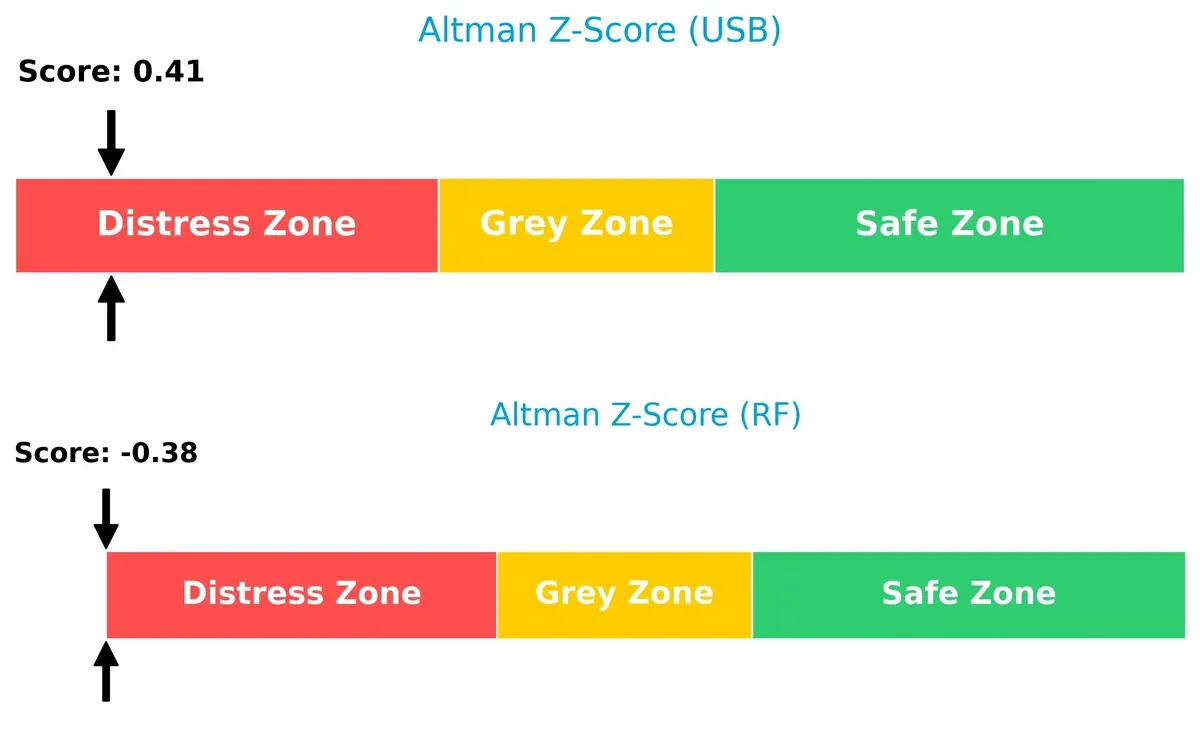
Regions Financial’s score of -0.38 edges below U.S. Bancorp’s 0.41, signaling marginally higher financial distress. These low scores reflect sector-wide pressures and demand cautious exposure.
Financial Health: Quality of Operations
Regions Financial displays peak financial health with a Piotroski F-Score of 9, while U.S. Bancorp posts an average 6, signaling some internal operational weaknesses:
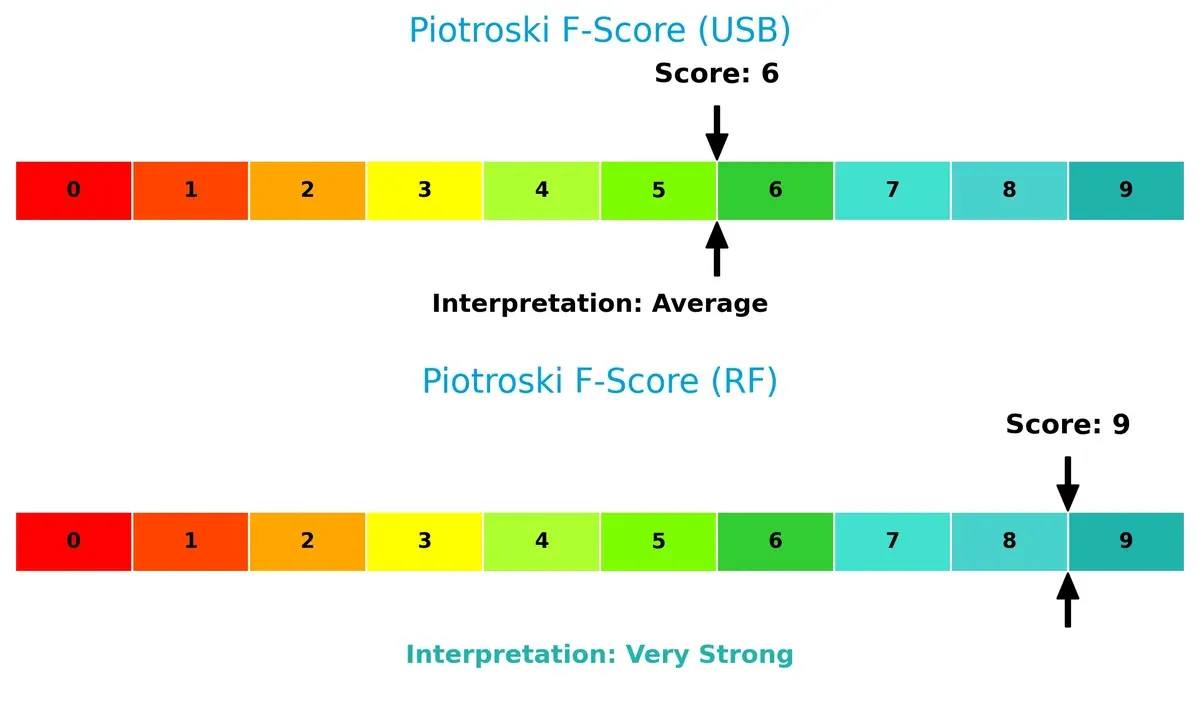
Regions’ very strong score underscores robust profitability, liquidity, and efficiency. U.S. Bancorp’s moderate score suggests room for improvement in financial quality and risk controls. Investors should weigh these operational signals carefully.
How are the two companies positioned?
This section dissects the operational DNA of U.S. Bancorp and Regions Financial by comparing their revenue distribution and internal dynamics. The goal is to confront their economic moats and identify which model offers the most resilient and sustainable advantage today.
Revenue Segmentation: The Strategic Mix
This visual comparison dissects how U.S. Bancorp and Regions Financial diversify their income streams and where their primary sector bets lie:
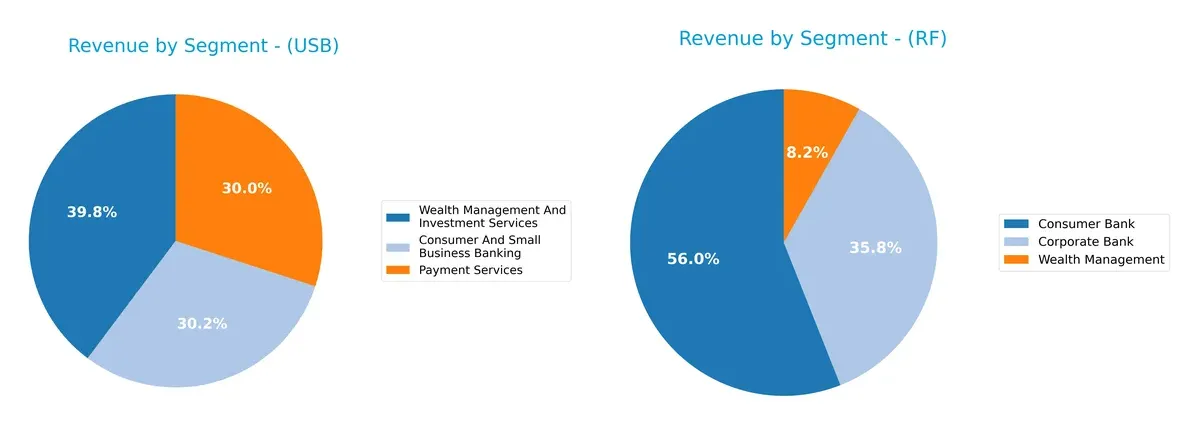
U.S. Bancorp generates $12.2B from Wealth Management, anchoring its revenue alongside $9.3B in Consumer Banking and $9.2B from Payment Services. This balanced mix diversifies risk and strengthens ecosystem lock-in. Regions Financial relies heavily on Consumer Banking ($3.1B) and Corporate Banking ($2.0B), with a smaller $457M Wealth Management segment, showing less diversification and higher concentration risk in core banking operations.
Strengths and Weaknesses Comparison
This table compares the Strengths and Weaknesses of U.S. Bancorp and Regions Financial Corporation:
U.S. Bancorp Strengths
- Diversified revenue streams across four major business segments
- Favorable net margin at 17.68%
- Strong current and quick ratios at 2.73
- Favorable price-to-earnings and price-to-book ratios
- Solid dividend yield near 3.79%
- Favorable fixed asset turnover at 11.38
Regions Financial Corporation Strengths
- Higher net margin at 22.44% supports profitability
- Favorable ROIC at 13.79% above WACC
- Low debt-to-equity ratio at 0.26
- Favorable price-to-earnings and price-to-book ratios
- Dividend yield slightly higher at 3.80%
- Favorable fixed asset turnover at 5.79
U.S. Bancorp Weaknesses
- ROIC below WACC signals capital inefficiency
- Debt-to-equity ratio of 1.2 is relatively high
- Interest coverage below 1 indicates risk
- Low asset turnover at 0.06
- Neutral ROE at 11.62% restricts growth potential
- Negative Treasury and Corporate Support segment in 2024
Regions Financial Corporation Weaknesses
- Very low current and quick ratios at 0.3 raise liquidity concerns
- Interest coverage low at 1.32, indicating risk
- Asset turnover also low at 0.06
- WACC at 12.53% is unfavorable
- Neutral ROE at 11.32% limits returns
- Smaller scale and less revenue diversification evident
Both companies present a favorable overall financial ratio profile but show distinct risk exposures. U.S. Bancorp’s strength lies in diversification and liquidity, while Regions excels in profitability and capital efficiency. Both face challenges in improving asset utilization and interest coverage. This contrast shapes their strategic priorities in balancing growth with risk management.
The Moat Duel: Analyzing Competitive Defensibility
A structural moat is the only true safeguard against long-term profit erosion from competition. Let’s dissect the competitive advantages of two regional banks in 2026:
U.S. Bancorp (USB): Emerging Efficiency Moat
USB’s moat stems from improving operational efficiency and scale economies. Its ROIC, though below WACC, climbed 63% recently, signaling growing profitability despite current value destruction. Expanding digital services could deepen its moat if cost controls hold.
Regions Financial Corporation (RF): Developing Profitability Moat
RF leverages a stronger ROIC relative to WACC, indicating initial value creation unlike USB. Its moat is rooted in higher gross and EBIT margins, supported by efficient capital deployment. Growth in commercial banking and wealth management may fuel further moat expansion.
ROIC Growth vs. Value Creation: Who Holds the Deeper Moat?
RF outperforms USB by sustaining ROIC above WACC, translating to real value creation. USB shows faster ROIC growth but remains a value destroyer. RF is better positioned to defend and grow market share amid rising competition.
Which stock offers better returns?
The past 12 months show strong bullish momentum for both U.S. Bancorp and Regions Financial Corporation, with significant price appreciation and accelerating upward trends.
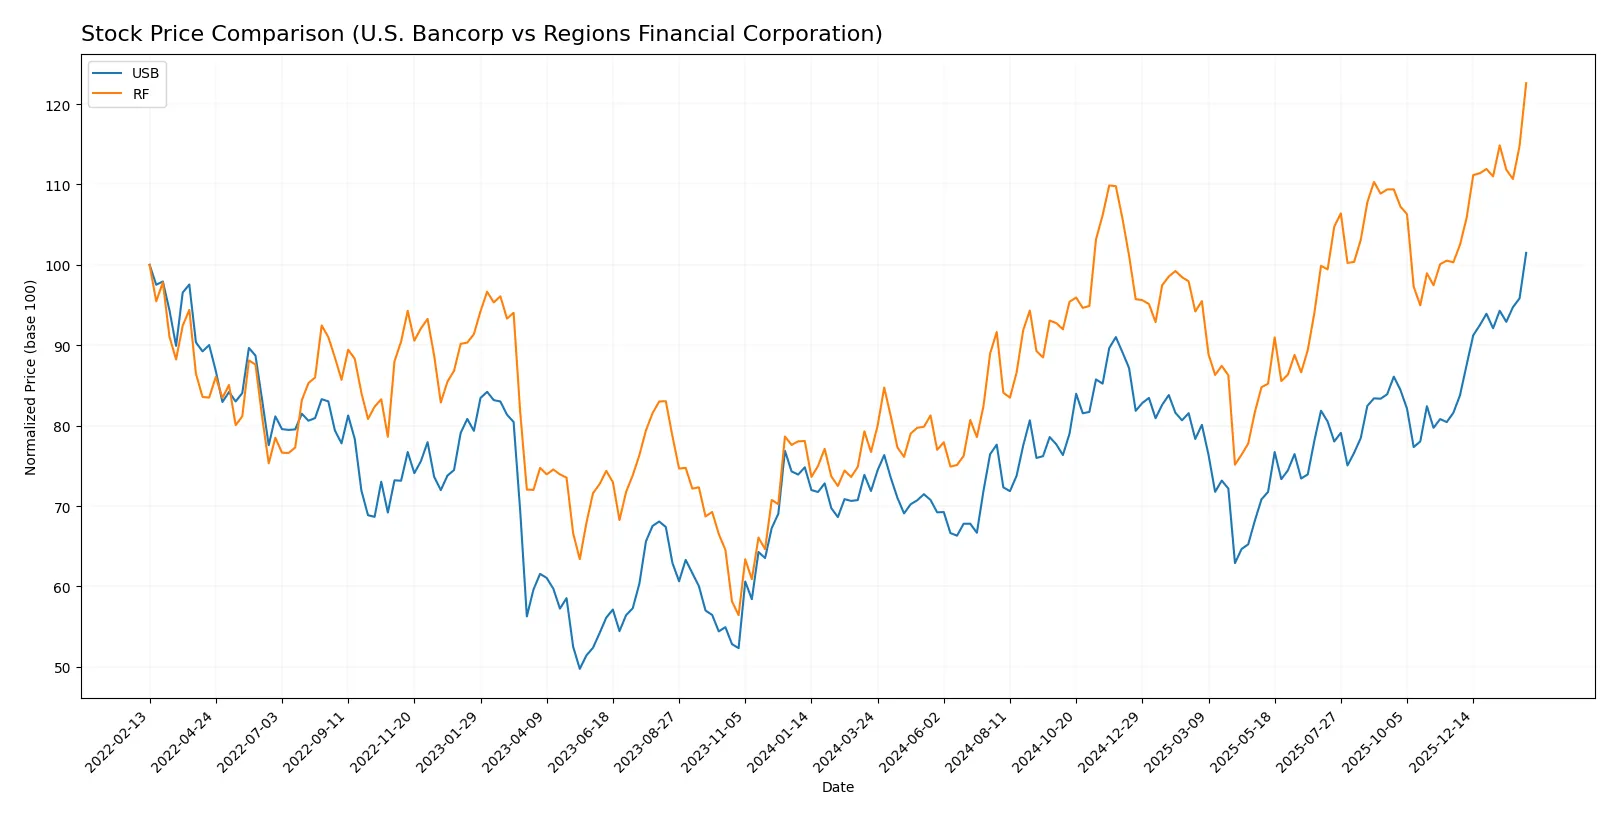
Trend Comparison
U.S. Bancorp’s stock rose 41.21% over the past year, showing acceleration and a high price range between 36.83 and 59.42. Volatility is moderate, with a 4.52 standard deviation.
Regions Financial Corporation gained 59.79% over the same period, also accelerating but with lower volatility at 2.85 standard deviation. Its price ranged from 18.6 to 30.44.
Regions Financial outperformed U.S. Bancorp in total price appreciation, delivering a stronger market return over the last 12 months.
Target Prices
Analysts present a clear consensus on target prices for U.S. Bancorp and Regions Financial Corporation.
| Company | Target Low | Target High | Consensus |
|---|---|---|---|
| U.S. Bancorp | 52 | 65 | 58.96 |
| Regions Financial Corporation | 27 | 32 | 29.9 |
The target consensus for U.S. Bancorp sits slightly below its current price of $59.42, signaling moderate upside potential. Regions Financial’s consensus at $29.9 closely aligns with its $30.44 market price, indicating a balanced risk-reward profile.

Don’t Let Luck Decide Your Entry Point
Optimize your entry points with our advanced ProRealTime indicators. You’ll get efficient buy signals with precise price targets for maximum performance. Start outperforming now!
How do institutions grade them?
Institutional grades for U.S. Bancorp and Regions Financial Corporation highlight recent analyst views:
U.S. Bancorp Grades
The table below summarizes recent institutional grades for U.S. Bancorp:
| Grading Company | Action | New Grade | Date |
|---|---|---|---|
| Argus Research | Maintain | Buy | 2026-01-22 |
| RBC Capital | Maintain | Outperform | 2026-01-21 |
| Keefe, Bruyette & Woods | Maintain | Market Perform | 2026-01-21 |
| DA Davidson | Maintain | Buy | 2026-01-21 |
| Truist Securities | Maintain | Hold | 2026-01-21 |
| TD Cowen | Maintain | Buy | 2026-01-21 |
| Oppenheimer | Maintain | Outperform | 2026-01-21 |
| TD Cowen | Maintain | Buy | 2026-01-07 |
| Wolfe Research | Downgrade | Peer Perform | 2026-01-07 |
| Barclays | Maintain | Overweight | 2026-01-05 |
Regions Financial Corporation Grades
The table below summarizes recent institutional grades for Regions Financial Corporation:
| Grading Company | Action | New Grade | Date |
|---|---|---|---|
| Piper Sandler | Maintain | Neutral | 2026-01-20 |
| Wells Fargo | Maintain | Underweight | 2026-01-20 |
| Keefe, Bruyette & Woods | Downgrade | Market Perform | 2026-01-20 |
| Wells Fargo | Downgrade | Underweight | 2026-01-16 |
| Evercore ISI Group | Downgrade | Underperform | 2026-01-06 |
| Barclays | Maintain | Underweight | 2026-01-05 |
| Truist Securities | Maintain | Hold | 2025-12-22 |
| Keefe, Bruyette & Woods | Maintain | Outperform | 2025-12-17 |
| Truist Securities | Maintain | Hold | 2025-10-20 |
| Stephens & Co. | Downgrade | Equal Weight | 2025-10-14 |
Which company has the best grades?
U.S. Bancorp holds consistently positive grades, mainly Buy and Outperform, signaling stronger analyst confidence. Regions Financial shows mixed to negative revisions, with several downgrades to Underweight and Underperform. Investors may view U.S. Bancorp’s grades as more favorable for potential upside.
Risks specific to each company
The following categories identify the critical pressure points and systemic threats facing U.S. Bancorp and Regions Financial Corporation in the 2026 market environment:
1. Market & Competition
U.S. Bancorp
- Faces intense regional banking competition with a broad Midwest and West footprint.
Regions Financial Corporation
- Competes aggressively in the South, Midwest, and Texas markets with fewer branches but strong local presence.
2. Capital Structure & Debt
U.S. Bancorp
- Higher debt-to-equity ratio (1.2) signals leverage risk despite manageable debt-to-assets (11.26%).
Regions Financial Corporation
- Lower debt-to-equity (0.26) and debt-to-assets (3.06%) reflect a more conservative capital structure.
3. Stock Volatility
U.S. Bancorp
- Beta of 1.057 indicates moderate volatility in line with regional bank peers.
Regions Financial Corporation
- Slightly lower beta of 1.027 suggests marginally less stock price fluctuation.
4. Regulatory & Legal
U.S. Bancorp
- Subject to stringent federal regulations across multiple business segments.
Regions Financial Corporation
- Faces similar regulatory frameworks but with regional focus potentially reducing complexity.
5. Supply Chain & Operations
U.S. Bancorp
- Large branch and ATM network (2,230 offices, 4,059 ATMs) increases operational complexity and costs.
Regions Financial Corporation
- Smaller network (1,300 offices, 2,000 ATMs) limits operational overhead but may constrain growth.
6. ESG & Climate Transition
U.S. Bancorp
- Increasing ESG pressures to align with national climate goals, given its size and footprint.
Regions Financial Corporation
- Faces similar ESG demands but with potentially more regional agility in climate initiatives.
7. Geopolitical Exposure
U.S. Bancorp
- Primarily domestic exposure limits geopolitical risk but vulnerable to US economic cycles.
Regions Financial Corporation
- Also domestically focused, with similar exposure concentrated in the southern US economy.
Which company shows a better risk-adjusted profile?
Regions Financial Corporation’s lower leverage and stronger Piotroski score (9 vs. 6) indicate superior financial resilience. U.S. Bancorp’s higher debt and Altman Z-Score in distress zone raise red flags. Despite comparable market risks, Regions stands out in managing capital prudently under current macro conditions.
Final Verdict: Which stock to choose?
U.S. Bancorp’s superpower lies in its robust liquidity and consistent dividend yield, signaling a reliable income source. Its key point of vigilance is the slightly unfavorable capital efficiency, which could pressure long-term value creation. It suits portfolios seeking steady income with moderate growth exposure.
Regions Financial Corporation commands a strategic moat through higher returns on invested capital and a stronger balance sheet, reflecting efficient capital use. Compared to U.S. Bancorp, it offers better financial stability and a slightly stronger growth trajectory. It fits well in GARP portfolios that balance growth with valuation discipline.
If you prioritize income stability and dividend reliability, U.S. Bancorp is the compelling choice due to its liquidity and yield profile. However, if you seek capital efficiency combined with moderate growth, Regions Financial outshines by delivering better operational returns and a safer balance sheet. Both carry risks typical for regional banks, so careful monitoring is advised.
Disclaimer: Investment carries a risk of loss of initial capital. The past performance is not a reliable indicator of future results. Be sure to understand risks before making an investment decision.
Go Further
I encourage you to read the complete analyses of U.S. Bancorp and Regions Financial Corporation to enhance your investment decisions: