Home > Comparison > Financial Services > TFC vs RF
The strategic rivalry between Truist Financial Corporation and Regions Financial Corporation shapes regional banking dynamics in the U.S. Truist operates as a diversified financial services powerhouse with a broad spectrum spanning consumer banking, wealth management, and insurance. Regions focuses on commercial and consumer banking with specialized wealth management and advisory services. This analysis pits their distinct operational models to identify which offers superior risk-adjusted returns for a balanced portfolio.

Table of contents
Companies Overview
Truist Financial Corporation and Regions Financial Corporation both shape regional banking across the US Southeast and Midwest.
Truist Financial Corporation: Comprehensive Regional Banking Leader
Truist dominates the Southeastern and Mid-Atlantic banking sector with a diversified revenue model spanning consumer banking, wealth management, and insurance. Its 2021 strategy emphasized expanding digital banking and integrated financial services through 2,517 branches. Truist’s expansive product suite, including mortgages, commercial lending, and investment advisory, underpins its broad competitive advantage in the regional market.
Regions Financial Corporation: Focused Regional Banking and Wealth Management
Regions Financial serves the South, Midwest, and Texas with a core focus on commercial banking, consumer loans, and wealth management. In 2022, it prioritized enhancing its corporate lending and specialized advisory services across 1,300 branches and 2,000 ATMs. Regions’ strategic emphasis on commercial real estate and middle-market clients forms the backbone of its market positioning in regional financial services.
Strategic Collision: Similarities & Divergences
Both firms compete in regional banking with multi-segment business models yet diverge on scale and breadth. Truist favors a wide-ranging ecosystem combining insurance and retail banking, while Regions leans into a targeted corporate and real estate lending approach. Their primary battleground is commercial lending in the Southeast. Investors will find distinct profiles: Truist’s scale contrasts with Regions’ focused niche, shaping different risk and growth dynamics.
Income Statement Comparison
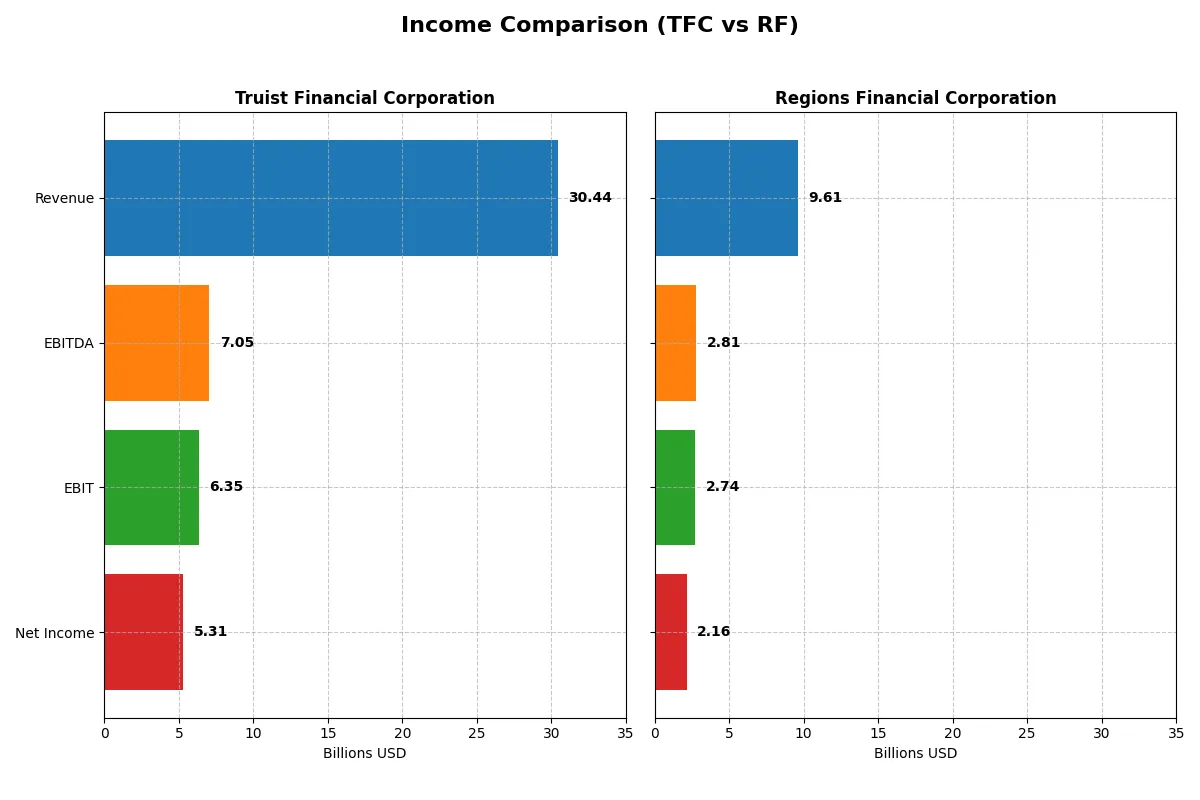
The following data dissects the core profitability and scalability of both corporate engines to reveal who dominates the bottom line:
| Metric | Truist Financial Corporation (TFC) | Regions Financial Corporation (RF) |
|---|---|---|
| Revenue | 30.4B | 9.6B |
| Cost of Revenue | 11.5B | 2.4B |
| Operating Expenses | 12.6B | 4.4B |
| Gross Profit | 18.9B | 7.2B |
| EBITDA | 7.1B | 2.8B |
| EBIT | 6.3B | 2.7B |
| Interest Expense | 10.1B | 2.1B |
| Net Income | 5.3B | 2.2B |
| EPS | 3.86 | 2.31 |
| Fiscal Year | 2025 | 2025 |
Income Statement Analysis: The Bottom-Line Duel
This income statement comparison reveals which company drives profitability and growth more efficiently in a competitive financial sector.
Truist Financial Corporation Analysis
Truist’s revenue climbed 25.5% from 2024 to 2025, reaching $30.4B, while net income rose to $5.3B. Gross margin remains strong at 62.2%, supporting solid profitability despite a high interest expense ratio of 33.2%. The EBIT margin surged 11-fold year-over-year, showing remarkable operational momentum in 2025.
Regions Financial Corporation Analysis
Regions posted modest revenue growth of 2.5% to $9.6B in 2025, with net income improving 11% to $2.2B. The company enjoys a higher gross margin than Truist at 74.6% and an EBIT margin of 28.6%, reflecting efficient cost control. Regions’ net margin rose to 22.4%, highlighting steady profit expansion amid slower top-line growth.
Margin Efficiency vs. Growth Acceleration
Truist excels in revenue and EBIT growth, signaling strong operational leverage but faces pressure from high interest expenses. Regions delivers superior margin percentages and consistent net income improvement, emphasizing efficiency. For investors, Truist offers dynamic growth potential, while Regions presents a more stable margin-driven profile.
Financial Ratios Comparison
These vital ratios act as a diagnostic tool to expose the underlying fiscal health, valuation premiums, and capital efficiency of the companies analyzed:
| Ratios | Truist Financial Corporation (TFC) | Regions Financial Corporation (RF) |
|---|---|---|
| ROE | 8.14% | 11.32% |
| ROIC | 3.61% | 13.79% |
| P/E | 11.75 | 10.99 |
| P/B | 0.96 | 1.25 |
| Current Ratio | 0.87 | 0.30 |
| Quick Ratio | 0.87 | 0.30 |
| D/E (Debt/Equity) | 1.07 | 0.26 |
| Debt-to-Assets | 12.75% | 3.06% |
| Interest Coverage | 0.63 | 1.32 |
| Asset Turnover | 0.056 | 0.060 |
| Fixed Asset Turnover | 9.60 | 5.79 |
| Payout Ratio | 49.67% | 41.80% |
| Dividend Yield | 4.23% | 3.80% |
| Fiscal Year | 2025 | 2025 |
Efficiency & Valuation Duel: The Vital Signs
Ratios act as a company’s DNA, revealing hidden risks and operational excellence critical for informed investment decisions.
Truist Financial Corporation
Truist posts a moderate ROE of 8.14% and strong net margin at 17.44%, signaling decent profitability but below ideal. Its P/E of 11.75 and P/B near 1 indicate a fairly valued stock, not stretched. A 4.23% dividend yield rewards shareholders, balancing reinvestment with steady income despite some liquidity concerns.
Regions Financial Corporation
Regions excels with an 11.32% ROE and a higher net margin of 22.44%, highlighting operational efficiency. Valuation metrics show a slightly cheaper P/E of 11.0 but a higher P/B at 1.25, reflecting market confidence. Regions pays a 3.8% dividend and maintains solid capital returns, with lower leverage and better asset turnover than peers.
Balanced Profitability vs. Valuation Discipline
Regions offers superior profitability and operational metrics, supported by favorable valuations and lower leverage. Truist provides a safer dividend yield but lags on returns and liquidity. Investors seeking growth with yield may prefer Regions, while those favoring income stability might lean toward Truist.
Which one offers the Superior Shareholder Reward?
I see Truist Financial Corporation (TFC) and Regions Financial Corporation (RF) both pay dividends and buy back shares but with different intensity. TFC yields 4.2% with a payout ratio near 50%, reflecting solid free cash flow coverage and a balanced distribution approach. RF offers a slightly lower dividend yield around 3.8%, but its payout ratio sits closer to 42%, implying more retained earnings for growth. TFC maintains a stronger buyback cadence, enhancing total shareholder returns. RF’s lower payout ratio supports stability but may limit immediate income. Considering sustainability and total return, I judge TFC’s distribution model more attractive for 2026 investors seeking income with capital appreciation potential.
Comparative Score Analysis: The Strategic Profile
The radar chart reveals the fundamental DNA and trade-offs of Truist Financial Corporation and Regions Financial Corporation:
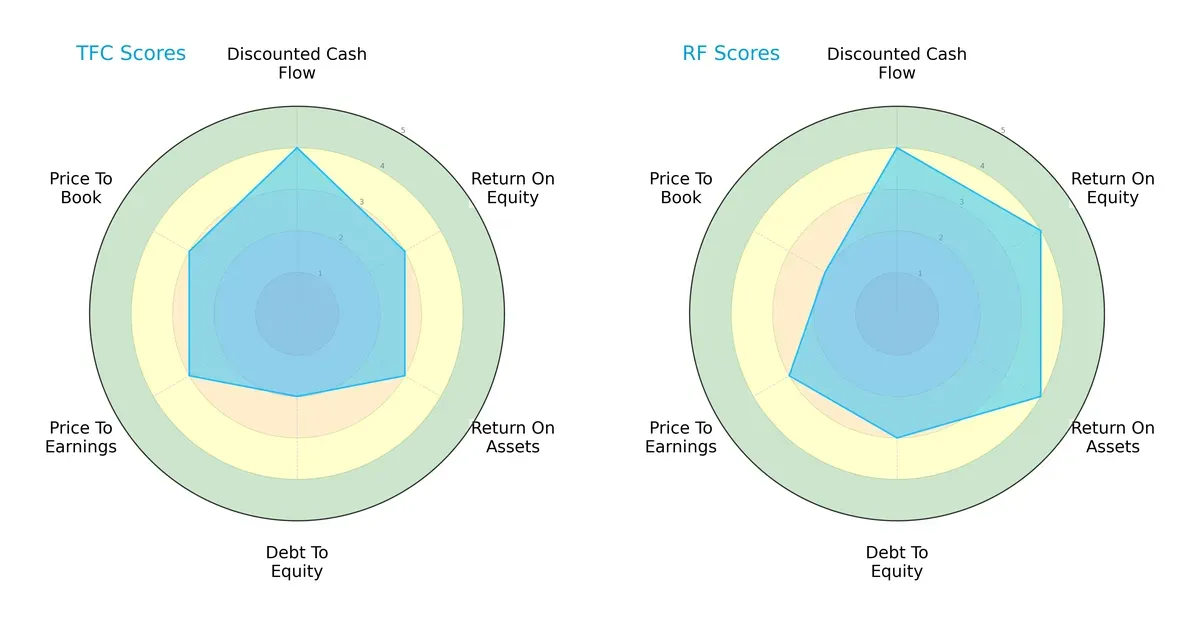
Regions Financial exhibits a more balanced financial profile with favorable scores in ROE (4), ROA (4), and DCF (4). Truist shows moderate efficiency in profitability (ROE 3, ROA 3) but a weaker debt-to-equity score (2), indicating higher leverage risk. Regions leans on stronger operational returns and capital discipline, while Truist depends more on valuation metrics. Regions’ overall score (4) outpaces Truist’s (3), signaling a more robust investment proposition.
Bankruptcy Risk: Solvency Showdown
Regions and Truist both reside in the distress zone by Altman Z-Score, but Truist’s score (0.12) slightly exceeds Regions’ (-0.38), implying marginally better short-term solvency:
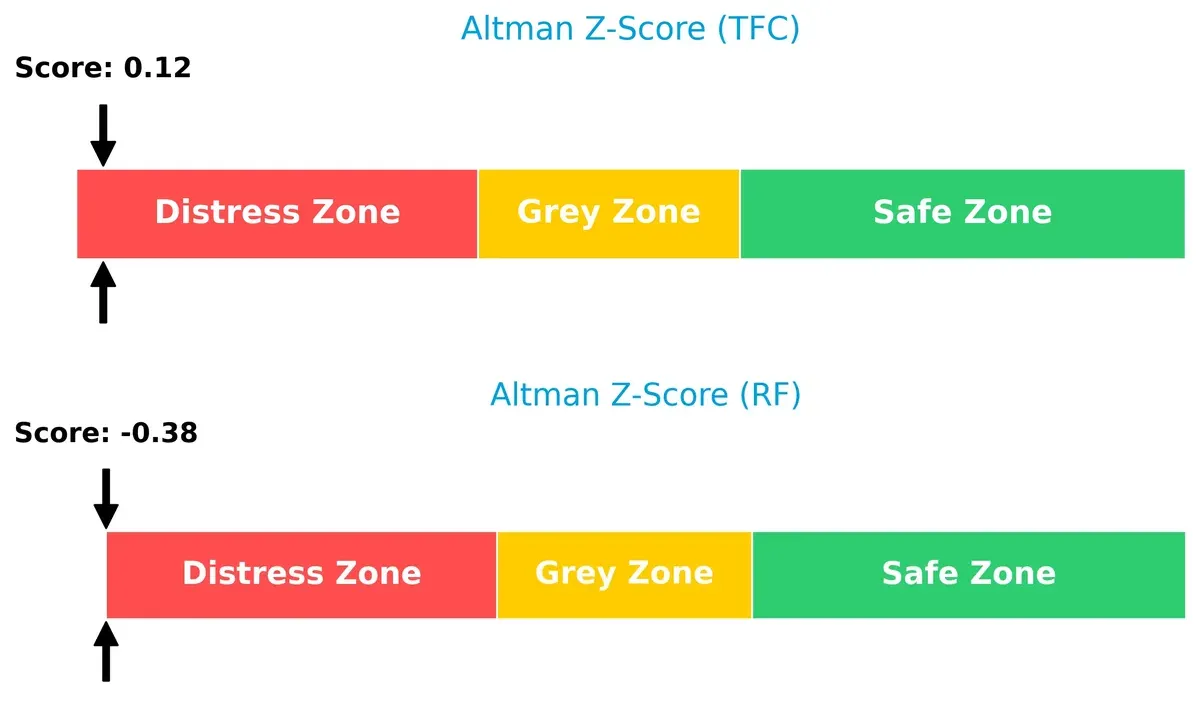
This suggests both firms face elevated bankruptcy risk amid current market pressures, but Truist’s financial structure offers a slightly stronger buffer against insolvency.
Financial Health: Quality of Operations
Regions scores a 9 on the Piotroski scale, indicating very strong financial health. Truist scores 7, reflecting strong but comparatively less robust operations:
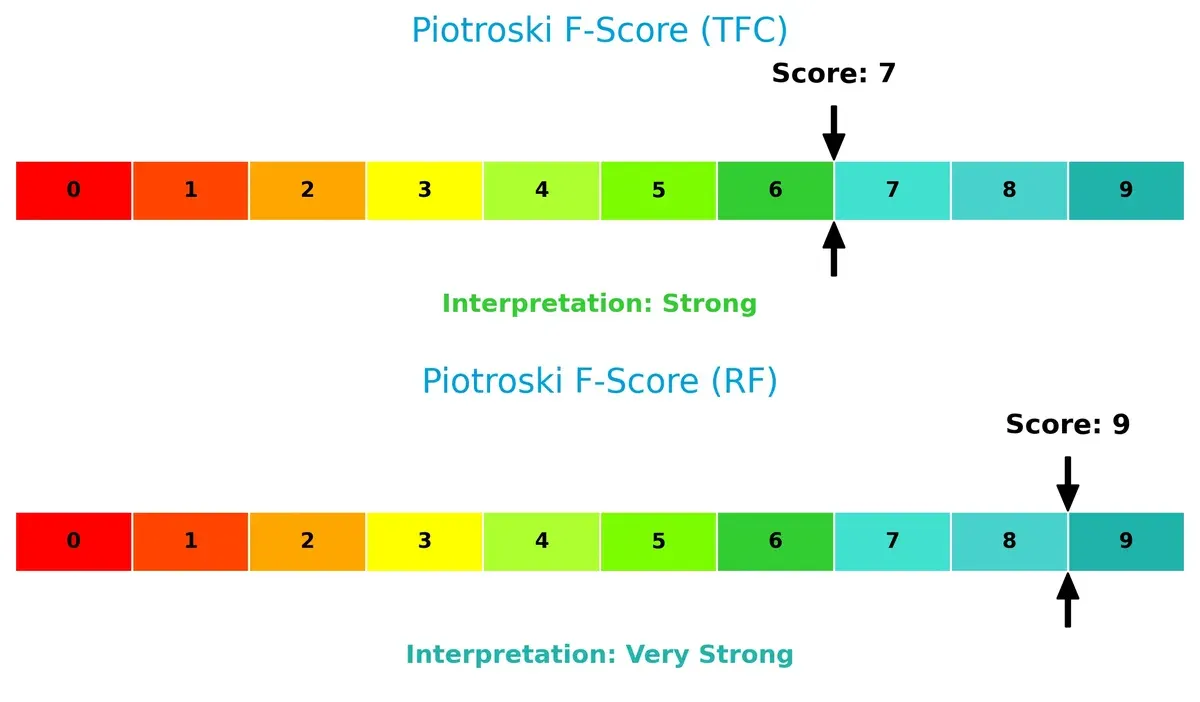
Regions demonstrates superior internal financial discipline and operational quality. Truist, while solid, shows minor red flags in efficiency or liquidity metrics relative to its peer. This gap highlights Regions’ advantage in sustaining long-term value creation.
How are the two companies positioned?
This section dissects the operational DNA of Truist Financial Corporation and Regions Financial Corporation by comparing their revenue distribution by segment and internal dynamics. The goal is to confront their economic moats and identify which business model delivers the most resilient and sustainable competitive advantage today.
Revenue Segmentation: The Strategic Mix
This visual comparison dissects how Truist Financial Corporation and Regions Financial Corporation diversify their income streams and where their primary sector bets lie:
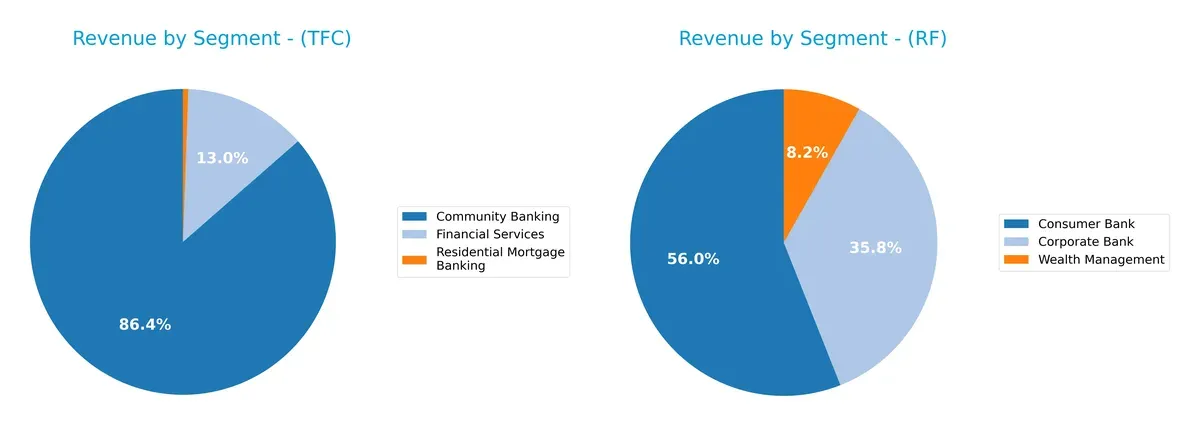
Regions Financial Corporation dwarfs Truist with a $3.13B Consumer Bank and $2B Corporate Bank, showing a balanced revenue base. Truist anchors its income on Community Banking ($153M) but suffers from a large negative “Other, Treasury & Corporate” segment, highlighting concentration risk and operational drag. Regions’ diversified segments suggest ecosystem lock-in and infrastructure dominance, while Truist’s reliance on one core segment exposes it to sector-specific headwinds.
Strengths and Weaknesses Comparison
This table compares the Strengths and Weaknesses of Truist Financial Corporation (TFC) and Regions Financial Corporation (RF):
TFC Strengths
- Favorable net margin of 17.44%
- Low debt-to-assets at 12.75%
- Favorable P/E of 11.75 and P/B below 1
- High fixed asset turnover of 9.6
- Dividend yield at 4.23%
RF Strengths
- Higher net margin at 22.44%
- Strong ROIC of 13.79% above WACC
- Favorable P/E of 11.0 and P/B at 1.25
- Low debt-to-equity of 0.26
- Solid fixed asset turnover of 5.79
- Dividend yield at 3.8%
TFC Weaknesses
- Unfavorable ROE at 8.14% below cost of capital
- Current ratio at 0.87 below 1
- Debt-to-equity ratio above 1 at 1.07
- Low interest coverage of 0.63
- Low asset turnover at 0.06
- Limited product diversification with no dealer or insurance services
RF Weaknesses
- Current and quick ratios very low at 0.3
- Interest coverage weak at 1.32
- WACC high at 12.53%
- Low asset turnover at 0.06
- Less diversified segments despite strong banking and wealth management
Overall, RF shows stronger profitability and capital efficiency metrics than TFC, but faces liquidity risks with very low current ratios. TFC maintains a better leverage profile but struggles with returns and asset utilization. Both companies have areas needing strategic focus on operational efficiency and balance sheet management.
The Moat Duel: Analyzing Competitive Defensibility
A structural moat stands as the sole barrier protecting long-term profits from relentless competitive erosion:
Truist Financial Corporation: Cost Structure and Scale Advantage
Truist’s primary moat stems from cost advantage built on scale and diversified banking services. Its financials show margin stability but a declining ROIC signals weakening efficiency. New product launches and market expansions in 2026 must reverse this trend to defend profits.
Regions Financial Corporation: Emerging Efficiency and Growth Potential
Regions leverages operational efficiency and growing ROIC as its moat, contrasting Truist’s erosion. Despite a smaller scale, Regions improves profitability and margins. Its growing ROIC trend suggests expanding competitive strength and opportunities to disrupt regional banking in 2026.
Scale Economy vs. Efficiency Growth: Who Defends Profit Better?
Truist commands scale but suffers shrinking returns, while Regions gains momentum through rising efficiency. Regions holds the deeper moat with improving profitability trends. It appears better equipped to sustain market share against increasing competition.
Which stock offers better returns?
Truist Financial Corporation and Regions Financial Corporation both exhibit strong price gains over the past year, with distinct trading volume dynamics and accelerating bullish trends.
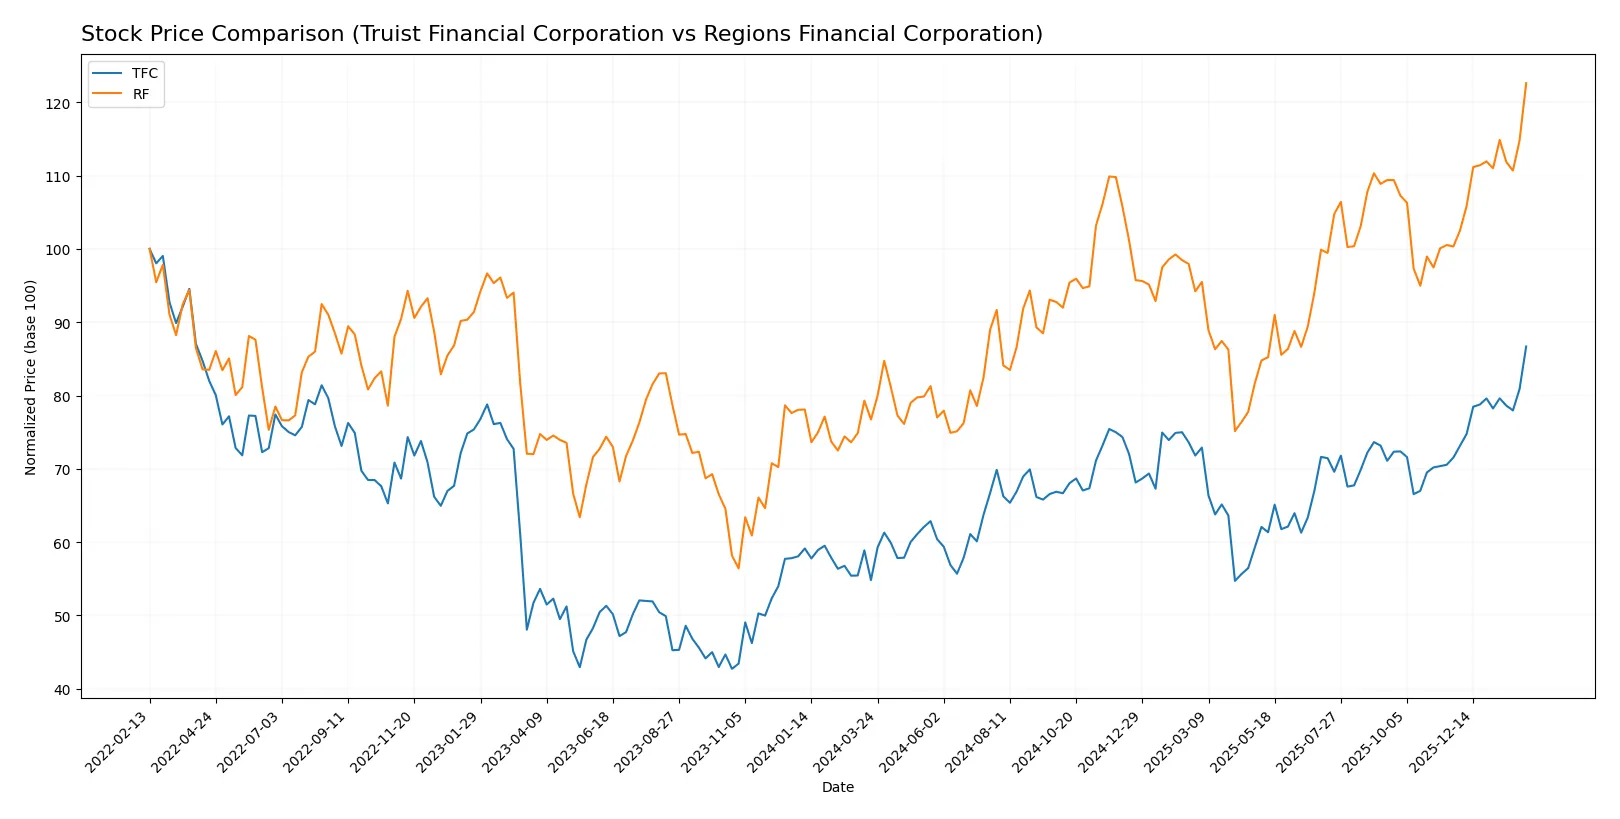
Trend Comparison
Truist Financial Corporation’s stock rose 58.09% over the past year, showing an accelerating bullish trend with a high of 55.11 and a low of 34.79. Its recent three-month gain is 21.17%.
Regions Financial Corporation’s stock increased 59.79% over the past year, also accelerating bullish with a high of 30.44 and a low of 18.6. The recent three-month gain is 22.2%.
Both stocks delivered strong returns, with Regions Financial slightly outperforming Truist Financial in total price appreciation over the year.
Target Prices
Analysts provide a solid consensus on target prices for Truist Financial Corporation and Regions Financial Corporation.
| Company | Target Low | Target High | Consensus |
|---|---|---|---|
| Truist Financial Corporation | 50 | 58 | 54.38 |
| Regions Financial Corporation | 27 | 32 | 29.9 |
The target consensus for Truist Financial suggests modest upside from the current price of 55.11, reflecting steady confidence. Regions Financial’s targets align tightly around the current 30.44 price, indicating balanced expectations.

Don’t Let Luck Decide Your Entry Point
Optimize your entry points with our advanced ProRealTime indicators. You’ll get efficient buy signals with precise price targets for maximum performance. Start outperforming now!
How do institutions grade them?
Truist Financial Corporation Grades
Here are the recent institutional grades for Truist Financial Corporation:
| Grading Company | Action | New Grade | Date |
|---|---|---|---|
| Argus Research | Maintain | Buy | 2026-01-23 |
| Piper Sandler | Maintain | Neutral | 2026-01-22 |
| TD Cowen | Maintain | Buy | 2026-01-22 |
| Raymond James | Maintain | Outperform | 2026-01-07 |
| TD Cowen | Maintain | Buy | 2026-01-07 |
| Evercore ISI Group | Upgrade | Outperform | 2026-01-06 |
| Barclays | Downgrade | Underweight | 2026-01-05 |
| Citigroup | Maintain | Buy | 2025-12-31 |
| Keefe, Bruyette & Woods | Maintain | Market Perform | 2025-12-17 |
| Morgan Stanley | Maintain | Equal Weight | 2025-12-17 |
Regions Financial Corporation Grades
Here are the recent institutional grades for Regions Financial Corporation:
| Grading Company | Action | New Grade | Date |
|---|---|---|---|
| Piper Sandler | Maintain | Neutral | 2026-01-20 |
| Wells Fargo | Maintain | Underweight | 2026-01-20 |
| Keefe, Bruyette & Woods | Downgrade | Market Perform | 2026-01-20 |
| Wells Fargo | Downgrade | Underweight | 2026-01-16 |
| Evercore ISI Group | Downgrade | Underperform | 2026-01-06 |
| Barclays | Maintain | Underweight | 2026-01-05 |
| Truist Securities | Maintain | Hold | 2025-12-22 |
| Keefe, Bruyette & Woods | Maintain | Outperform | 2025-12-17 |
| Truist Securities | Maintain | Hold | 2025-10-20 |
| Stephens & Co. | Downgrade | Equal Weight | 2025-10-14 |
Which company has the best grades?
Truist Financial holds generally stronger grades, including multiple Buy and Outperform ratings. Regions Financial shows more downgrades and Underweight opinions. This difference may affect investor confidence and valuation outlooks.
Risks specific to each company
The following categories identify critical pressure points and systemic threats facing Truist Financial Corporation and Regions Financial Corporation in the 2026 market environment:
1. Market & Competition
Truist Financial Corporation
- Faces intense regional bank rivalry; larger market cap offers scale advantage.
Regions Financial Corporation
- Smaller market cap but stronger profitability metrics suggest competitive resilience.
2. Capital Structure & Debt
Truist Financial Corporation
- Higher debt-to-equity ratio (1.07) signals elevated financial leverage risk.
Regions Financial Corporation
- Lower debt-to-equity (0.26) reflects more conservative capital structure.
3. Stock Volatility
Truist Financial Corporation
- Beta 0.855 indicates below-market volatility, potentially less risky.
Regions Financial Corporation
- Beta 1.027 suggests volatility near market average, implying moderate risk.
4. Regulatory & Legal
Truist Financial Corporation
- Large footprint in Southeastern US exposes to regional regulatory shifts.
Regions Financial Corporation
- Operations across South, Midwest, and Texas increase regulatory complexity.
5. Supply Chain & Operations
Truist Financial Corporation
- Extensive branch network (2,517 offices) demands high operational efficiency.
Regions Financial Corporation
- Smaller network (1,300 offices) may allow more agile operational management.
6. ESG & Climate Transition
Truist Financial Corporation
- No explicit ESG data; banking sector under scrutiny for climate risks.
Regions Financial Corporation
- Similar sector risks; footprint in diverse regions raises transition challenges.
7. Geopolitical Exposure
Truist Financial Corporation
- US-focused with concentration in the Southeast; less global geopolitical risk.
Regions Financial Corporation
- Also US-based but broader regional spread may affect localized geopolitical risks.
Which company shows a better risk-adjusted profile?
Regions Financial Corporation’s lower leverage and superior profitability metrics denote a stronger risk-adjusted profile. Truist’s higher debt and weaker coverage ratios raise caution, despite its scale. Regions’ very strong Piotroski score (9 vs. Truist’s 7) confirms healthier fundamentals. The sharp contrast in debt-to-equity ratios (0.26 vs. 1.07) is my top concern, spotlighting Truist’s elevated financial risk in 2026.
Final Verdict: Which stock to choose?
Truist Financial Corporation (TFC) shines with its unmatched operational efficiency and attractive dividend yield, making it a robust cash generator. However, its declining return on invested capital and weak liquidity remain points of vigilance. TFC suits investors seeking aggressive growth but willing to tolerate moderate financial risks.
Regions Financial Corporation (RF) boasts a strategic moat with steadily improving profitability and a strong return on invested capital that outpaces its cost of capital. Its conservative leverage profile offers better financial stability than TFC. RF fits well within a GARP (Growth at a Reasonable Price) portfolio focused on balanced growth and risk control.
If you prioritize aggressive growth and dividend income, Truist (TFC) is the compelling choice due to its operational strength and yield. However, if you seek a more stable investment with improving profitability and a stronger economic moat, Regions (RF) offers better stability and a cleaner balance sheet, albeit at a modest premium.
Disclaimer: Investment carries a risk of loss of initial capital. The past performance is not a reliable indicator of future results. Be sure to understand risks before making an investment decision.
Go Further
I encourage you to read the complete analyses of Truist Financial Corporation and Regions Financial Corporation to enhance your investment decisions: