Home > Comparison > Financial Services > PNC vs RF
The strategic rivalry between The PNC Financial Services Group, Inc. and Regions Financial Corporation shapes the competitive landscape of regional banking. PNC operates as a diversified financial services powerhouse with a broad national footprint, while Regions focuses on a regional banking model emphasizing Southern and Midwestern markets. This head-to-head pits scale and diversification against regional specialization. This analysis will identify which business model offers superior risk-adjusted returns for a diversified portfolio.

Table of contents
Companies Overview
The PNC Financial Services Group and Regions Financial Corporation anchor key regional banking markets with distinct scale and strategies.
The PNC Financial Services Group, Inc.: Diversified Regional Bank Powerhouse
PNC dominates as a diversified financial services company with strong retail and corporate banking arms. Its core revenue derives from consumer loans, mortgages, wealth management, and commercial banking services. In 2026, PNC emphasizes expanding digital capabilities and integrated financial solutions to deepen client relationships across its 2,591 branches and 9,502 ATMs.
Regions Financial Corporation: Focused Regional Banking and Wealth Management
Regions stands as a regional financial holding company concentrating on commercial and consumer banking alongside wealth management. It generates revenue through loans, deposits, securities underwriting, and advisory services. Regions focuses on strengthening its presence in the South, Midwest, and Texas while enhancing customer experience via technology and tailored financial products.
Strategic Collision: Similarities & Divergences
Both banks compete in the regional banking sector but differ in scale and diversification. PNC’s broad footprint and product range contrast with Regions’ concentrated geographic focus and leaner branch network. The battleground centers on commercial lending and wealth management innovation. PNC appeals as a diversified financial giant, while Regions offers a more focused, regional growth profile.
Income Statement Comparison
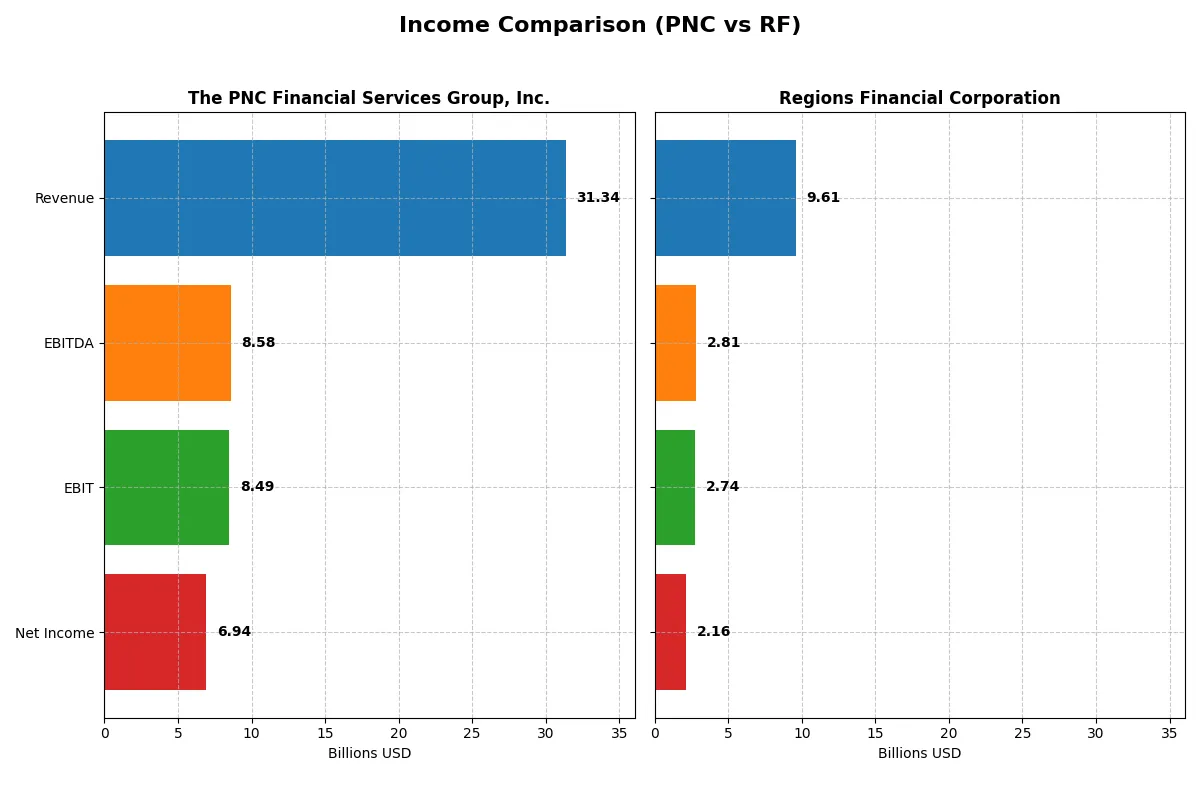
This data dissects the core profitability and scalability of both corporate engines to reveal who dominates the bottom line:
| Metric | The PNC Financial Services Group, Inc. (PNC) | Regions Financial Corporation (RF) |
|---|---|---|
| Revenue | 31.3B | 9.6B |
| Cost of Revenue | 8.9B | 2.4B |
| Operating Expenses | 13.97B | 4.43B |
| Gross Profit | 22.5B | 7.2B |
| EBITDA | 8.58B | 2.81B |
| EBIT | 8.49B | 2.74B |
| Interest Expense | 10.9B | 2.08B |
| Net Income | 6.94B | 2.16B |
| EPS | 16.62 | 2.31 |
| Fiscal Year | 2025 | 2025 |
Income Statement Analysis: The Bottom-Line Duel
This income statement comparison reveals the true operational efficiency and profitability momentum of two major financial institutions.
The PNC Financial Services Group, Inc. Analysis
PNC grew revenue 59% over five years but saw a 7% dip from 2024 to 2025. Net income expanded by 22% overall and surged 26.6% in the last year. Its gross margin remains robust at 71.7%, with a net margin of 22.1%, highlighting strong cost control despite a high interest expense ratio of 34.8%. The 2025 results show improving EBIT and EPS growth, signaling efficient capital deployment.
Regions Financial Corporation Analysis
Regions posted a 45.5% revenue increase over five years and a modest 2.5% rise from 2024 to 2025. However, net income declined 14.5% overall, though it rose 11.1% in the last year. Gross margin stands healthy at 74.6%, with a net margin slightly higher than PNC’s at 22.4%. Interest expense is lower at 21.7%, aiding profitability. The latest year showed solid EBIT and EPS growth, but overall earnings trends raise caution.
Margin Strength vs. Earnings Momentum
PNC leads with stronger net income growth and margin expansion over the period, despite a recent revenue contraction. Regions boasts a slightly better gross margin and lower interest burden but struggles with overall earnings decline. For investors prioritizing consistent profit momentum and margin improvement, PNC’s profile offers clearer fundamental strength and efficiency.
Financial Ratios Comparison
These vital ratios act as a diagnostic tool to expose the underlying fiscal health, valuation premiums, and capital efficiency of the companies compared:
| Ratios | The PNC Financial Services Group, Inc. (PNC) | Regions Financial Corporation (RF) |
|---|---|---|
| ROE | 11.4% | 11.3% |
| ROIC | 7.6% | 13.8% |
| P/E | 11.9 | 11.0 |
| P/B | 1.36 | 1.25 |
| Current Ratio | 0.81 | 0.30 |
| Quick Ratio | 0.81 | 0.30 |
| D/E | 0.94 | 0.26 |
| Debt-to-Assets | 10.0% | 3.1% |
| Interest Coverage | 0.78 | 1.32 |
| Asset Turnover | 0.055 | 0.060 |
| Fixed Asset Turnover | 0 | 5.79 |
| Payout ratio | 37.5% | 41.8% |
| Dividend yield | 3.16% | 3.80% |
| Fiscal Year | 2025 | 2025 |
Efficiency & Valuation Duel: The Vital Signs
Financial ratios act as the company’s DNA, revealing hidden risks and operational excellence critical for investment decisions.
The PNC Financial Services Group, Inc.
PNC shows solid profitability with an 11.45% ROE and a favorable 22.13% net margin. Its valuation feels reasonable, with a P/E of 11.86 and P/B of 1.36. The 3.16% dividend yield rewards shareholders, balancing moderate operational risks like a weak current ratio of 0.81.
Regions Financial Corporation
Regions delivers a comparable 11.32% ROE and a strong 22.44% net margin, outperforming on ROIC at 13.79%. It trades slightly cheaper, with a P/E of 11.0 and P/B of 1.25. Its 3.8% dividend yield combined with a lower debt-to-equity ratio highlights disciplined capital allocation despite a low current ratio of 0.3.
Valuation Discipline Meets Operational Resilience
Regions Financial edges out PNC by offering a better ROIC and more favorable capital structure. PNC balances higher dividends with moderate operational risks. Investors prioritizing capital efficiency may prefer Regions, while those valuing steady income might lean toward PNC’s profile.
Which one offers the Superior Shareholder Reward?
I see that PNC and Regions Financial (RF) both pay dividends and engage in buybacks, but their approaches differ. PNC yields about 3.16% with a 37% payout ratio in 2025, signaling moderate dividend sustainability. RF offers a higher yield near 3.8% but with a 42% payout ratio, also sustainable but with less leverage. I note PNC’s buybacks are more aggressive historically, boosting total shareholder returns effectively. RF’s conservative debt-to-equity ratio (~0.26) supports stability, while PNC’s higher leverage (~0.94) risks pressure if rates rise. PNC’s blend of dividends and hefty buybacks provides a more attractive total return for 2026 investors, balancing income and capital appreciation better than RF.
Comparative Score Analysis: The Strategic Profile
The radar chart reveals the fundamental DNA and trade-offs of The PNC Financial Services Group, Inc. and Regions Financial Corporation:
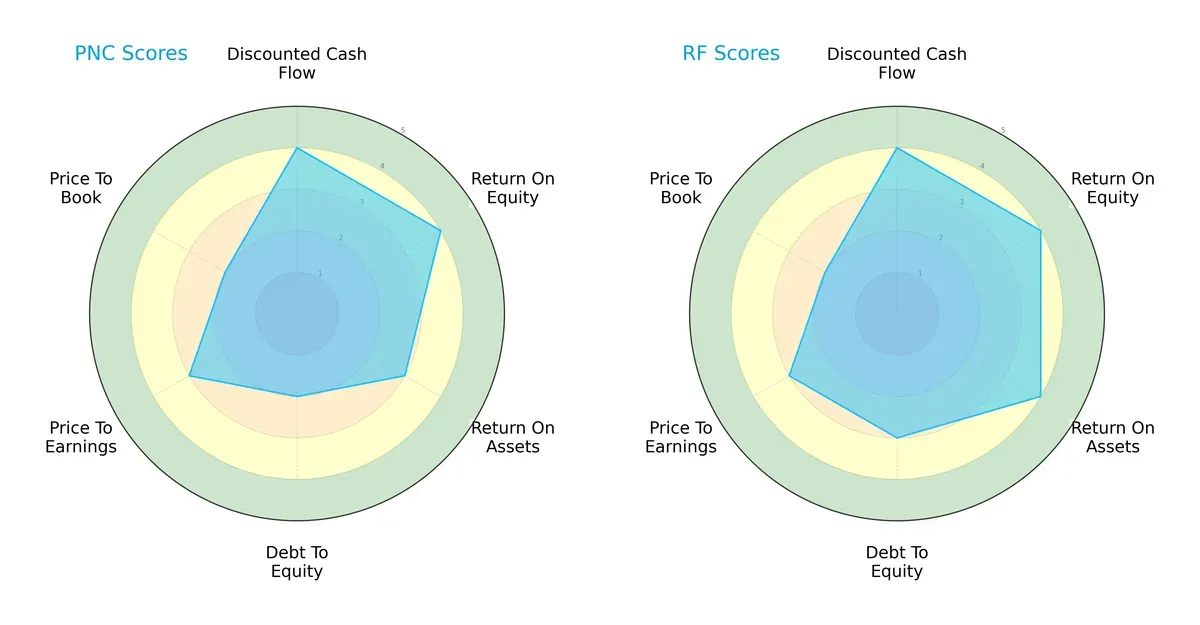
Regions Financial Corporation delivers a notably balanced profile with strong ROE and ROA scores at 4, indicating efficient profit generation and asset utilization. The PNC Financial Services Group shows strength in ROE but lags in debt-to-equity at 2, signaling higher leverage risk. Both firms share similar DCF and valuation scores, but Regions edges ahead with a more solid asset return and moderate leverage, making it the more resilient choice.
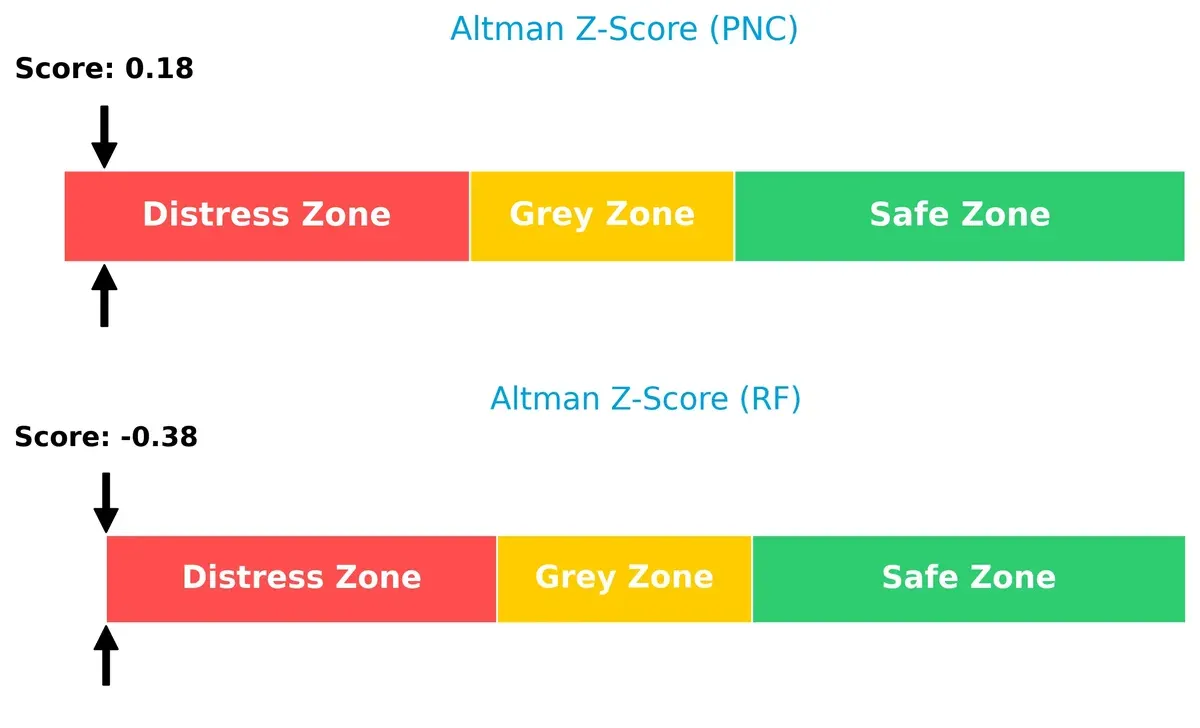
Bankruptcy Risk: Solvency Showdown
The Altman Z-Scores place both firms in the distress zone, indicating elevated bankruptcy risk amid current market pressures:
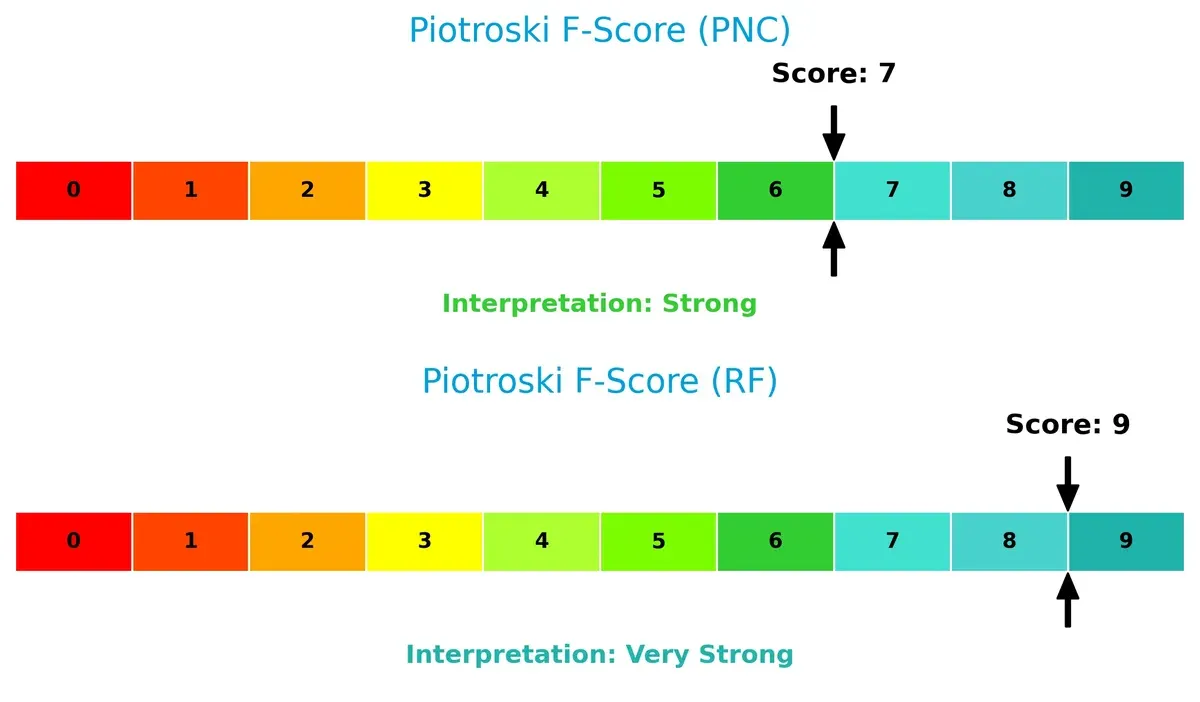
Financial Health: Quality of Operations
Regions Financial Corporation scores a very strong 9 on the Piotroski F-Score, signaling robust financial health and operational quality. The PNC Financial Services Group holds a strong 7, but this gap suggests PNC faces more internal financial challenges relative to Regions:
How are the two companies positioned?
This section dissects the operational DNA of PNC and RF by comparing their revenue distribution and internal dynamics. The goal is to confront their economic moats and identify which model offers the most resilient competitive edge today.
Revenue Segmentation: The Strategic Mix
The following visual comparison dissects how PNC and Regions Financial diversify their income streams and where their primary sector bets lie:
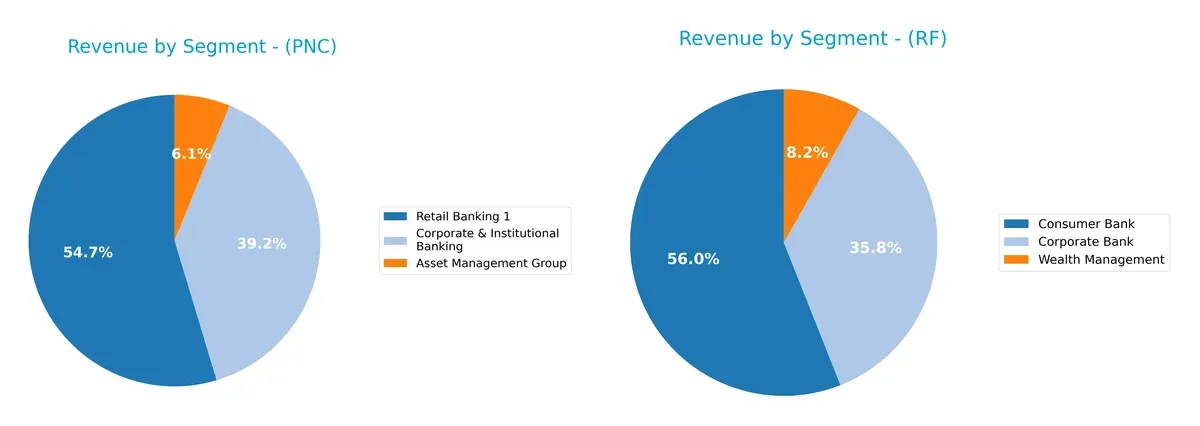
PNC anchors its revenue in Retail Banking at $12.9B, dwarfing its Corporate & Institutional Banking at $9.3B and Asset Management at $1.5B. This signals a strong consumer banking ecosystem with less dependency on a single segment. Conversely, Regions Financial leans heavily on Consumer Bank at $3.1B, with Corporate Bank and Wealth Management trailing at $2.0B and $457M. Regions shows higher concentration risk, while PNC’s broader base offers more strategic resilience.
Strengths and Weaknesses Comparison
This table compares the Strengths and Weaknesses of PNC and RF:
PNC Strengths
- Diversified revenue streams across retail, corporate, and asset management
- Favorable net margin at 22.13%
- Favorable PE at 11.86 and PB at 1.36
- Low debt-to-assets ratio at 9.96%
- Dividend yield of 3.16% supports income investors
RF Strengths
- Favorable net margin at 22.44%
- Higher ROIC at 13.79% vs WACC indicates strong capital allocation
- Favorable PE at 11.0 and PB at 1.25
- Lower debt-to-assets at 3.06% and debt-to-equity at 0.26
- Strong fixed asset turnover at 5.79
- Dividend yield at 3.8%
PNC Weaknesses
- Current ratio at 0.81 signals tight liquidity
- Interest coverage below 1 (0.78) is concerning
- Asset and fixed asset turnover unfavorable, indicating lower efficiency
- WACC exceeds ROIC (11.11% vs 7.65%)
- Neutral ROE at 11.45%
RF Weaknesses
- Very low liquidity with current and quick ratios at 0.3
- Interest coverage low at 1.32, indicating weaker ability to service debt
- WACC at 12.52% exceeds ROIC (neutral to unfavorable)
- Asset turnover unfavorable at 0.06
- Neutral ROE at 11.32%
Both companies show solid profitability and capital structure discipline but face liquidity constraints and efficiency challenges. RF’s stronger capital returns contrast with PNC’s broader diversification. Each must address liquidity and asset utilization to improve resilience and growth prospects.
The Moat Duel: Analyzing Competitive Defensibility
A structural moat is the sole guardian of long-term profits against relentless competition erosion. Here’s how these two regional banks stack up:
The PNC Financial Services Group, Inc.: Relationship-Driven Switching Costs
PNC’s primary moat rests on deep customer relationships and diversified financial services, creating high switching costs. This manifests in stable margins despite flat revenue growth. New digital offerings in 2026 could deepen client retention but rising interest expenses pose risks.
Regions Financial Corporation: Efficiency-Driven Cost Advantage
Regions leverages operational efficiency and focused regional presence as its moat, contrasting PNC’s broader service approach. Its improving ROIC trend signals stronger capital use. Expansion in commercial banking markets could accelerate growth, but margin pressures remain a concern.
Moat Dynamics: Switching Costs vs. Cost Advantage
PNC’s switching cost moat appears deeper but is challenged by rising expenses. Regions shows a narrower moat but improving profitability and capital efficiency. I see PNC better positioned to defend market share if expense control improves.
Which stock offers better returns?
The past year reveals robust gains for both stocks, with notable acceleration and distinct volatility profiles shaping their trading dynamics.
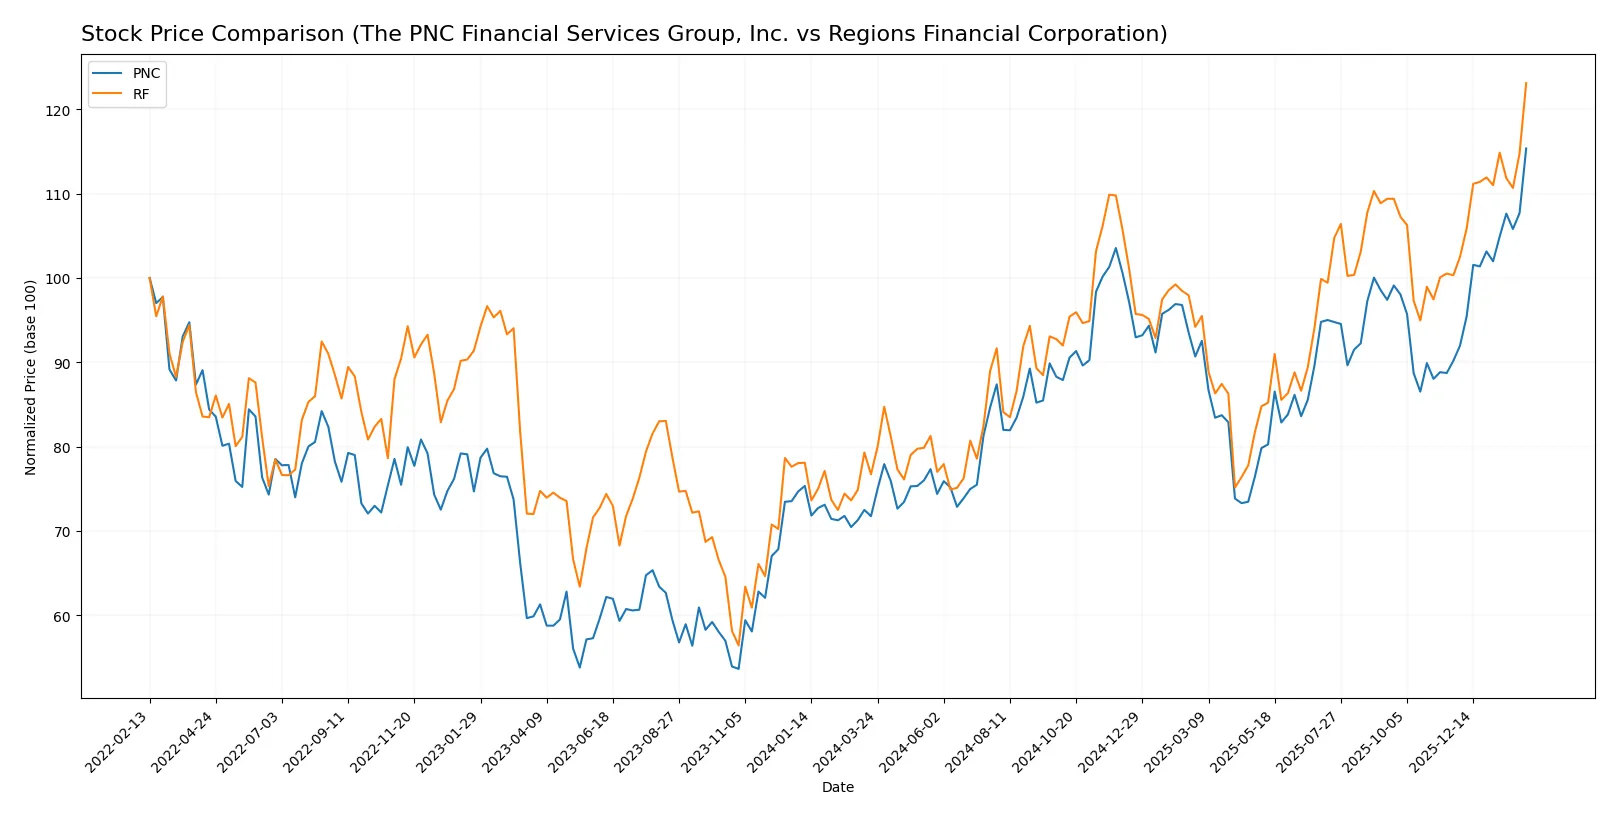
Trend Comparison
The PNC Financial Services Group, Inc. stock rose 60.77% over the past 12 months, showing a bullish trend with accelerating momentum and high volatility (20.14 std deviation). Its price ranged from 148.78 to a peak of 239.2.
Regions Financial Corporation gained 60.45% over the same period, also bullish with accelerating momentum but significantly lower volatility (2.85 std deviation). Its price moved between 18.6 and 30.57.
PNC and RF both delivered strong market performance, with PNC slightly outperforming RF in total percentage gain and exhibiting greater price fluctuation and acceleration.
Target Prices
Analysts present a moderately bullish consensus for both The PNC Financial Services Group, Inc. and Regions Financial Corporation.
| Company | Target Low | Target High | Consensus |
|---|---|---|---|
| The PNC Financial Services Group, Inc. | 206 | 284 | 242.5 |
| Regions Financial Corporation | 27 | 32 | 29.9 |
The consensus target for PNC stands slightly above its current price of $238.60, indicating cautious upside potential. Regions Financial’s target aligns closely with its current price of $30.55, signaling limited near-term growth expectations.

Don’t Let Luck Decide Your Entry Point
Optimize your entry points with our advanced ProRealTime indicators. You’ll get efficient buy signals with precise price targets for maximum performance. Start outperforming now!
How do institutions grade them?
Here is a summary of the latest institutional grades for The PNC Financial Services Group, Inc. and Regions Financial Corporation:
The PNC Financial Services Group, Inc. Grades
This table shows the recent grades assigned by various reputable institutions:
| Grading Company | Action | New Grade | Date |
|---|---|---|---|
| RBC Capital | maintain | Outperform | 2026-01-20 |
| TD Cowen | maintain | Buy | 2026-01-20 |
| Wells Fargo | maintain | Overweight | 2026-01-20 |
| Morgan Stanley | maintain | Underweight | 2026-01-20 |
| Keefe, Bruyette & Woods | maintain | Market Perform | 2026-01-20 |
| Oppenheimer | maintain | Outperform | 2026-01-20 |
| TD Cowen | maintain | Buy | 2026-01-07 |
| Barclays | maintain | Overweight | 2026-01-05 |
| Truist Securities | maintain | Hold | 2025-12-18 |
| Keefe, Bruyette & Woods | maintain | Market Perform | 2025-12-17 |
Regions Financial Corporation Grades
This table details recent grades from verified grading institutions:
| Grading Company | Action | New Grade | Date |
|---|---|---|---|
| Piper Sandler | maintain | Neutral | 2026-01-20 |
| Wells Fargo | maintain | Underweight | 2026-01-20 |
| Keefe, Bruyette & Woods | downgrade | Market Perform | 2026-01-20 |
| Wells Fargo | downgrade | Underweight | 2026-01-16 |
| Evercore ISI Group | downgrade | Underperform | 2026-01-06 |
| Barclays | maintain | Underweight | 2026-01-05 |
| Truist Securities | maintain | Hold | 2025-12-22 |
| Keefe, Bruyette & Woods | maintain | Outperform | 2025-12-17 |
| Truist Securities | maintain | Hold | 2025-10-20 |
| Stephens & Co. | downgrade | Equal Weight | 2025-10-14 |
Which company has the best grades?
The PNC Financial Services Group, Inc. generally holds stronger grades, including multiple Outperform and Buy ratings. Regions Financial Corporation shows more downgrades and Underweight ratings. This disparity may influence investor perception of relative strength and risk.
Risks specific to each company
The following categories identify the critical pressure points and systemic threats facing both firms in the 2026 market environment:
1. Market & Competition
The PNC Financial Services Group, Inc.
- Larger market cap (93B) supports competitive scale but faces intense regional bank rivalry.
Regions Financial Corporation
- Smaller market cap (27B) limits scale but benefits from focused regional presence and niche markets.
2. Capital Structure & Debt
The PNC Financial Services Group, Inc.
- Debt-to-assets favorable at 9.96% but interest coverage weak at 0.78, raising refinancing risks.
Regions Financial Corporation
- Strong debt metrics with 3.06% debt-to-assets and better interest coverage at 1.32, indicating prudent leverage.
3. Stock Volatility
The PNC Financial Services Group, Inc.
- Beta of 0.968 suggests moderate volatility, slightly below market average.
Regions Financial Corporation
- Beta of 1.027 implies volatility close to the market, higher risk for traders.
4. Regulatory & Legal
The PNC Financial Services Group, Inc.
- Larger, more diversified operations face broader regulatory scrutiny, increasing compliance costs.
Regions Financial Corporation
- Regional focus limits regulatory complexity but exposes it to localized legal risks.
5. Supply Chain & Operations
The PNC Financial Services Group, Inc.
- Extensive branch and ATM network (2,591 branches, 9,502 ATMs) implies operational complexity and higher fixed costs.
Regions Financial Corporation
- Smaller network (1,300 offices, 2,000 ATMs) lowers operational burden but limits growth scalability.
6. ESG & Climate Transition
The PNC Financial Services Group, Inc.
- ESG risks moderate due to diversified portfolio but must manage climate-related loan exposures.
Regions Financial Corporation
- ESG initiatives less visible, potentially lagging peers on climate transition strategies.
7. Geopolitical Exposure
The PNC Financial Services Group, Inc.
- Primarily domestic US exposure mitigates international geopolitical risks.
Regions Financial Corporation
- Similarly focused on US markets, limiting overseas geopolitical vulnerabilities.
Which company shows a better risk-adjusted profile?
Regions Financial faces less leverage risk and boasts stronger operational efficiency, shown by a higher fixed asset turnover (5.79) and better debt metrics. However, Regions carries slightly higher stock volatility. PNC’s larger scale introduces regulatory and operational complexity, with weaker interest coverage signaling financial pressure. Both are in financial distress per Altman Z-Scores, but Regions’ very strong Piotroski Score reflects superior financial health. Recent data points to PNC’s interest coverage below 1 as a red flag, while Regions’ lower debt-to-assets ratio supports a more resilient risk profile. Overall, Regions demonstrates a better risk-adjusted position in 2026.
Final Verdict: Which stock to choose?
The case for The PNC Financial Services Group, Inc. hinges on its ability to generate solid earnings growth with efficient capital use, despite currently destroying value relative to its cost of capital. Its main point of vigilance is a weak liquidity profile, which could pressure short-term resilience. PNC suits portfolios targeting aggressive growth with a tolerance for operational risks.
Regions Financial Corporation’s strategic moat lies in its superior capital efficiency and stronger balance sheet metrics, offering a more robust safety net than PNC. Its consistent profitability growth and lower leverage make it a fit for investors favoring GARP (Growth at a Reasonable Price) strategies seeking steadier returns with moderate risk.
If you prioritize aggressive expansion and are comfortable navigating liquidity challenges, PNC outshines with its earnings momentum. However, if you seek better stability and capital efficiency, Regions offers a more balanced profile with a stronger financial foundation, commanding a premium for safety-conscious investors.
Disclaimer: Investment carries a risk of loss of initial capital. The past performance is not a reliable indicator of future results. Be sure to understand risks before making an investment decision.
Go Further
I encourage you to read the complete analyses of The PNC Financial Services Group, Inc. and Regions Financial Corporation to enhance your investment decisions: