Home > Comparison > Healthcare > VRTX vs REGN
The strategic rivalry between Vertex Pharmaceuticals Incorporated and Regeneron Pharmaceuticals, Inc. defines the current trajectory of the biotechnology sector. Vertex operates as a focused, innovation-driven specialist in cystic fibrosis therapies. Regeneron, by contrast, is a diversified biotech giant with broad therapeutic franchises and extensive collaborations. This head-to-head pits niche specialization against scale and pipeline diversity. This analysis will determine which corporate path offers superior risk-adjusted returns for a diversified healthcare portfolio.
Table of contents
Companies Overview
Vertex Pharmaceuticals and Regeneron Pharmaceuticals both command significant roles in the biotechnology sector with distinct specialty areas.
Vertex Pharmaceuticals Incorporated: Cystic Fibrosis Therapy Leader
Vertex is a biotechnology company focused on cystic fibrosis treatments. Its revenue stems primarily from marketing drugs like TRIKAFTA, SYMDEKO, and KALYDECO targeting specific genetic mutations. In 2026, Vertex continues emphasizing pipeline expansion with Phase 2 and 3 clinical trials addressing rare diseases such as AAT deficiency and sickle cell disease, reflecting a strategic push beyond cystic fibrosis.
Regeneron Pharmaceuticals, Inc.: Diverse Therapeutics Innovator
Regeneron operates as a biotech giant with a broad therapeutic portfolio spanning ophthalmology, immunology, and oncology. It generates revenue through flagship products like EYLEA for eye diseases and Dupixent for inflammatory conditions. The company’s 2026 strategy centers on advancing multiple drug candidates and maintaining robust collaborations with major pharmaceutical firms, underpinning its expansive approach to disease treatment.
Strategic Collision: Similarities & Divergences
Both companies showcase strong research-driven models but differ in scope: Vertex specializes deeply in cystic fibrosis and rare genetic diseases, while Regeneron pursues a diversified portfolio across multiple therapeutic areas. Their primary battleground lies in innovation and pipeline strength to capture specialized patient segments. Investors face distinct profiles—Vertex offers focused niche expertise, Regeneron provides broader exposure with diversified risk.
Income Statement Comparison
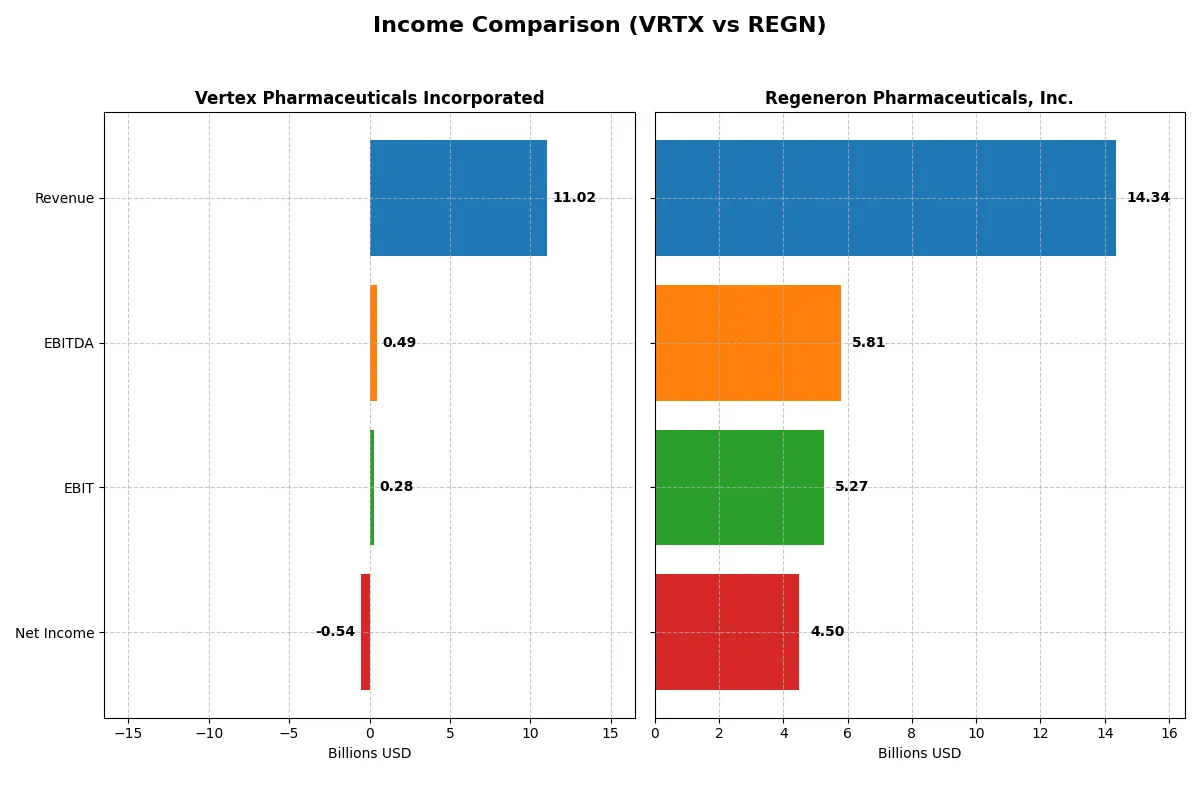
The following data dissects the core profitability and scalability of both corporate engines to reveal who dominates the bottom line:
| Metric | Vertex Pharmaceuticals Incorporated (VRTX) | Regeneron Pharmaceuticals, Inc. (REGN) |
|---|---|---|
| Revenue | 11B | 14.3B |
| Cost of Revenue | 1.53B | 1.97B |
| Operating Expenses | 9.72B | 8.68B |
| Gross Profit | 9.49B | 12.2B |
| EBITDA | 486M | 5.81B |
| EBIT | 279M | 5.27B |
| Interest Expense | 31M | 44M |
| Net Income | -536M | 4.5B |
| EPS | -2.08 | 43.07 |
| Fiscal Year | 2024 | 2025 |
Income Statement Analysis: The Bottom-Line Duel
This income statement comparison reveals which company operates more efficiently and delivers stronger financial returns.
Vertex Pharmaceuticals Incorporated Analysis
Vertex’s revenue rose 11.7% to $11B in 2024, but net income plunged to a $536M loss from $3.62B profit in 2023. Gross margin remains stellar at 86%, yet net margin flipped negative at -4.9%. Operating expenses and other costs eroded earnings despite solid revenue growth, signaling deteriorating profitability momentum.
Regeneron Pharmaceuticals, Inc. Analysis
Regeneron posted $14.3B revenue in 2025, nearly flat year-over-year, maintaining a high gross margin of 86.3%. Net income increased slightly to $4.5B, with a robust net margin of 31.4%. EBIT margin at 36.8% reflects efficient cost control and steady earnings growth, supporting a resilient financial profile amid modest top-line growth.
Margin Strength vs. Earnings Stability
Regeneron clearly outperforms Vertex on profitability, delivering strong net margins and positive earnings growth despite limited revenue expansion. Vertex shows impressive revenue momentum but suffers from weakening margins and a net loss in the latest year. For investors prioritizing stable, efficient earnings, Regeneron’s profile offers a more attractive risk-reward balance.
Financial Ratios Comparison
These vital ratios act as a diagnostic tool to expose underlying fiscal health, valuation premiums, and capital efficiency for Vertex Pharmaceuticals Incorporated (VRTX) and Regeneron Pharmaceuticals, Inc. (REGN):
| Ratios | Vertex Pharmaceuticals (VRTX) | Regeneron Pharmaceuticals (REGN) |
|---|---|---|
| ROE | -3.26% (2024) | 14.41% (2025) |
| ROIC | 2.63% (2024) | 9.16% (2025) |
| P/E | -193.61 (2024) | 17.92 (2025) |
| P/B | 6.32 (2024) | 2.58 (2025) |
| Current Ratio | 2.69 (2024) | 4.77 (2025) |
| Quick Ratio | 2.35 (2024) | 4.22 (2025) |
| D/E | 0.11 (2024) | 0.09 (2025) |
| Debt-to-Assets | 7.76% (2024) | 6.67% (2025) |
| Interest Coverage | -7.61 (2024) | 84.31 (2025) |
| Asset Turnover | 0.49 (2024) | 0.35 (2025) |
| Fixed Asset Turnover | 4.26 (2024) | 2.80 (2025) |
| Payout Ratio | 0% (2024) | 8.22% (2025) |
| Dividend Yield | 0% (2024) | 0.46% (2025) |
| Fiscal Year | 2024 | 2025 |
Efficiency & Valuation Duel: The Vital Signs
Financial ratios act as a company’s DNA, exposing hidden risks and operational strengths that shape investor confidence and valuation integrity.
Vertex Pharmaceuticals Incorporated
Vertex shows negative profitability with a -3.26% ROE and -4.86% net margin, signaling operational challenges. Its valuation appears stretched, reflected in a negative P/E and a high 6.32 price-to-book ratio. Vertex does not pay dividends, opting instead to reinvest heavily in R&D, dedicating over 32% of revenue to innovation.
Regeneron Pharmaceuticals, Inc.
Regeneron reports a solid 31.41% net margin and a 14.41% ROE, indicating healthy profitability. Its valuation is reasonable with a P/E near 18 and a price-to-book of 2.58. The company delivers modest shareholder returns through a 0.46% dividend yield while maintaining moderate reinvestment in R&D at roughly 41% of revenue.
Operational Efficiency vs. Valuation Discipline
Vertex’s aggressive reinvestment contrasts with Regeneron’s balanced approach, where profitability and valuation metrics align more favorably. Regeneron better balances risk and reward through stable margins and reasonable multiples. Investors seeking operational safety may prefer Regeneron, while those focused on growth through innovation might consider Vertex’s profile.
Which one offers the Superior Shareholder Reward?
I compare Vertex Pharmaceuticals (VRTX) and Regeneron Pharmaceuticals (REGN) on shareholder rewards through dividends, payout ratios, and buybacks. Neither company pays dividends currently, but REGN offers a modest 0.46% yield in 2025 with an 8.2% payout ratio, indicating some cash return. VRTX reinvests all free cash flow into growth, with no dividend payout. Both execute share buybacks, but REGN’s higher free cash flow per share ($39B vs. VRTX’s negative in 2024) supports more sustainable buybacks. REGN’s capital allocation balances shareholder returns and R&D, while VRTX prioritizes reinvestment despite recent net losses. I find REGN’s distribution model more sustainable and attractive for total return in 2026.
Comparative Score Analysis: The Strategic Profile
The radar chart reveals the fundamental DNA and trade-offs of Vertex Pharmaceuticals and Regeneron Pharmaceuticals, highlighting their financial and valuation strengths:
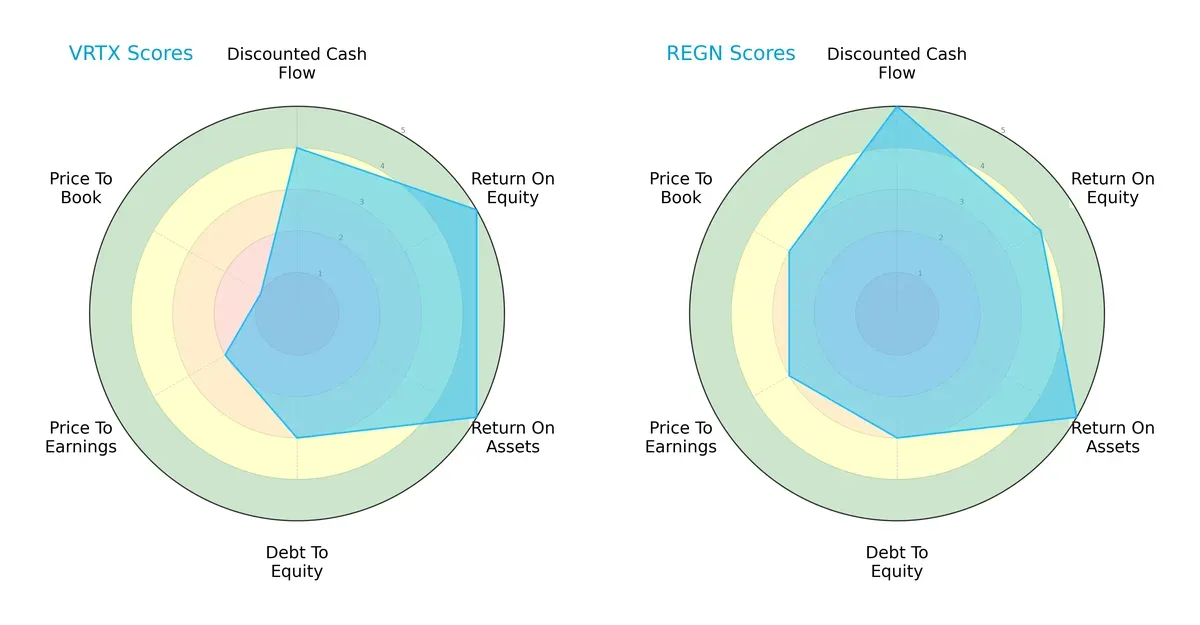
Vertex shows superior profitability metrics with top ROE and ROA scores, demonstrating efficient capital and asset utilization. Regeneron leads on discounted cash flow and valuation scores, signaling better market pricing and cash flow expectations. Both share moderate debt levels, but Vertex’s valuation scores lag, indicating potential overvaluation risks. Regeneron presents a more balanced profile, while Vertex relies heavily on operational efficiency.
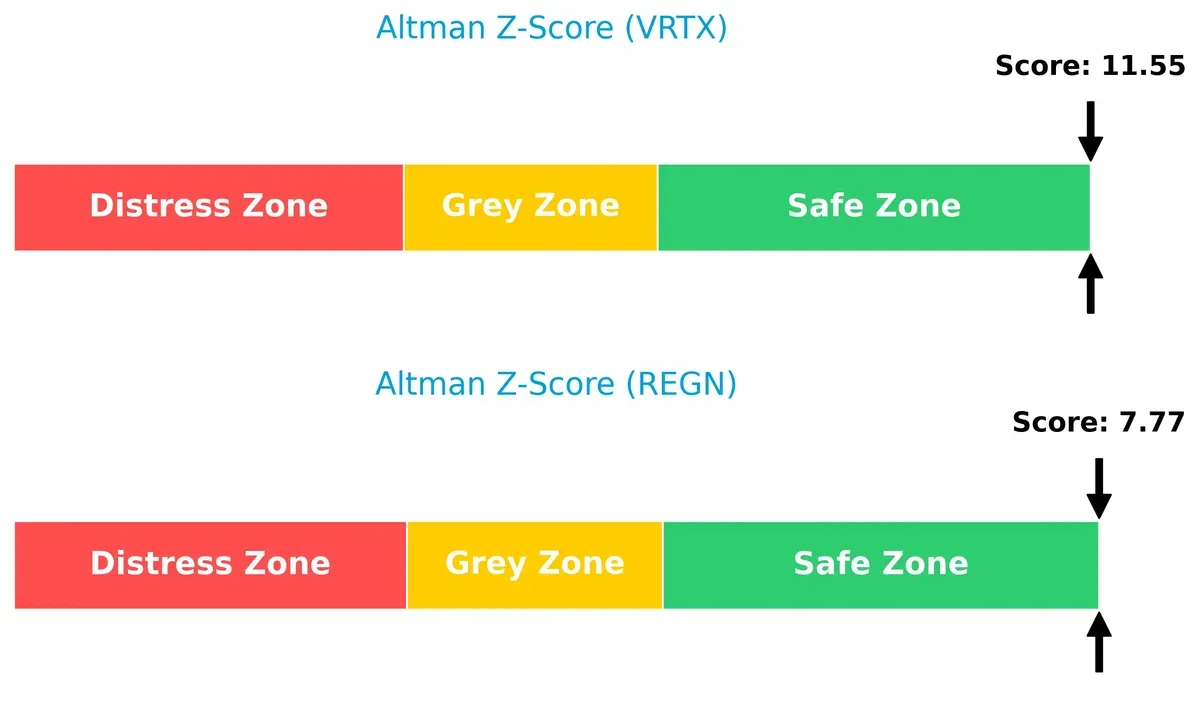
Bankruptcy Risk: Solvency Showdown
Vertex’s Altman Z-Score of 11.5 significantly exceeds Regeneron’s 7.8, both safely above distress thresholds, reflecting robust solvency and low bankruptcy risk in the current economic cycle:
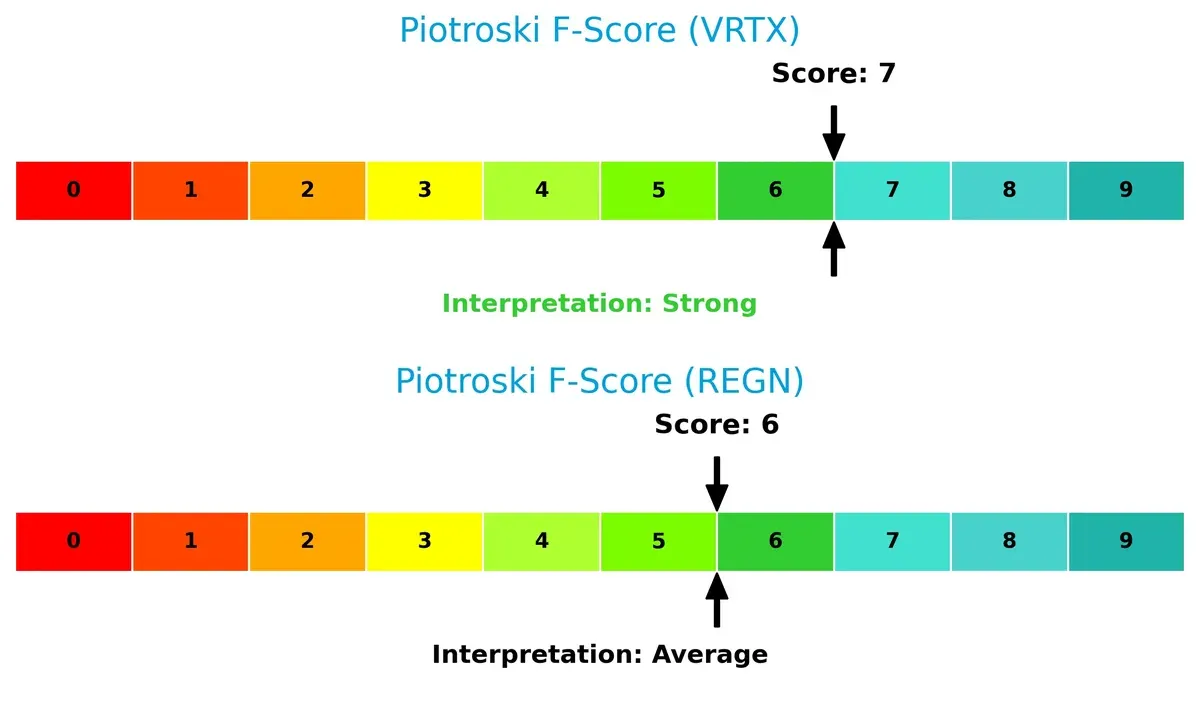
Financial Health: Quality of Operations
Vertex’s Piotroski F-Score of 7 surpasses Regeneron’s 6, indicating stronger internal financial health. Regeneron’s average score suggests some operational or liquidity concerns relative to Vertex’s more solid fundamentals:
How are the two companies positioned?
This section dissects the operational DNA of Vertex and Regeneron by comparing their revenue distribution and internal dynamics. The goal is to confront their economic moats and identify which model offers the most resilient competitive advantage today.
Revenue Segmentation: The Strategic Mix
This comparison breaks down how Vertex Pharmaceuticals and Regeneron diversify revenue streams, highlighting their core sector bets and strategic focus areas:
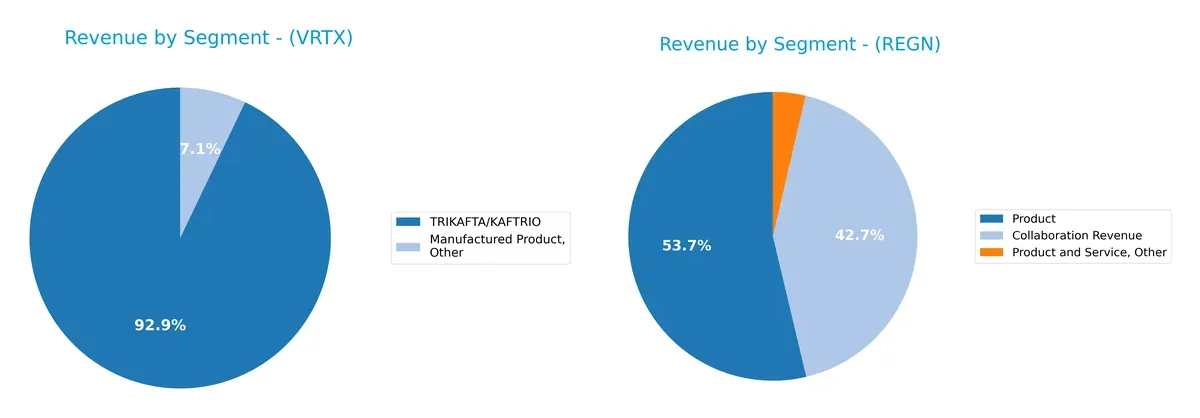
Vertex Pharmaceuticals anchors 93% of its 2024 revenue on TRIKAFTA/KAFTRIO at $10.2B, showing heavy dependence on this flagship product. In contrast, Regeneron balances its $15.9B total with $7.6B from Product sales and a substantial $6.1B from Collaboration Revenue, demonstrating a more diversified income base. Vertex’s concentration risks contrast with Regeneron’s strategy, which leverages ecosystem lock-in through collaborations and multiple product offerings.
Strengths and Weaknesses Comparison
This table compares the Strengths and Weaknesses of Vertex Pharmaceuticals Incorporated (VRTX) and Regeneron Pharmaceuticals, Inc. (REGN):
VRTX Strengths
- Strong current and quick ratios indicate solid short-term liquidity
- Low debt to equity and assets show conservative leverage
- Favorable interest coverage supports debt servicing
- Large US and European revenue base demonstrates global footprint
- Dominant TRIKAFTA/KAFTRIO sales drive profitability
REGN Strengths
- High net margin reflects operational efficiency
- Favorable interest coverage indicates strong debt management
- Diverse revenue streams include collaboration and product sales
- Moderate leverage with low debt ratios
- Large product revenue base supports market presence
VRTX Weaknesses
- Negative net margin and ROE indicate unprofitable operations
- ROIC below WACC suggests value destruction
- High price-to-book ratio may signal overvaluation
- Unfavorable asset turnover points to underutilized assets
- Lack of dividend yield limits income for investors
REGN Weaknesses
- Unfavorable current ratio suggests liquidity risk
- Asset turnover is low, indicating inefficiency
- Dividend yield remains negligible
- Neutral ROE and ROIC reflect average capital returns
- PE and PB ratios are neutral, limiting valuation clarity
VRTX exhibits solid liquidity and low leverage but struggles with profitability and asset efficiency. REGN shows strong profit margins and revenue diversification but has some liquidity and efficiency concerns. These contrasts highlight different strategic and operational challenges for both companies.
The Moat Duel: Analyzing Competitive Defensibility
A structural moat is the only true shield protecting long-term profits from relentless competitive erosion and market disruption:
Vertex Pharmaceuticals Incorporated: Innovation-Driven Intangible Assets
Vertex relies on proprietary therapies for cystic fibrosis, creating a moat from strong intangible assets and patent protections. This manifests in high gross margins (86%) despite net margin challenges. Pipeline expansions in rare diseases could deepen its moat in 2026 but require careful execution.
Regeneron Pharmaceuticals, Inc.: Robust Cost-Advantage and Portfolio Diversification
Regeneron contrasts Vertex with a broader drug portfolio and cost efficiency, reflected in a strong EBIT margin (37%) and net margin (31%). Its diverse product lineup supports steady revenue, though a slight ROIC decline signals emerging pressure. Expanding into new indications offers upside potential.
Intangible Assets vs. Cost Efficiency: Who Holds the Stronger Moat?
Regeneron exhibits a wider moat with value-creating capital returns and margin stability. Vertex’s innovation moat is narrower, burdened by declining ROIC and profitability. Regeneron is better positioned to defend market share amid increasing biotech competition.
Which stock offers better returns?
Over the past 12 months, Vertex Pharmaceuticals shows a strong upward trajectory, while Regeneron Pharmaceuticals experiences a notable decline with some recent recovery.
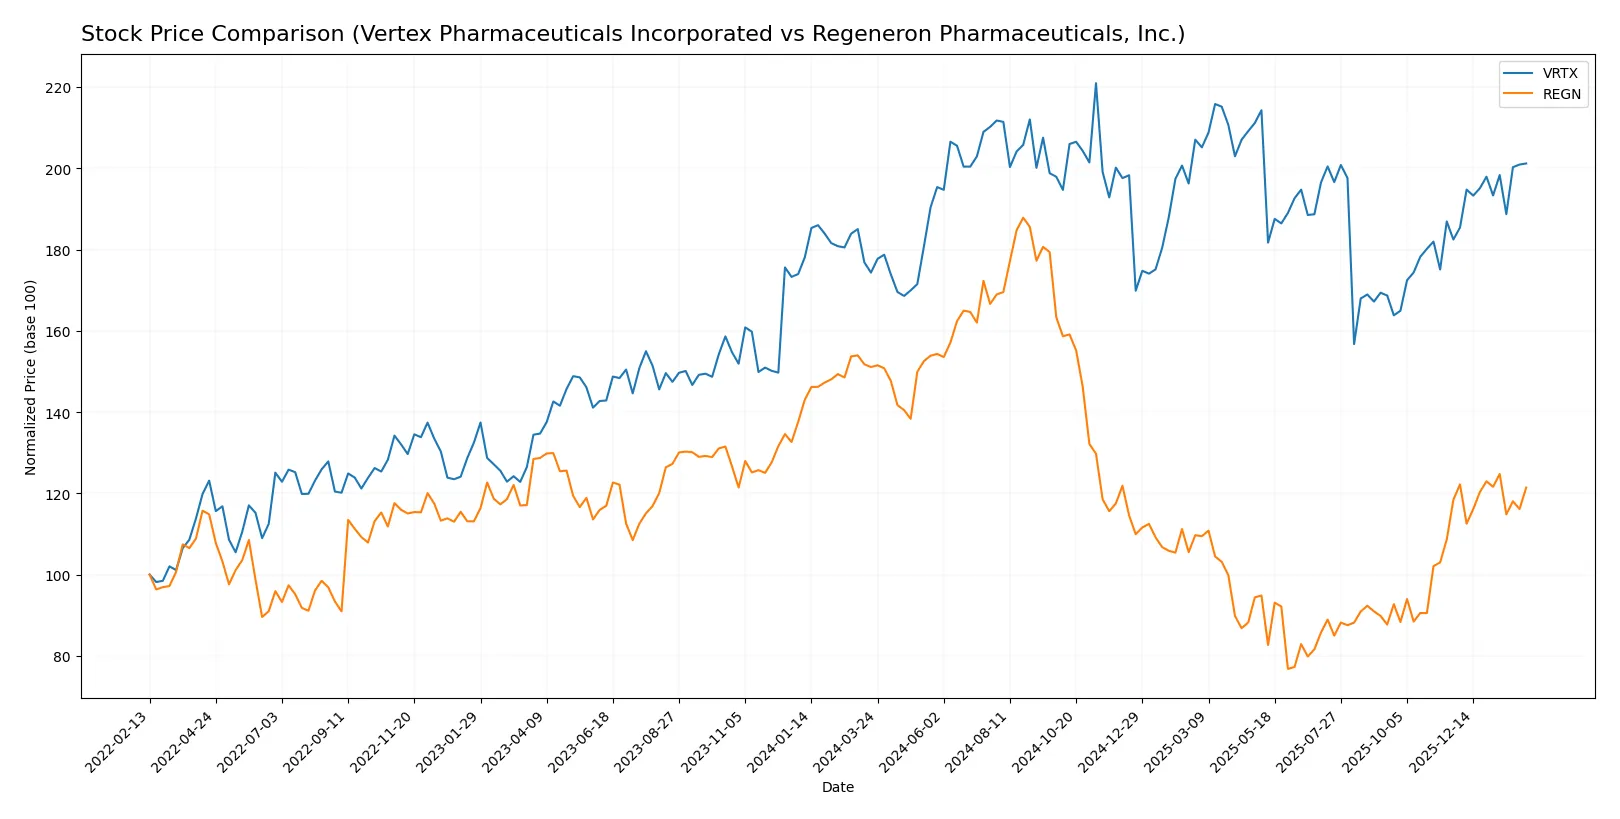
Trend Comparison
Vertex Pharmaceuticals delivered a 15.41% price increase over the past year, indicating a bullish trend with accelerating momentum and a volatility standard deviation of 34.07. The stock reached a high of 516.74 and a low of 366.54.
Regeneron Pharmaceuticals incurred a 19.64% price drop over the same period, marking a bearish trend despite acceleration. Its price fluctuated widely, reflected in a high standard deviation of 199.21, with a peak at 1199.12 and a trough at 490.28.
Comparing both, Vertex’s stock performance outpaced Regeneron’s, showing positive returns versus a significant decline in Regeneron’s share price over the past year.
Target Prices
Analysts show a bullish consensus on Vertex Pharmaceuticals and Regeneron Pharmaceuticals with significant upside potential.
| Company | Target Low | Target High | Consensus |
|---|---|---|---|
| Vertex Pharmaceuticals Incorporated | 445 | 606 | 522.18 |
| Regeneron Pharmaceuticals, Inc. | 700 | 1057 | 851.06 |
Vertex’s target consensus at $522 implies a roughly 11% upside from the current $470 price, signaling confidence in its growth trajectory. Regeneron’s consensus target near $851 suggests about a 10% gain, reflecting strong market expectations despite recent price strength.

Don’t Let Luck Decide Your Entry Point
Optimize your entry points with our advanced ProRealTime indicators. You’ll get efficient buy signals with precise price targets for maximum performance. Start outperforming now!
How do institutions grade them?
Vertex Pharmaceuticals Incorporated Grades
The table below summarizes recent grades from reputable institutions for Vertex Pharmaceuticals Incorporated:
| Grading Company | Action | New Grade | Date |
|---|---|---|---|
| Barclays | Upgrade | Overweight | 2026-01-28 |
| UBS | Maintain | Buy | 2026-01-26 |
| Evercore ISI Group | Maintain | Outperform | 2026-01-23 |
| RBC Capital | Upgrade | Outperform | 2026-01-22 |
| Bernstein | Upgrade | Outperform | 2026-01-12 |
| Wolfe Research | Upgrade | Outperform | 2026-01-06 |
| Leerink Partners | Maintain | Outperform | 2025-12-29 |
| Wells Fargo | Maintain | Overweight | 2025-12-10 |
| Morgan Stanley | Maintain | Overweight | 2025-12-05 |
| Morgan Stanley | Upgrade | Overweight | 2025-12-03 |
Regeneron Pharmaceuticals, Inc. Grades
The table below summarizes recent grades from reputable institutions for Regeneron Pharmaceuticals, Inc.:
| Grading Company | Action | New Grade | Date |
|---|---|---|---|
| Cantor Fitzgerald | Maintain | Overweight | 2026-02-02 |
| JP Morgan | Maintain | Overweight | 2026-02-02 |
| Truist Securities | Maintain | Buy | 2026-02-02 |
| Morgan Stanley | Maintain | Equal Weight | 2026-02-02 |
| Wells Fargo | Maintain | Equal Weight | 2026-02-02 |
| Oppenheimer | Maintain | Outperform | 2026-02-02 |
| Evercore ISI Group | Maintain | Outperform | 2026-01-22 |
| Truist Securities | Maintain | Buy | 2026-01-08 |
| B of A Securities | Upgrade | Buy | 2026-01-07 |
| Morgan Stanley | Maintain | Equal Weight | 2025-12-12 |
Which company has the best grades?
Vertex Pharmaceuticals has consistently received more upgrades and higher-end ratings such as multiple “Outperform” and “Overweight” grades. Regeneron’s grades are stable but lean more toward “Equal Weight” and “Buy.” Vertex’s stronger consensus might indicate greater institutional confidence, potentially influencing investor sentiment more positively.
Risks specific to each company
The following categories identify critical pressure points and systemic threats facing Vertex Pharmaceuticals and Regeneron in the 2026 market environment:
1. Market & Competition
Vertex Pharmaceuticals Incorporated
- Focused on cystic fibrosis therapies, faces risks from niche market dependency and pipeline setbacks.
Regeneron Pharmaceuticals, Inc.
- Broad product portfolio reduces dependence risk but faces intense competition in multiple therapeutic areas.
2. Capital Structure & Debt
Vertex Pharmaceuticals Incorporated
- Low debt-to-equity (0.11) and strong interest coverage (9.12) indicate conservative leverage use.
Regeneron Pharmaceuticals, Inc.
- Slightly lower debt-to-equity (0.09) and very high interest coverage (120.42) signal robust financial stability.
3. Stock Volatility
Vertex Pharmaceuticals Incorporated
- Low beta (0.319) suggests limited stock volatility and defensive characteristics.
Regeneron Pharmaceuticals, Inc.
- Moderate beta (0.413) indicates higher volatility but still below market average.
4. Regulatory & Legal
Vertex Pharmaceuticals Incorporated
- Regulatory risk concentrated on FDA approvals for cystic fibrosis and rare disease pipeline.
Regeneron Pharmaceuticals, Inc.
- Broad drug portfolio increases regulatory complexity but diversifies legal risk.
5. Supply Chain & Operations
Vertex Pharmaceuticals Incorporated
- Relies heavily on specialty distributors, which may pose supply chain bottlenecks.
Regeneron Pharmaceuticals, Inc.
- Larger scale operations and diversified supply chain reduce operational risk.
6. ESG & Climate Transition
Vertex Pharmaceuticals Incorporated
- Limited public ESG disclosures may concern sustainability-focused investors.
Regeneron Pharmaceuticals, Inc.
- More established ESG programs but faces industry-wide pressure to reduce environmental impact.
7. Geopolitical Exposure
Vertex Pharmaceuticals Incorporated
- Primarily US-focused sales mitigate geopolitical risks but limit global diversification.
Regeneron Pharmaceuticals, Inc.
- Global presence increases exposure to international trade and regulatory risks.
Which company shows a better risk-adjusted profile?
Vertex’s biggest risk lies in its narrow market focus and pipeline uncertainty, which could impair growth. Regeneron faces regulatory and geopolitical complexity but benefits from a diversified portfolio and stronger profitability metrics. Regeneron’s broader product base and higher net margins suggest a more balanced risk-adjusted profile. Vertex’s strong balance sheet and low volatility offer defensive appeal, yet its negative net margin signals underlying operational challenges. Regeneron’s safer capital structure and very favorable Altman Z-score support its resilience despite higher stock volatility.
Final Verdict: Which stock to choose?
Vertex Pharmaceuticals’ superpower lies in its remarkable efficiency in asset utilization and strong cash flow generation, despite recent profitability setbacks. The key point of vigilance remains its declining profitability and value destruction trend. It suits aggressive growth portfolios willing to tolerate volatility for potential breakthrough innovation.
Regeneron Pharmaceuticals commands a durable strategic moat through consistent value creation and robust profitability. Its recurring revenue and conservative capital structure offer better financial stability than Vertex. Regeneron fits well in GARP portfolios seeking a balance of growth and reasonable valuation.
If you prioritize asset efficiency and high growth potential, Vertex appears compelling but carries meaningful execution risk. However, if you seek steady profitability and stronger financial resilience, Regeneron offers better stability and a more attractive risk-reward profile. Each presents distinct analytical scenarios depending on your risk tolerance and investment horizon.
Disclaimer: Investment carries a risk of loss of initial capital. The past performance is not a reliable indicator of future results. Be sure to understand risks before making an investment decision.
Go Further
I encourage you to read the complete analyses of Vertex Pharmaceuticals Incorporated and Regeneron Pharmaceuticals, Inc. to enhance your investment decisions: