Home > Comparison > Real Estate > SPG vs REG
The strategic rivalry between Simon Property Group, Inc. and Regency Centers Corporation defines the trajectory of the retail real estate sector. Simon operates as a capital-intensive REIT with premier mixed-use destinations, while Regency focuses on affluent, community-centered shopping centers as a self-managed REIT. This analysis probes their contrasting operational models and investment profiles to identify which offers the superior risk-adjusted return for diversified portfolios in 2026.

Table of contents
Companies Overview
Simon Property Group and Regency Centers stand as influential leaders in the retail real estate sector.
Simon Property Group, Inc.: Premier Global Shopping Destination Owner
Simon Property Group dominates as a REIT specializing in premier shopping, dining, and entertainment destinations across North America, Europe, and Asia. Its core revenue stems from leasing retail spaces that attract billions in annual sales. The company’s 2026 strategy focuses on expanding mixed-use properties to enhance community engagement and diversify income streams.
Regency Centers Corporation: National Neighborhood Retail Specialist
Regency Centers operates as a national owner and developer of shopping centers in affluent, densely populated markets. Its revenue engine relies on long-term leases with grocers, restaurants, and service providers embedded in local communities. In 2026, Regency emphasizes optimizing its portfolio for high productivity tenants and maintaining strong community connections through active property management.
Strategic Collision: Similarities & Divergences
Both companies excel as retail REITs but diverge in scale and market focus—Simon pursues a global, mixed-use approach while Regency concentrates on neighborhood centers. Their primary battleground lies in attracting premium tenants amid evolving consumer patterns. Investors encounter distinct profiles: Simon offers broad geographic reach and diversification; Regency delivers focused market penetration with a community-centric model.
Income Statement Comparison
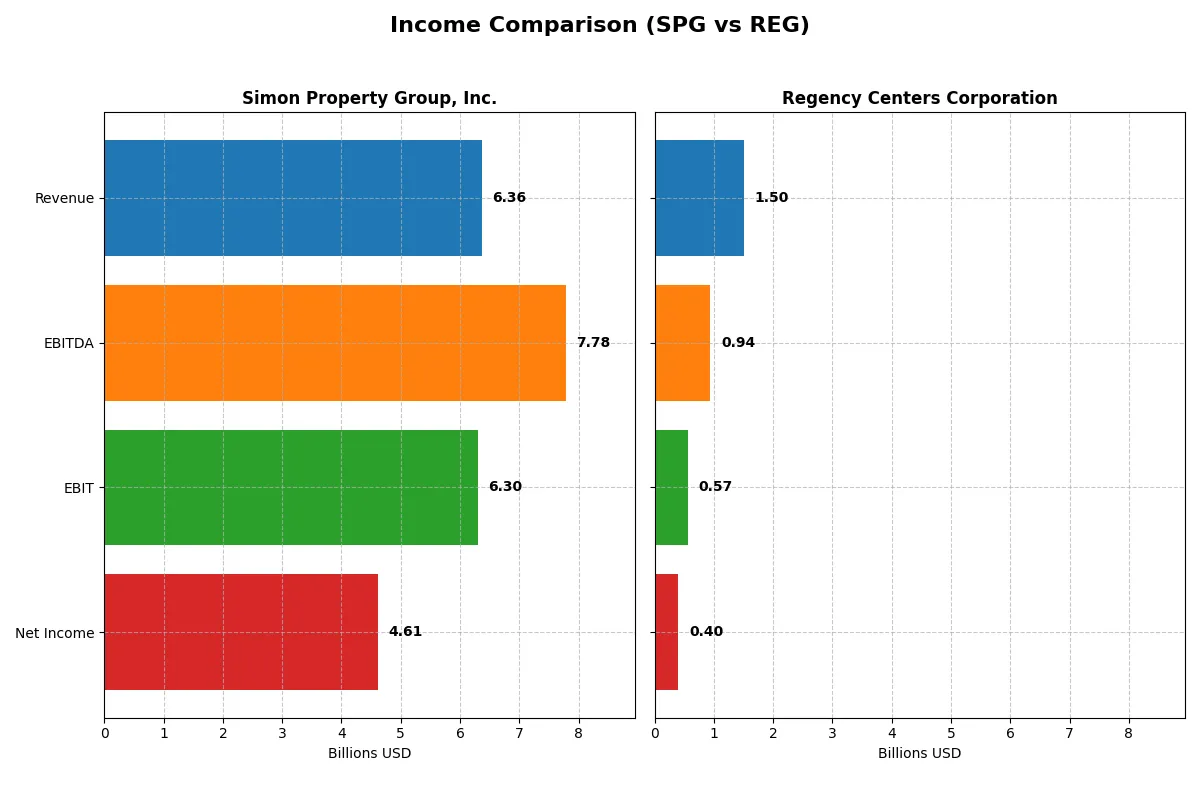
The following data dissects the core profitability and scalability of both corporate engines to reveal who dominates the bottom line:
| Metric | Simon Property Group, Inc. (SPG) | Regency Centers Corporation (REG) |
|---|---|---|
| Revenue | 6.36B | 1.50B |
| Cost of Revenue | 909M | 433M |
| Operating Expenses | 2.28B | 101M |
| Gross Profit | 5.46B | 1.07B |
| EBITDA | 7.78B | 940M |
| EBIT | 6.30B | 568M |
| Interest Expense | 975M | 189M |
| Net Income | 4.61B | 400M |
| EPS | 14.14 | 2.12 |
| Fiscal Year | 2025 | 2024 |
Income Statement Analysis: The Bottom-Line Duel
The following income statement comparison reveals the true efficiency and profitability of Simon Property Group and Regency Centers’ corporate engines.
Simon Property Group, Inc. Analysis
Simon Property Group’s revenue climbed steadily from $5.1B in 2021 to $6.36B in 2025, reflecting a 24% growth over five years. Net income surged impressively to $4.61B in 2025, more than doubling since 2021. Gross margin holds robust at 85.7%, and net margin at 72.5% shows exceptional profitability. The 2025 results demonstrate strong momentum with a 6.7% revenue rise and an 82.4% net margin expansion, signaling superior operational efficiency despite elevated interest expenses.
Regency Centers Corporation Analysis
Regency Centers expanded revenue from $1.04B in 2020 to $1.5B in 2024, achieving a 43% growth over five years. Net income grew substantially to $400M in 2024, nearly a 8-fold increase from 2020. The company maintains a solid gross margin of 71.2% and a net margin of 26.6%, reflecting sound profitability. In 2024, Regency reported a 9.7% revenue increase and a stable net margin, indicating steady operational improvement and consistent capital management.
Margin Dominance vs. Growth Scale
Simon Property Group dominates on margin strength and absolute profitability, showcasing an extraordinary net margin above 70%. Regency Centers, while smaller, excels in faster revenue and net income growth rates. Investors seeking high-margin, large-scale cash flow generators may prefer Simon Property Group’s profile. Conversely, those valuing rapid expansion and improving profitability might find Regency Centers’ growth trajectory more attractive.
Financial Ratios Comparison
These vital ratios act as a diagnostic tool to expose the underlying fiscal health, valuation premiums, and capital efficiency of each company:
| Ratios | Simon Property Group (SPG) | Regency Centers (REG) |
|---|---|---|
| ROE | 88.6% | 5.95% |
| ROIC | 8.55% | 7.98% |
| P/E | 13.08 | 35.04 |
| P/B | 11.59 | 2.09 |
| Current Ratio | 0.16 | 0.73 |
| Quick Ratio | 0.16 | 0.73 |
| D/E (Debt-to-Equity) | 5.75 | 0.75 |
| Debt-to-Assets | 73.7% | 40.5% |
| Interest Coverage | 3.26 | 5.13 |
| Asset Turnover | 0.157 | 0.121 |
| Fixed Asset Turnover | 0.205 | 4.55 |
| Payout ratio | 60.4% | 125.9% |
| Dividend yield | 4.62% | 3.59% |
| Fiscal Year | 2025 | 2024 |
Efficiency & Valuation Duel: The Vital Signs
Financial ratios act as a company’s DNA, unveiling hidden risks and operational strengths critical for investment decisions.
Simon Property Group, Inc.
Simon Property Group dominates with an exceptional ROE of 88.6% and a robust net margin at 72.5%. Its P/E ratio of 13.1 suggests the stock is attractively priced compared to peers. However, a low current ratio of 0.16 and a high debt-to-equity of 5.75 signal liquidity and leverage concerns. The firm delivers a solid 4.6% dividend yield, rewarding shareholders reliably.
Regency Centers Corporation
Regency Centers posts a modest ROE of 5.95% and a net margin of 26.6%, indicating moderate profitability. Its P/E ratio of 35.0 marks the stock as expensive relative to the sector. The current ratio of 0.73 and debt-to-equity of 0.75 reflect better liquidity and lower leverage than Simon. It provides a 3.6% dividend yield, balancing income with cautious capital management.
Premium Valuation vs. Operational Safety
Simon Property Group offers higher profitability and shareholder returns but carries significant liquidity and leverage risks. Regency Centers trades at a premium valuation with safer liquidity and moderate debt. Investors seeking aggressive income and efficiency might prefer Simon, while those favoring stability and lower financial risk may lean toward Regency.
Which one offers the Superior Shareholder Reward?
Simon Property Group (SPG) delivers a higher dividend yield around 4.6–5.2% with payout ratios near 60%, signaling strong free cash flow coverage. Regency Centers (REG) offers a lower yield near 3.6–3.8%, but with a more moderate payout ratio above 100%, suggesting a reliance on stable cash flow. SPG’s buyback intensity is less visible but remains significant given its capital structure. REG’s buybacks complement dividends, supported by a robust operating cash flow ratio above 1.4. I find SPG’s yield and sustainable payout backed by solid cash flow more compelling for total return in 2026, despite higher leverage risks. SPG’s model balances income and capital returns better than REG’s conservative yield and growth reinvestment approach.
Comparative Score Analysis: The Strategic Profile
The radar chart reveals the fundamental DNA and trade-offs of Simon Property Group and Regency Centers Corporation:
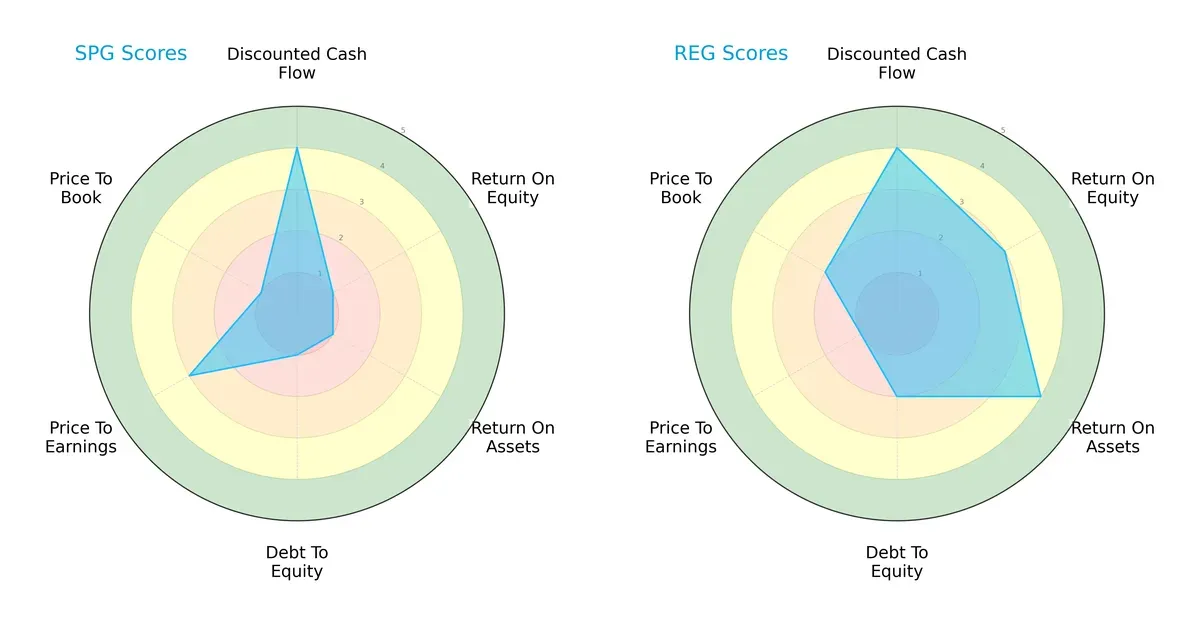
Simon Property Group (SPG) shows a polarized profile with strong discounted cash flow (4) but weak returns (ROE 1, ROA 1) and high leverage (debt/equity 1). Regency Centers (REG) presents a more balanced profile, excelling in asset efficiency (ROA 4) and equity returns (ROE 3) while maintaining moderate leverage (debt/equity 2). REG’s valuation scores (P/E 1, P/B 2) suggest some market skepticism compared to SPG’s moderate P/E (3) but poor P/B (1). Overall, REG offers a more stable and diversified financial foundation.
Bankruptcy Risk: Solvency Showdown
Both firms sit in the distress zone with Altman Z-Scores below 1.8, signaling elevated bankruptcy risk and financial strain in this cycle:
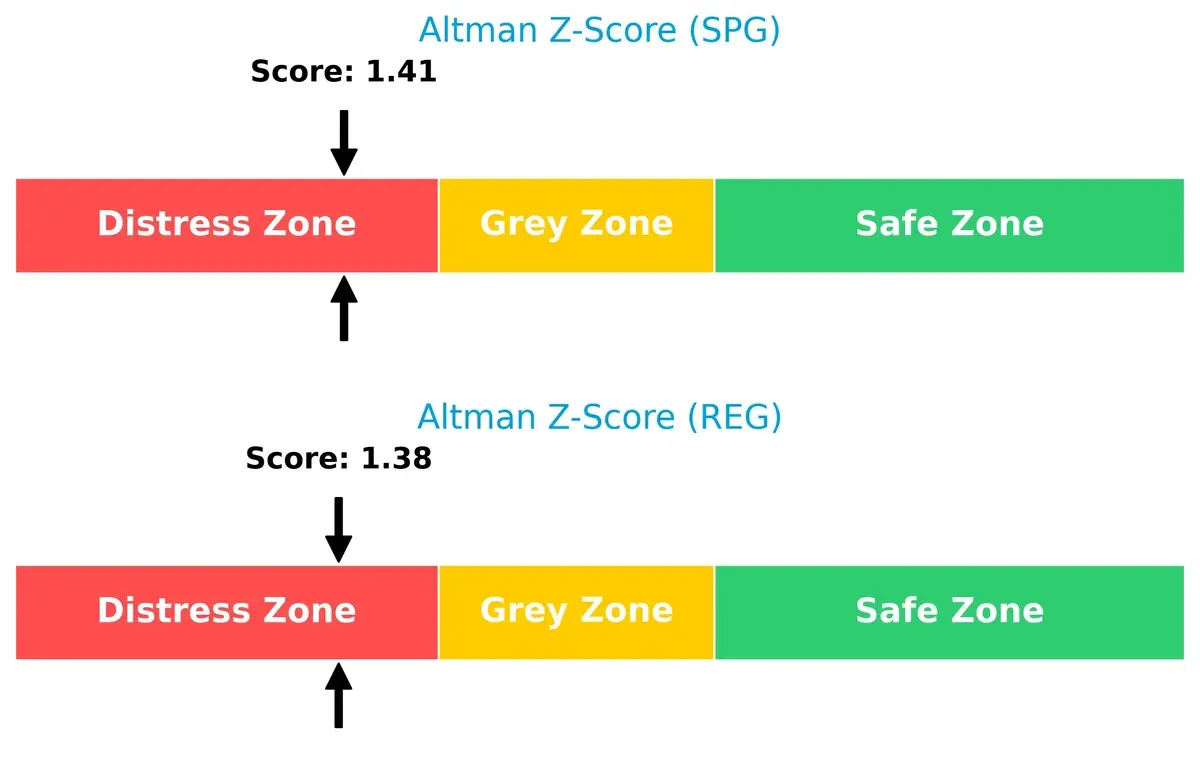
Simon Property Group posts a 1.41 Z-Score, slightly above Regency Centers’ 1.38, but both hover near distress thresholds. This proximity indicates vulnerability to economic shocks and challenges in sustaining long-term solvency without operational improvements.
Financial Health: Quality of Operations
Simon Property Group leads in financial health with a Piotroski F-Score of 7, indicating strong internal metrics and operational quality compared to Regency Centers’ average score of 6:
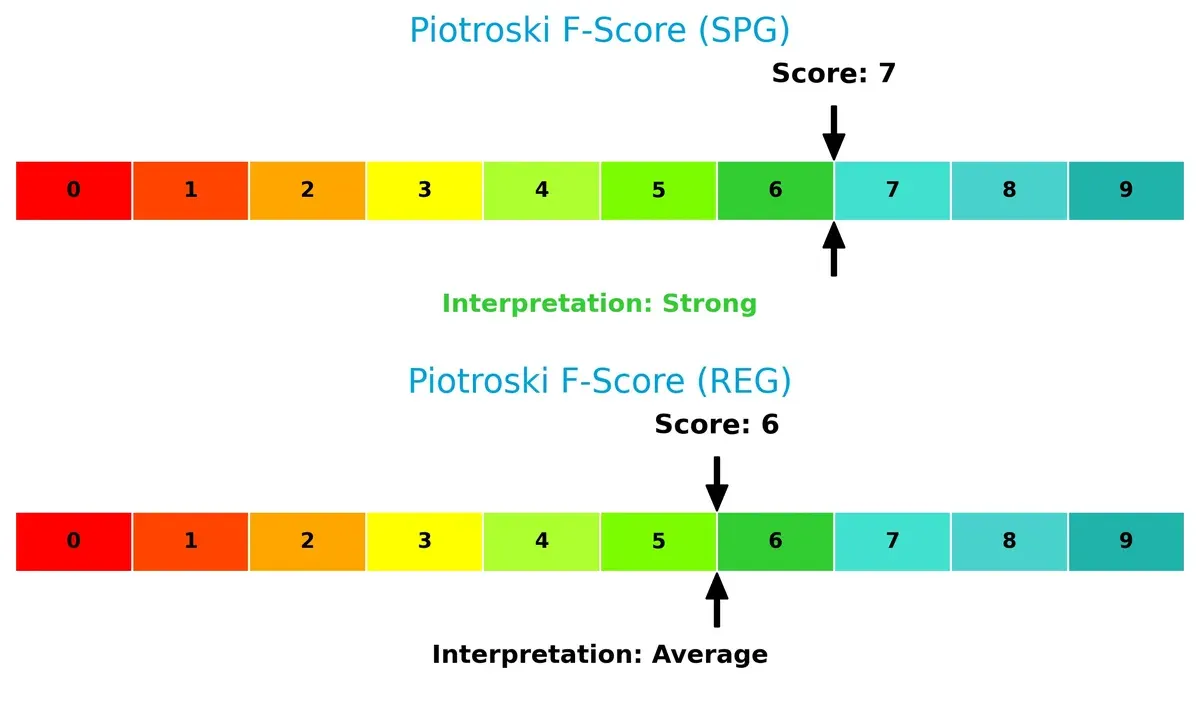
SPG’s higher score suggests better profitability, liquidity, and efficiency. REG’s score flags modest red flags across financial controls. Investors should weigh SPG’s operational robustness against its balance sheet risks carefully.
How are the two companies positioned?
This section dissects the operational DNA of SPG and REG by comparing their revenue distribution and internal dynamics, including strengths and weaknesses. The goal is to confront their economic moats and identify the more resilient competitive advantage in today’s market.
Revenue Segmentation: The Strategic Mix
This visual comparison dissects how Simon Property Group and Regency Centers diversify their income streams and where their primary sector bets lie:
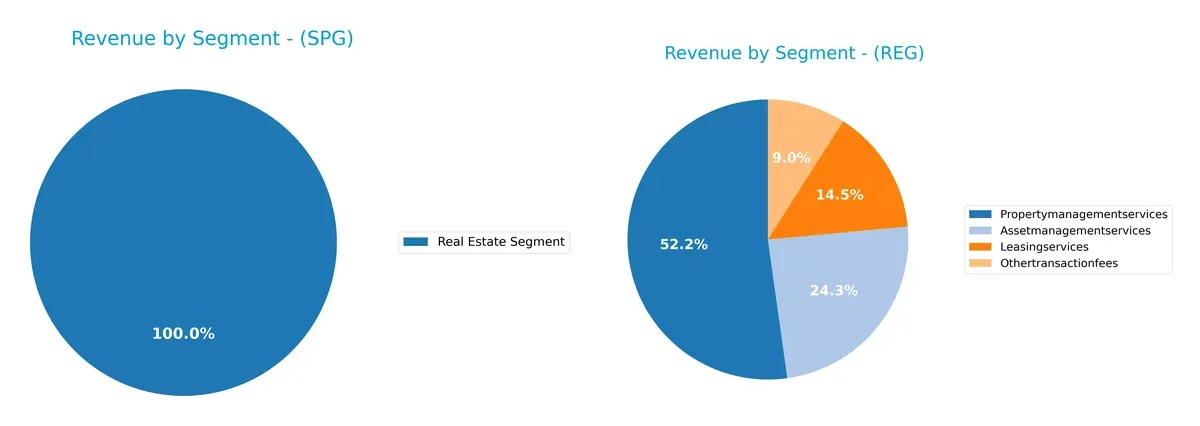
Simon Property Group anchors its revenue entirely in a single Real Estate Segment, generating $5.54B in 2024. Regency Centers diversifies across Property Management ($14.1M), Asset Management ($6.5M), Leasing ($3.9M), and Transaction Fees ($2.4M) in 2023. Simon’s concentration signals infrastructure dominance but higher sector risk. Regency’s spread reflects a balanced service ecosystem, reducing exposure but capping scale economies.
Strengths and Weaknesses Comparison
This table compares the strengths and weaknesses of Simon Property Group, Inc. (SPG) and Regency Centers Corporation (REG):
SPG Strengths
- High net margin of 72.51%
- Strong ROE at 88.61%
- Favorable PE ratio at 13.08
- Stable interest coverage of 6.46
- Consistent dividend yield of 4.62%
- Significant global presence with 1.5B revenue from Europe
REG Strengths
- Favorable net margin of 26.63%
- Neutral debt-to-equity at 0.75
- Favorable WACC at 7.05%
- High fixed asset turnover of 4.55
- Favorable dividend yield of 3.59%
- Diversified revenue streams across multiple service segments
SPG Weaknesses
- Low current and quick ratios at 0.16
- High debt-to-assets ratio at 73.74%
- Unfavorable PB ratio at 11.59
- Low asset turnover of 0.16
- High debt-to-equity at 5.75
- Slightly unfavorable global ratio profile
REG Weaknesses
- Low ROE at 5.95%
- Unfavorable PE ratio at 35.04
- Current and quick ratios below 1 at 0.73
- Unfavorable asset turnover at 0.12
- Neutral interest coverage of 3.0
- Slightly unfavorable global ratio profile
SPG shows strength in profitability and global reach but suffers from leverage and liquidity issues. REG presents a more diversified revenue base and asset efficiency but faces challenges in returns and valuation metrics. These factors frame each company’s strategic positioning within the real estate sector.
The Moat Duel: Analyzing Competitive Defensibility
A structural moat is the only reliable shield protecting long-term profits from relentless competitive pressure. Let’s dissect the moats of two leading retail REITs:
Simon Property Group, Inc. (SPG): Scale-Driven Location Moat
SPG leverages premier shopping destinations as its moat, creating high switching costs for tenants. Its robust 73% net margin signals margin stability. Expansion into mixed-use developments in 2026 could deepen this advantage.
Regency Centers Corporation (REG): Neighborhood-Centric Tenant Moat
REG’s moat stems from curated, community-focused centers anchored by essential grocers. Although smaller, REG’s margin growth and 28% ROIC trend outpace SPG’s, reflecting nimble capital use and local market penetration expansion potential.
Verdict: Scale Dominance vs. Localized Tenant Loyalty
Both firms show slightly favorable moats with growing ROIC, but SPG’s expansive footprint offers a wider moat. Yet, REG’s sharper ROIC growth suggests a deeper moat in efficiency. SPG remains better positioned to defend market share through sheer scale and tenant lock-in.
Which stock offers better returns?
Simon Property Group and Regency Centers have both exhibited solid price appreciation over the past year, with distinct acceleration patterns and buyer-dominant trading volumes shaping their trajectories.
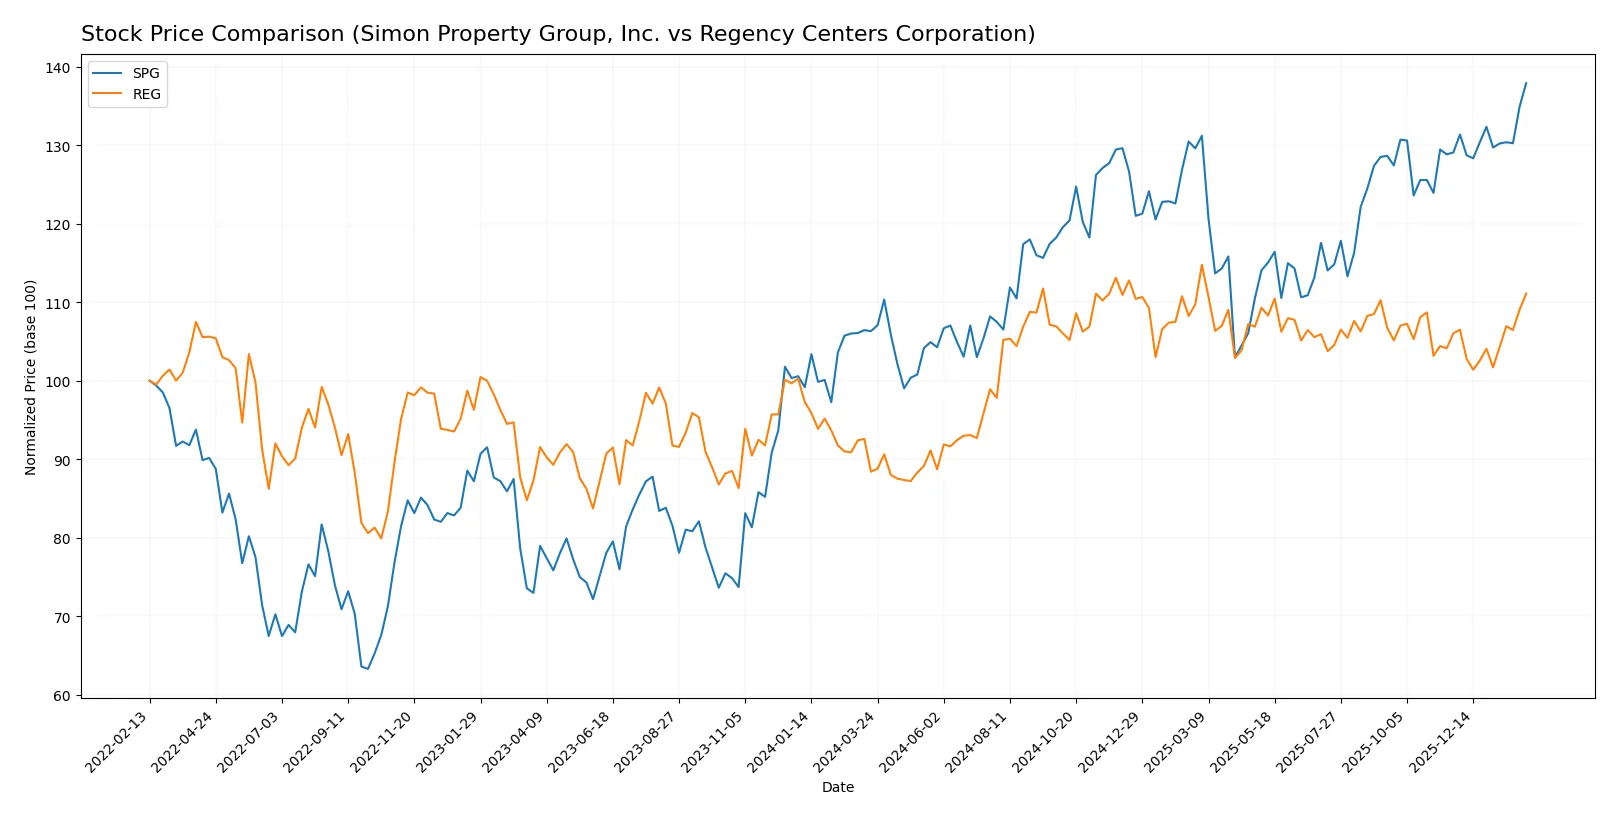
Trend Comparison
Simon Property Group’s stock shows a strong bullish trend over the past year, rising 29.73%, with accelerating gains and notable volatility (13.78 std deviation). It peaked at 195.59 and bottomed at 140.44.
Regency Centers also posts a bullish trend, up 25.68% over the same period, with accelerating momentum but lower volatility (4.7 std deviation). Its price ranged between 58.28 and 76.7.
Simon Property Group outperformed Regency Centers by 4.05% in market returns, both demonstrating acceleration yet SPG delivered higher overall gains.
Target Prices
Analysts present a balanced target consensus for Simon Property Group, Inc. and Regency Centers Corporation.
| Company | Target Low | Target High | Consensus |
|---|---|---|---|
| Simon Property Group, Inc. | 173 | 230 | 194.6 |
| Regency Centers Corporation | 74 | 85 | 79.89 |
Simon Property Group’s consensus target of 194.6 aligns closely with its current price of 195.59, indicating a stable outlook. Regency Centers’ target consensus at 79.89 suggests modest upside from its current 74.25 price.

Don’t Let Luck Decide Your Entry Point
Optimize your entry points with our advanced ProRealTime indicators. You’ll get efficient buy signals with precise price targets for maximum performance. Start outperforming now!
How do institutions grade them?
The following tables present recent institutional grades for Simon Property Group, Inc. and Regency Centers Corporation:
Simon Property Group, Inc. Grades
This table shows recent grading updates by various reputable firms for Simon Property Group, Inc.:
| Grading Company | Action | New Grade | Date |
|---|---|---|---|
| Piper Sandler | Maintain | Overweight | 2026-02-03 |
| Stifel | Maintain | Hold | 2026-02-03 |
| Evercore ISI Group | Maintain | In Line | 2026-02-03 |
| Scotiabank | Maintain | Sector Perform | 2026-01-14 |
| UBS | Maintain | Neutral | 2026-01-08 |
| Truist Securities | Maintain | Hold | 2025-12-17 |
| Citigroup | Maintain | Neutral | 2025-11-26 |
| Barclays | Maintain | Equal Weight | 2025-11-18 |
| Scotiabank | Maintain | Sector Perform | 2025-11-13 |
| Piper Sandler | Maintain | Overweight | 2025-11-10 |
Regency Centers Corporation Grades
This table summarizes recent institutional grading actions for Regency Centers Corporation:
| Grading Company | Action | New Grade | Date |
|---|---|---|---|
| Scotiabank | Maintain | Sector Perform | 2026-01-14 |
| Mizuho | Downgrade | Neutral | 2026-01-09 |
| UBS | Maintain | Neutral | 2026-01-08 |
| JP Morgan | Downgrade | Neutral | 2025-12-18 |
| Keybanc | Downgrade | Sector Weight | 2025-12-04 |
| Barclays | Upgrade | Overweight | 2025-11-18 |
| Truist Securities | Maintain | Buy | 2025-11-18 |
| Scotiabank | Maintain | Sector Perform | 2025-11-13 |
| Wells Fargo | Maintain | Overweight | 2025-10-21 |
| Barclays | Maintain | Equal Weight | 2025-10-06 |
Which company has the best grades?
Simon Property Group consistently receives stable grades, mostly “Overweight” and “Hold,” indicating broad institutional confidence. Regency Centers shows more volatility with several downgrades to “Neutral” but retains some “Buy” and “Overweight” ratings. Investors might view Simon Property Group’s steady grades as a sign of relative stability, while Regency Centers’ mixed grades suggest more cautious sentiment.
Risks specific to each company
The following categories pinpoint critical pressure points and systemic threats facing Simon Property Group and Regency Centers in the 2026 market environment:
1. Market & Competition
Simon Property Group, Inc.
- Faces intense competition from e-commerce and changing retail trends, pressuring foot traffic and leasing rates.
Regency Centers Corporation
- Operates in affluent, densely populated areas with strong grocer and service tenant demand, mitigating competitive threats.
2. Capital Structure & Debt
Simon Property Group, Inc.
- High debt-to-equity ratio of 5.75 and 74% debt-to-assets poses financial risk despite good interest coverage.
Regency Centers Corporation
- More conservative leverage with debt-to-equity of 0.75 and 41% debt-to-assets, lowering default risk.
3. Stock Volatility
Simon Property Group, Inc.
- Beta above 1.39 indicates higher stock volatility and sensitivity to market swings.
Regency Centers Corporation
- Beta near 0.94 suggests relative stability and lower market correlation.
4. Regulatory & Legal
Simon Property Group, Inc.
- Exposure to evolving zoning and property tax regulations across multiple global regions.
Regency Centers Corporation
- Faces regulatory risks mainly in U.S. retail real estate markets with stable compliance track record.
5. Supply Chain & Operations
Simon Property Group, Inc.
- Complex global operations add supply chain risks and operational challenges.
Regency Centers Corporation
- Focused U.S. portfolio with fewer operational complexities reduces supply chain vulnerability.
6. ESG & Climate Transition
Simon Property Group, Inc.
- Pressure to improve sustainability at large mixed-use properties affects costs and brand perception.
Regency Centers Corporation
- Emphasizes community connection and environmental responsibility, aligning better with ESG trends.
7. Geopolitical Exposure
Simon Property Group, Inc.
- Global footprint exposes it to geopolitical risks including trade tensions and currency fluctuations.
Regency Centers Corporation
- Primarily U.S.-based, limiting geopolitical risk but still vulnerable to domestic policy shifts.
Which company shows a better risk-adjusted profile?
Simon Property Group’s largest risk is its heavy leverage, which strains liquidity and heightens bankruptcy risk, as reflected in its distress-zone Altman Z-score. Regency Centers’ main concern is valuation risk, with a high P/E ratio signaling potential overvaluation. Despite Simon’s superior net margin and dividend yield, Regency’s lower debt and stock volatility position it as the better risk-adjusted choice in 2026. The recent data highlight Simon’s financial distress signals, underscoring caution despite its market stature.
Final Verdict: Which stock to choose?
Simon Property Group’s superpower lies in its robust cash generation and impressive profitability metrics. Its ability to deliver strong earnings growth and a solid dividend yield stands out. However, its heavy leverage and weak liquidity ratios remain points of vigilance. It suits investors with an appetite for aggressive growth combined with income.
Regency Centers commands a strategic moat through its stable recurring revenue streams and conservative capital structure. While its profitability lags behind Simon’s, Regency offers better financial stability and lower leverage risk. This profile aligns well with investors favoring growth at a reasonable price, balancing risk and reward.
If you prioritize high income and growth potential, Simon Property Group outshines due to its superior earnings momentum and dividend yield. However, if you seek better financial stability and a more conservative risk profile, Regency Centers offers a more balanced investment scenario. Both firms show improving profitability but caution is warranted around leverage and liquidity.
Disclaimer: Investment carries a risk of loss of initial capital. The past performance is not a reliable indicator of future results. Be sure to understand risks before making an investment decision.
Go Further
I encourage you to read the complete analyses of Simon Property Group, Inc. and Regency Centers Corporation to enhance your investment decisions: