Home > Comparison > Real Estate > SPG vs O
The strategic rivalry between Simon Property Group and Realty Income Corporation defines the current trajectory of the retail REIT sector. Simon Property Group operates as a capital-intensive owner of premier shopping and mixed-use destinations, while Realty Income specializes in a diversified portfolio of long-term leased retail properties emphasizing steady monthly dividends. This analysis will evaluate which company’s operational model offers superior risk-adjusted returns for investors seeking durable income and growth in real estate.
Table of contents
Companies Overview
Simon Property Group and Realty Income Corporation hold commanding positions in the retail REIT landscape, shaping commercial real estate dynamics.
Simon Property Group, Inc.: Premier Retail Real Estate Leader
Simon Property Group dominates as a leading retail REIT owning premier shopping, dining, and entertainment destinations. Its core revenue derives from leasing high-traffic properties across North America, Europe, and Asia. In 2026, Simon focuses strategically on enhancing mixed-use developments to boost community engagement and long-term property value.
Realty Income Corporation: The Monthly Dividend REIT
Realty Income Corporation stands out as a dependable monthly dividend payer with over 6,500 properties under long-term leases. Its cash flow stability stems from diverse commercial tenants nationwide. The company prioritizes maintaining and growing its dividend, reflecting a strategic commitment to consistent income for shareholders in 2026.
Strategic Collision: Similarities & Divergences
Both firms excel in retail property leasing but differ in scope and focus. Simon embraces a high-touch, experiential retail model with mixed-use assets, while Realty Income pursues a broad, income-driven portfolio emphasizing lease stability. Their competitive battleground lies in tenant quality and lease duration, defining distinct risk-return profiles for investors.
Income Statement Comparison
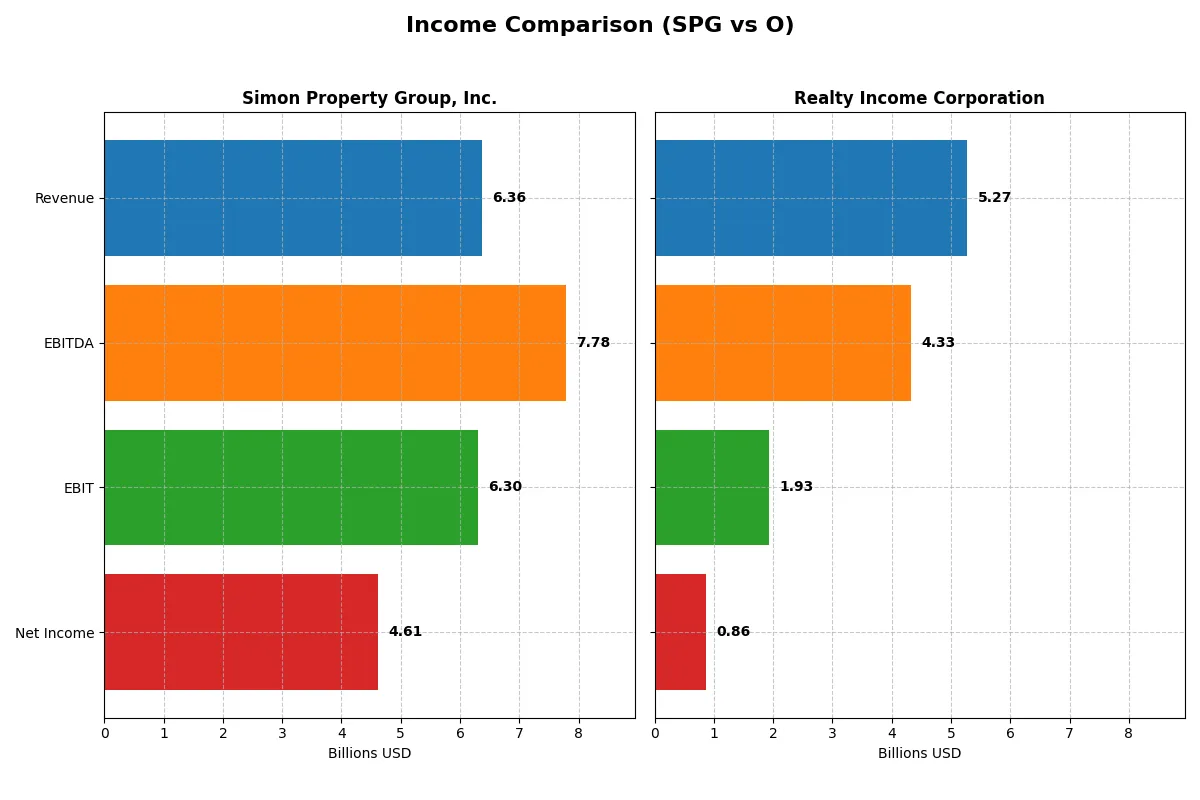
This data dissects the core profitability and scalability of both corporate engines to reveal who dominates the bottom line:
| Metric | Simon Property Group, Inc. (SPG) | Realty Income Corporation (O) |
|---|---|---|
| Revenue | 6.36B | 5.27B |
| Cost of Revenue | 909M | 378M |
| Operating Expenses | 2.28B | 2.57B |
| Gross Profit | 5.46B | 4.89B |
| EBITDA | 7.78B | 4.33B |
| EBIT | 6.30B | 1.93B |
| Interest Expense | 975M | 0 |
| Net Income | 4.61B | 861M |
| EPS | 14.14 | 0.98 |
| Fiscal Year | 2025 | 2024 |
Income Statement Analysis: The Bottom-Line Duel
This income statement comparison reveals which company operates its business engine with stronger efficiency and profitability metrics.
Simon Property Group, Inc. Analysis
Simon Property Group’s revenue rose steadily from 5.1B in 2021 to 6.4B in 2025, with net income doubling to 4.6B. Its gross margin remains robust at 85.7%, and net margin soared to 72.5%, signaling exceptional profitability. In 2025, EBIT surged 72%, reflecting strong operational momentum despite a high interest expense ratio of 15.3%.
Realty Income Corporation Analysis
Realty Income’s revenue climbed impressively by 29% from 4.1B in 2023 to 5.3B in 2024, supported by a stellar gross margin of 92.8%. However, net margin at 16.3% is far below Simon’s, constrained by significant operating expenses and a sharp EPS decline of 22% in the latest year. The company shows strong top-line growth but faces margin pressure.
Margin Strength vs. Revenue Growth
Simon Property Group leads with superior net margin and EPS growth, underpinned by efficient cost management despite higher interest costs. Realty Income outpaces in revenue growth and gross margin but suffers from deteriorating net margin and EPS. For investors prioritizing profitability and bottom-line strength, Simon Property Group presents a more attractive profile.
Financial Ratios Comparison
These vital ratios act as a diagnostic tool to expose the underlying fiscal health, valuation premiums, and capital efficiency of these companies:
| Ratios | Simon Property Group, Inc. (SPG) | Realty Income Corporation (O) |
|---|---|---|
| ROE | 88.6% | 2.2% |
| ROIC | 8.5% | 3.2% |
| P/E | 13.1 | 54.2 |
| P/B | 11.6 | 1.2 |
| Current Ratio | 0.16 | 1.68 |
| Quick Ratio | 0.16 | 1.68 |
| D/E (Debt-to-Equity) | 5.75 | 0.69 |
| Debt-to-Assets | 73.7% | 38.9% |
| Interest Coverage | 3.26 | 0 |
| Asset Turnover | 0.16 | 0.08 |
| Fixed Asset Turnover | 0.21 | 4.14 |
| Payout ratio | 60.4% | 314% |
| Dividend yield | 4.62% | 5.79% |
| Fiscal Year | 2025 | 2024 |
Efficiency & Valuation Duel: The Vital Signs
Financial ratios serve as a company’s DNA, uncovering hidden risks and operational strengths that shape investor expectations and portfolio decisions.
Simon Property Group, Inc.
Simon Property Group boasts a robust ROE of 88.6% and an impressive net margin of 72.5%, signaling strong profitability. Its P/E ratio of 13.1 suggests the stock is reasonably valued, though a high P/B ratio and low current ratio raise liquidity concerns. The firm rewards shareholders with a 4.6% dividend yield, reflecting a balanced capital allocation approach.
Realty Income Corporation
Realty Income operates with modest profitability, reflected in a 2.2% ROE and a 16.3% net margin, while sporting a stretched P/E ratio of 54.2. Its solid liquidity ratios and low debt-to-equity ratio underpin financial stability. The company offers a 5.8% dividend yield, highlighting its focus on returning cash to investors despite lower operational returns.
Premium Valuation vs. Operational Safety
Simon Property Group delivers superior profitability and a fair valuation but carries liquidity and leverage risks. Realty Income presents financial prudence and reliable dividends but trades at a premium with lower returns. Investors seeking growth may prefer Simon’s profile; those prioritizing stability might lean toward Realty Income.
Which one offers the Superior Shareholder Reward?
I compared Simon Property Group (SPG) and Realty Income Corporation (O) on dividends and buybacks. SPG yields ~4.6% with a payout ratio around 60%, supported by modest buybacks. O offers a slightly higher yield near 5.8%, but pays out over 200% of earnings, relying heavily on financial leverage and minimal buybacks. SPG’s lower payout ratio and balanced capital allocation signal more sustainable distributions. O’s aggressive payout and high P/E near 54 raise risk amid slower growth. I conclude SPG delivers a superior, more sustainable total return profile for 2026 investors.
Comparative Score Analysis: The Strategic Profile
The radar chart reveals the fundamental DNA and trade-offs of Simon Property Group, Inc. and Realty Income Corporation:
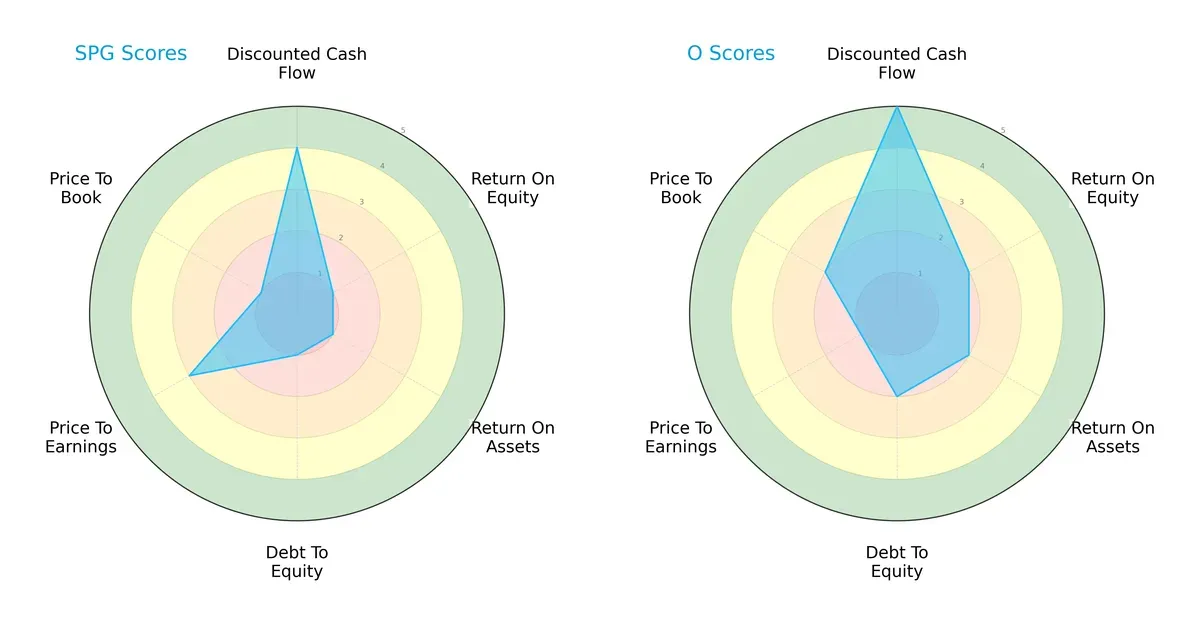
Simon Property Group (SPG) shows a favorable discounted cash flow (DCF) score but struggles with return on equity (ROE), return on assets (ROA), and debt-to-equity ratios. Realty Income (O) excels with a very favorable DCF and stronger operational returns (ROE, ROA), indicating better asset efficiency and financial stability. SPG relies heavily on its valuation edge (moderate P/E), while O presents a more balanced profile across financial and leverage metrics.
Bankruptcy Risk: Solvency Showdown
The Altman Z-Scores for both firms fall in the distress zone, signaling elevated bankruptcy risk in this cycle:
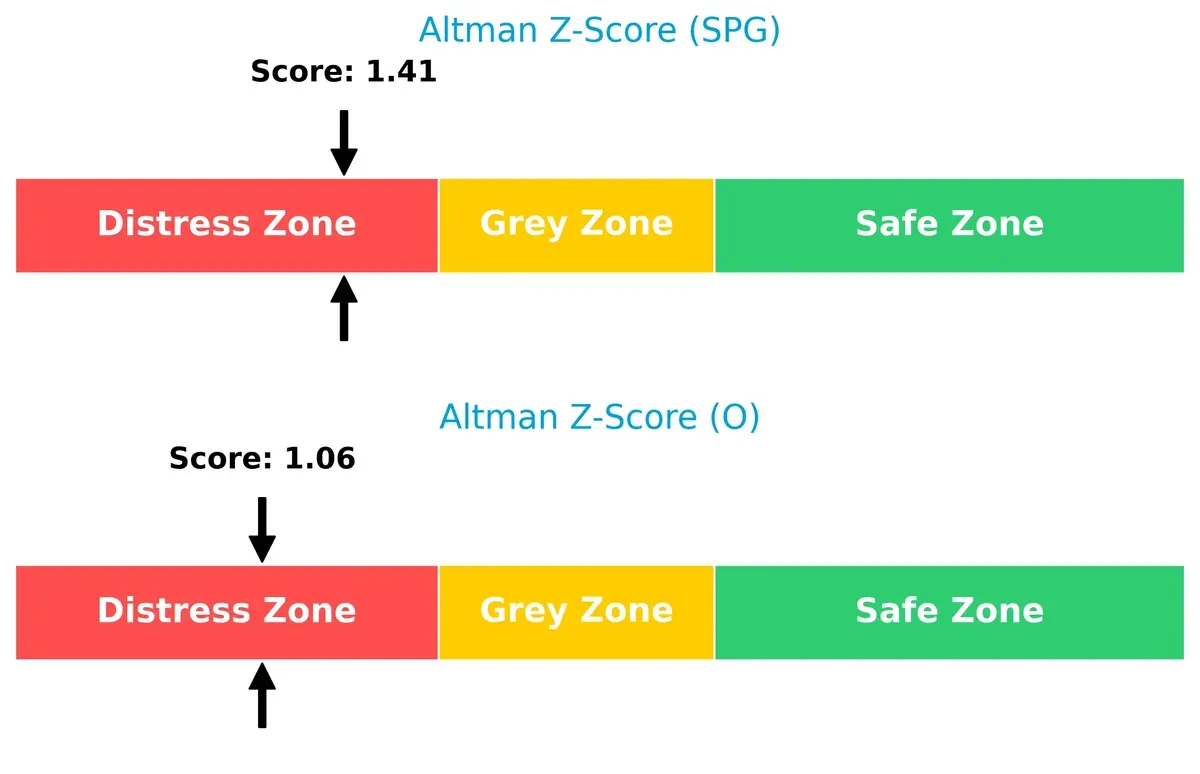
SPG’s Z-score of 1.41 slightly outperforms O’s 1.06, but both are well below the safe threshold of 3. This suggests both companies face significant financial stress, highlighting caution for long-term investors in the current economic environment.
Financial Health: Quality of Operations
Simon Property Group leads with a Piotroski F-Score of 7, indicating strong financial health, while Realty Income scores 5, signaling average operational quality:
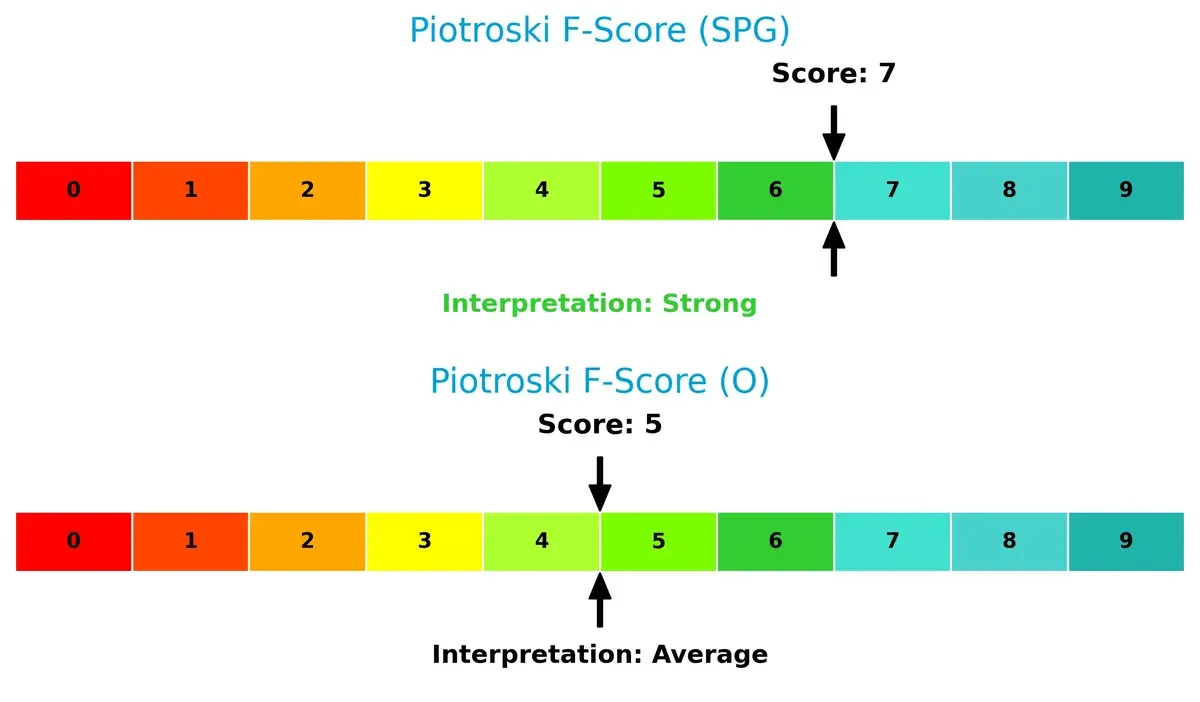
SPG’s higher score reflects better profitability, leverage, and liquidity management. Conversely, O’s lower score raises red flags about internal financial controls and operational efficiency relative to SPG, a critical factor for risk-conscious investors.
How are the two companies positioned?
This section dissects the operational DNA of SPG and O by comparing revenue distribution and internal strengths and weaknesses. The goal is to confront their economic moats and identify which model offers the most resilient competitive advantage today.
Revenue Segmentation: The Strategic Mix
The following comparison dissects how Simon Property Group and Realty Income diversify their income streams and where their primary sector bets lie:
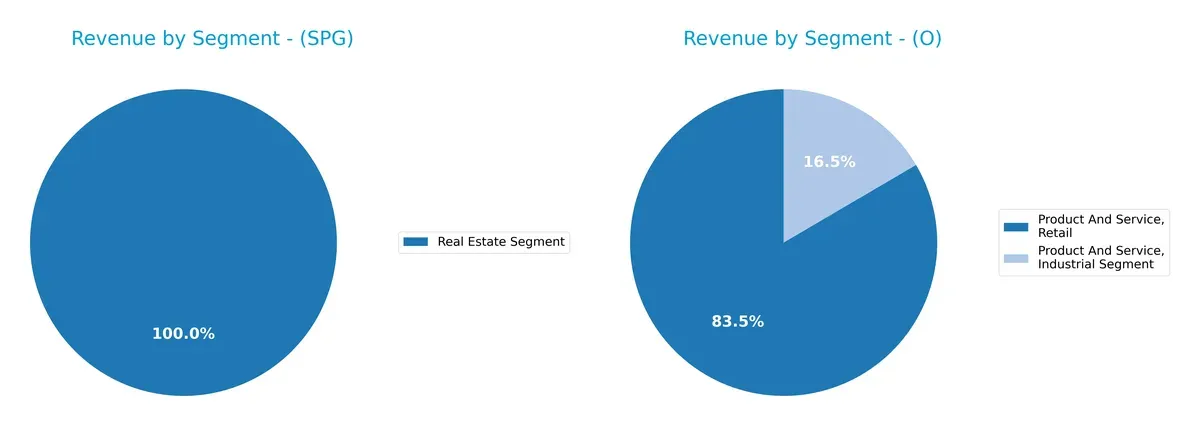
Simon Property Group anchors its $5.54B revenue almost entirely in the Real Estate segment, showing a concentrated portfolio. Realty Income, however, diversifies with $4B from Retail and $795M from Industrial segments, spreading risk across sectors. SPG’s focus suggests dominance in property infrastructure, while Realty Income’s mix reduces concentration risk and taps multiple retail market niches. Their strategies reflect different bets on ecosystem lock-in versus sector diversification.
Strengths and Weaknesses Comparison
This table compares the strengths and weaknesses of Simon Property Group (SPG) and Realty Income Corporation (O):
SPG Strengths
- High net margin of 72.51%
- Strong ROE at 88.61%
- Favorable PE of 13.08
- Solid dividend yield of 4.62%
- Significant European presence with stable revenue
- Large real estate segment revenue of 5.54B USD
O Strengths
- Diversified revenue across industrial and retail segments
- Favorable current/quick ratios at 1.68
- Low debt-to-equity at 0.69
- Favorable fixed asset turnover of 4.14
- Significant US and UK geographic diversification
- Favorable PB ratio of 1.2
SPG Weaknesses
- Low current and quick ratios at 0.16 signal liquidity risk
- High debt-to-assets at 73.74% indicates leverage concerns
- Unfavorable PB at 11.59 suggests valuation premium
- Low asset turnover of 0.16
- Debt-to-equity at 5.75 is high
- Neutral ROIC barely above WACC at 8.55%
O Weaknesses
- Low ROE of 2.22% and ROIC of 3.19%
- High PE ratio of 54.18 reflects expensive valuation
- Lower net margin at 16.33%
- Unfavorable asset turnover at 0.08
- Dividend yield neutral at 5.79%
Overall, SPG demonstrates strong profitability and stable European market exposure but carries significant leverage and liquidity risks. O shows better liquidity and asset efficiency with geographic and segment diversification but faces challenges in profitability and valuation metrics. These contrasts highlight differing strategic and financial profiles.
The Moat Duel: Analyzing Competitive Defensibility
A structural moat is the only defense protecting long-term profits from relentless competition erosion. Let’s dissect the nature of these moats:
Simon Property Group, Inc.: Premier Destination Moat
Simon Property’s moat stems from its premier retail properties and strong brand appeal. It delivers high ROIC with improving profitability, supported by a 15.6% ROIC growth trend. Expansion into mixed-use and international markets in 2026 could deepen this advantage.
Realty Income Corporation: Diversified Lease Stability Moat
Realty Income’s moat relies on a vast portfolio of long-term leases across 6,500+ properties, creating cash flow predictability. However, ROIC trends decline sharply, signaling profit pressure. The firm’s opportunity lies in geographic expansion and tenant diversification to stabilize returns.
Moat Strength: Premier Destinations vs. Lease Portfolio Resilience
Simon Property’s slightly favorable moat beats Realty Income’s very unfavorable moat, thanks to rising ROIC and margin expansion. I see Simon better positioned to defend and grow market share amid retail sector shifts in 2026.
Which stock offers better returns?
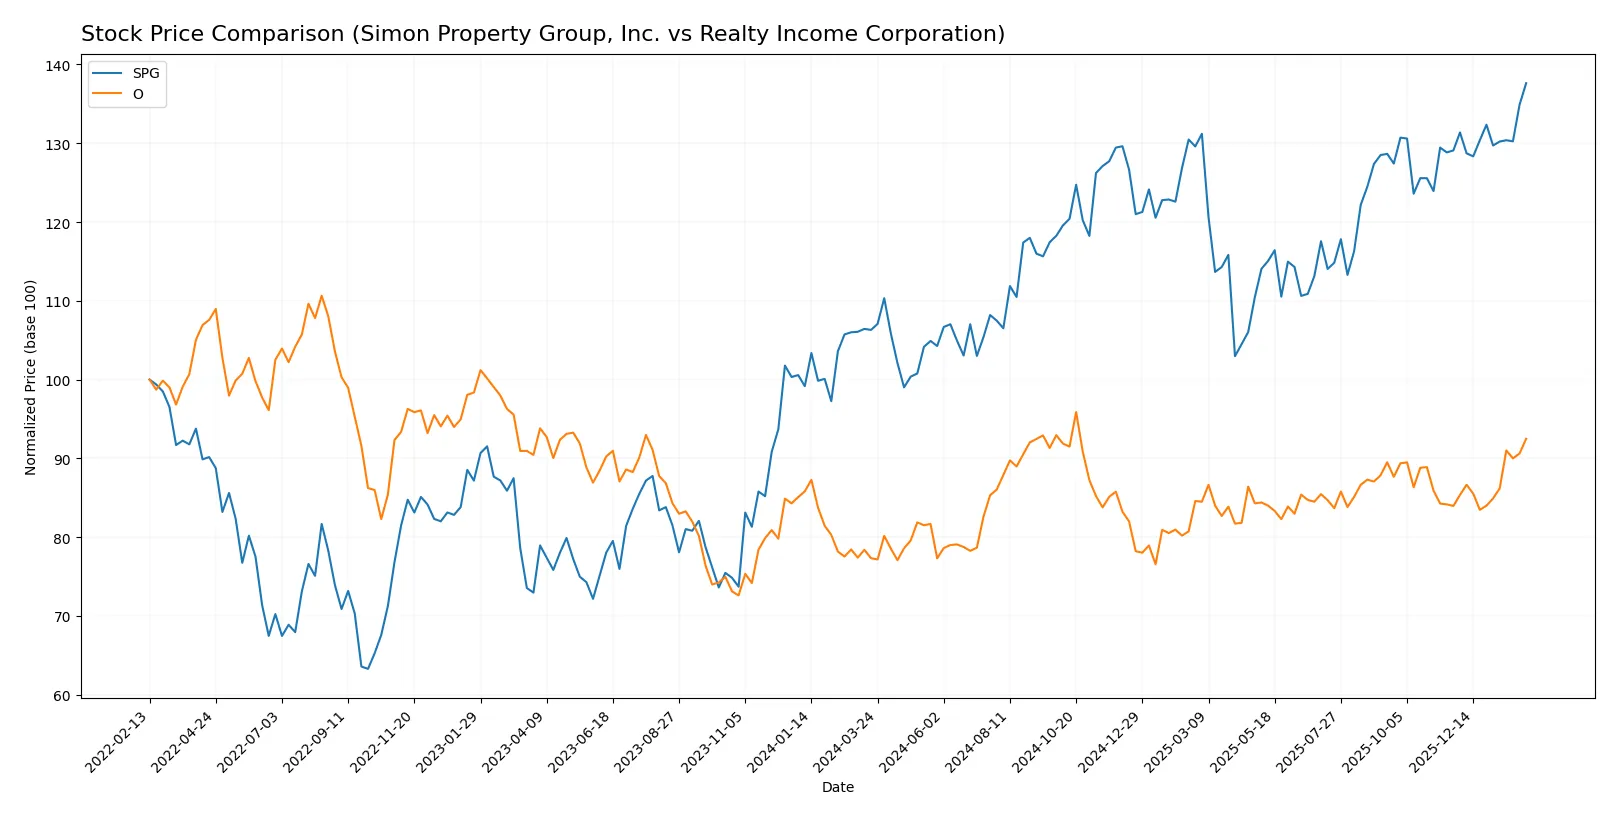
The past year shows strong upward price movements for both stocks, with Simon Property Group accelerating its gains more sharply than Realty Income Corporation.
Trend Comparison
Simon Property Group’s stock rose 29.47% over the past 12 months, signaling a bullish trend with accelerating momentum and notable volatility (std dev 13.77). The price peaked at 195.19 and bottomed at 140.44.
Realty Income’s stock increased 19.6% over the same period, also bullish with acceleration. It experienced lower volatility (std dev 2.93), reaching a high of 64.71 and a low of 51.67.
Simon Property Group outperformed Realty Income, delivering the highest market return and stronger acceleration despite higher volatility.
Target Prices
Analysts present a clear consensus on target prices for Simon Property Group, Inc. and Realty Income Corporation.
| Company | Target Low | Target High | Consensus |
|---|---|---|---|
| Simon Property Group, Inc. | 173 | 230 | 194.6 |
| Realty Income Corporation | 60 | 69 | 63.38 |
The consensus target for Simon Property Group aligns closely with its current price of $194.97, indicating limited upside. Realty Income’s target consensus suggests a modest 1.6% potential gain from its $62.42 price.

Don’t Let Luck Decide Your Entry Point
Optimize your entry points with our advanced ProRealTime indicators. You’ll get efficient buy signals with precise price targets for maximum performance. Start outperforming now!
How do institutions grade them?
Simon Property Group, Inc. Grades
Here are the latest institutional grades for Simon Property Group, Inc.:
| Grading Company | Action | New Grade | Date |
|---|---|---|---|
| Evercore ISI Group | maintain | In Line | 2026-02-03 |
| Piper Sandler | maintain | Overweight | 2026-02-03 |
| Stifel | maintain | Hold | 2026-02-03 |
| Scotiabank | maintain | Sector Perform | 2026-01-14 |
| UBS | maintain | Neutral | 2026-01-08 |
| Truist Securities | maintain | Hold | 2025-12-17 |
| Citigroup | maintain | Neutral | 2025-11-26 |
| Barclays | maintain | Equal Weight | 2025-11-18 |
| Scotiabank | maintain | Sector Perform | 2025-11-13 |
| Piper Sandler | maintain | Overweight | 2025-11-10 |
Realty Income Corporation Grades
Here are the latest institutional grades for Realty Income Corporation:
| Grading Company | Action | New Grade | Date |
|---|---|---|---|
| Scotiabank | upgrade | Sector Outperform | 2026-02-02 |
| Morgan Stanley | maintain | Equal Weight | 2025-12-24 |
| JP Morgan | downgrade | Underweight | 2025-12-18 |
| Mizuho | maintain | Neutral | 2025-12-17 |
| Barclays | maintain | Equal Weight | 2025-12-03 |
| Wells Fargo | maintain | Equal Weight | 2025-11-25 |
| Cantor Fitzgerald | maintain | Neutral | 2025-11-06 |
| RBC Capital | maintain | Outperform | 2025-11-04 |
| Barclays | maintain | Equal Weight | 2025-10-20 |
| Mizuho | maintain | Neutral | 2025-09-11 |
Which company has the best grades?
Realty Income Corporation shows a recent upgrade to Sector Outperform, while Simon Property Group’s grades remain steady but less bullish. This may influence investor sentiment toward Realty Income’s perceived growth potential.
Risks specific to each company
The following categories identify the critical pressure points and systemic threats facing both firms in the 2026 market environment:
1. Market & Competition
Simon Property Group, Inc. (SPG)
- Faces intense retail sector disruption amid e-commerce growth; premium properties retain strong foot traffic.
Realty Income Corporation (O)
- Benefits from diversified tenant base with long-term leases, but faces pressure from rising competition in retail REIT space.
2. Capital Structure & Debt
Simon Property Group, Inc. (SPG)
- High leverage with debt-to-assets at 74% signals elevated financial risk; interest coverage remains adequate.
Realty Income Corporation (O)
- Moderate leverage with 39% debt-to-assets and strong interest coverage, reflecting prudent capital management.
3. Stock Volatility
Simon Property Group, Inc. (SPG)
- Beta of 1.40 indicates above-market volatility, increasing risk during economic downturns.
Realty Income Corporation (O)
- Beta of 0.80 demonstrates lower volatility, offering more stable price movements relative to the market.
4. Regulatory & Legal
Simon Property Group, Inc. (SPG)
- Exposure to evolving zoning laws and retail property regulations in multiple jurisdictions.
Realty Income Corporation (O)
- Faces regulatory risks primarily in commercial leasing and property management compliance.
5. Supply Chain & Operations
Simon Property Group, Inc. (SPG)
- Operational risks tied to managing large, complex retail hubs with diverse tenants.
Realty Income Corporation (O)
- Dependent on maintaining long-term lease agreements; asset management is streamlined but sensitive to tenant defaults.
6. ESG & Climate Transition
Simon Property Group, Inc. (SPG)
- Must invest heavily in climate resilience for large retail centers, facing higher transition costs.
Realty Income Corporation (O)
- Focuses on sustainable property management but faces moderate risks from climate change impacts on real estate.
7. Geopolitical Exposure
Simon Property Group, Inc. (SPG)
- Global footprint exposes SPG to geopolitical tensions, especially in Europe and Asia markets.
Realty Income Corporation (O)
- Primarily US-focused, limiting geopolitical risk but exposed to domestic policy shifts.
Which company shows a better risk-adjusted profile?
Simon Property Group’s highest risk stems from its heavy debt load, which threatens financial flexibility and resilience. Realty Income’s main concern is its valuation premium, reflected in a high P/E ratio, which compresses future return potential. Overall, Realty Income presents a better risk-adjusted profile supported by moderate leverage, lower volatility, and strong credit metrics. Notably, Simon’s low current ratio (0.16) signals potential liquidity constraints, intensifying caution in volatile markets.
Final Verdict: Which stock to choose?
Simon Property Group (SPG) stands out for its remarkable ability to convert invested capital into growing profitability, demonstrating a rising ROIC trend that hints at emerging competitive strength. Its Achilles’ heel lies in a stretched balance sheet and liquidity constraints, demanding vigilance. This stock could suit aggressive growth investors willing to navigate financial leverage for potential upside.
Realty Income (O) offers a strategic moat through its consistent cash flow generation and a solid safety profile, supported by a stronger liquidity position and moderate leverage. However, its declining profitability and value destruction signals caution. This choice aligns better with investors seeking GARP—growth at a reasonable price—favoring stability over rapid expansion.
If you prioritize dynamic value creation and can tolerate balance sheet risks, SPG outshines with an improving moat and strong income growth. However, if your focus is on financial stability and recurring income with moderate growth, Realty Income offers better stability despite weaker profitability trends. Each fits distinct investor profiles, reflecting different risk tolerances and return expectations.
Disclaimer: Investment carries a risk of loss of initial capital. The past performance is not a reliable indicator of future results. Be sure to understand risks before making an investment decision.
Go Further
I encourage you to read the complete analyses of Simon Property Group, Inc. and Realty Income Corporation to enhance your investment decisions: