In the evolving landscape of retail real estate investment trusts (REITs), Realty Income Corporation and Regency Centers Corporation stand out as dominant players with overlapping market focus. Both companies specialize in retail properties, leveraging long-term leases and strategic location choices to drive stable income and growth. This article will dissect their business models, financial health, and innovation strategies to help you decide which company deserves a place in your investment portfolio.
Table of contents
Companies Overview
I will begin the comparison between Realty Income Corporation and Regency Centers Corporation by providing an overview of these two companies and their main differences.
Realty Income Corporation Overview
Realty Income Corporation, known as The Monthly Dividend Company, is an S&P 500 REIT focused on delivering reliable monthly income to stockholders. The company owns over 6,500 real estate properties leased long-term to commercial clients. With a 52-year operating history, Realty Income has declared 608 consecutive monthly dividends and increased its dividend 109 times since its 1994 public listing.
Regency Centers Corporation Overview
Regency Centers Corporation is a national owner, operator, and developer of shopping centers in affluent, densely populated areas. This fully integrated REIT is self-administered and self-managed, featuring a portfolio of thriving properties anchored by grocers, restaurants, and top retailers. Regency is also a member of the S&P 500 Index, emphasizing its prominence in the retail real estate sector.
Key similarities and differences
Both Realty Income and Regency Centers operate as retail-focused REITs and are members of the S&P 500, emphasizing stable real estate income generation. Realty Income specializes in monthly dividend reliability supported by a broad property base, while Regency focuses on shopping centers in affluent neighborhoods with a fully integrated management approach. Market cap and dividend yield also differ, with Realty Income being larger and emphasizing dividend consistency.
Income Statement Comparison
This table presents a side-by-side comparison of key income statement metrics for Realty Income Corporation and Regency Centers Corporation for the fiscal year 2024.
| Metric | Realty Income Corporation | Regency Centers Corporation |
|---|---|---|
| Market Cap | 53.6B | 12.8B |
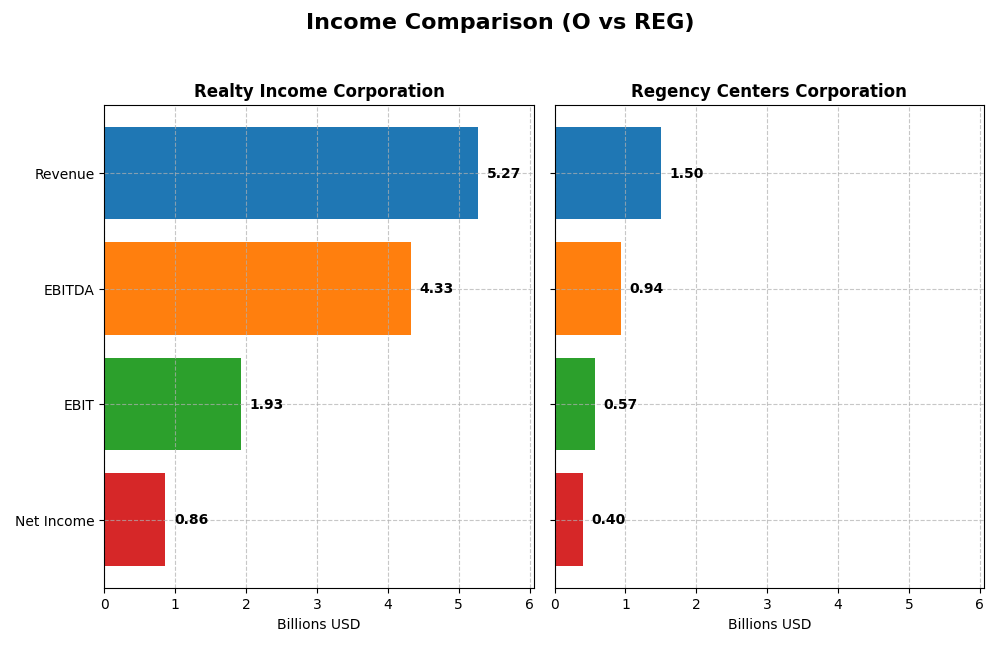
| Revenue | 5.27B | 1.50B |
| EBITDA | 4.33B | 940M |
| EBIT | 1.93B | 568M |
| Net Income | 848M | 387M |
| EPS | 0.98 | 2.11 |
| Fiscal Year | 2024 | 2024 |
Income Statement Interpretations
Realty Income Corporation
Realty Income’s revenue increased significantly from 2020 to 2024, reaching $5.27B in 2024, supported by a strong gross margin of 92.84%. Net income more than doubled over the period, although net margin declined by nearly 32%. In 2024, revenue growth accelerated by 29.23%, but net margin and EPS fell by about 23%, indicating margin pressure despite top-line gains.
Regency Centers Corporation
Regency Centers showed steady revenue growth, reaching $1.5B in 2024 with a gross margin of 71.19%. Net income surged by nearly 8-fold over the period, accompanied by a robust net margin increase of over 500%. In 2024, revenue and EBIT both grew close to 10%, while net margin remained stable and EPS increased by 3.43%, reflecting consistent margin improvement and operational efficiency.
Which one has the stronger fundamentals?
Both companies present favorable income statement trends, but Regency Centers exhibits stronger overall margin growth and more consistent EPS expansion. Realty Income benefits from higher gross margins and revenue growth but faces declining net margins and EPS recently. Regency’s lower interest expense ratio versus Realty Income’s zero shows differing capital costs, yet Regency’s margin expansion and net income growth offer stronger fundamentals based on income statement metrics.
Financial Ratios Comparison
The table below presents a side-by-side comparison of key financial ratios for Realty Income Corporation (O) and Regency Centers Corporation (REG) based on their latest fiscal year 2024 data.
| Ratios | Realty Income Corporation (O) | Regency Centers Corporation (REG) |
|---|---|---|
| ROE | 2.22% | 5.95% |
| ROIC | 3.19% | 7.98% |
| P/E | 54.18 | 35.04 |
| P/B | 1.20 | 2.09 |
| Current Ratio | 1.68 | 0.73 |
| Quick Ratio | 1.68 | 0.73 |
| D/E (Debt-to-Equity) | 0.69 | 0.75 |
| Debt-to-Assets | 38.9% | 40.5% |
| Interest Coverage | 2.33 | 5.13 |
| Asset Turnover | 0.077 | 0.121 |
| Fixed Asset Turnover | 4.14 | 4.55 |
| Payout ratio | 314% | 126% |
| Dividend yield | 5.79% | 3.59% |
Interpretation of the Ratios
Realty Income Corporation
Realty Income shows a balanced financial profile with favorable net margin (16.33%) and WACC (6.16%), supported by strong liquidity ratios (current and quick ratios at 1.68). However, low returns on equity (2.22%) and invested capital (3.19%), combined with a high PE ratio (54.18), are points of concern. The dividend yield of 5.79% is neutral, reflecting stable monthly payouts backed by consistent cash flow from its extensive property portfolio.
Regency Centers Corporation
Regency Centers exhibits a higher net margin (26.63%) and ROIC (7.98%) than Realty Income but struggles with weaker liquidity (current and quick ratios at 0.73). Its interest coverage ratio at 3.0 and moderate PE ratio (35.04) suggest some financial constraints. Dividend yield of 3.59% is favorable, supported by steady earnings, though overall ratio assessments show more unfavorable and neutral indicators than Realty Income.
Which one has the best ratios?
Realty Income’s ratios are slightly more favorable due to stronger liquidity, a better interest coverage ratio, and balanced leverage metrics. Regency Centers, despite superior profitability margins, faces challenges with liquidity and interest coverage, resulting in a slightly unfavorable global ratios opinion. Overall, Realty Income displays a more stable and cautiously managed financial profile based on these ratios.
Strategic Positioning
This section compares the strategic positioning of Realty Income Corporation and Regency Centers Corporation based on market position, key segments, and exposure to technological disruption:
Realty Income Corporation (O)
- Leading retail REIT with larger market cap and moderate beta.
- Focus on retail and industrial leases, driven by diversified tenants.
- Limited explicit exposure to technological disruption noted.
Regency Centers Corporation (REG)
- National shopping center owner in affluent, dense markets.
- Concentrated on retail with grocers, restaurants, and service providers.
- No direct mention of technological disruption exposure.
Realty Income Corporation vs Regency Centers Corporation Positioning
Realty Income exhibits a more diversified tenant base across retail and industrial segments with a significantly larger market cap. Regency Centers concentrates on upscale shopping centers in affluent areas with strong retail anchors, implying focused operational strategy but smaller scale.
Which has the best competitive advantage?
Based on MOAT evaluation, Regency Centers shows a slightly favorable moat with growing ROIC, indicating improving profitability. Realty Income has a very unfavorable moat with declining ROIC, suggesting value destruction and weaker competitive advantage.
Stock Comparison
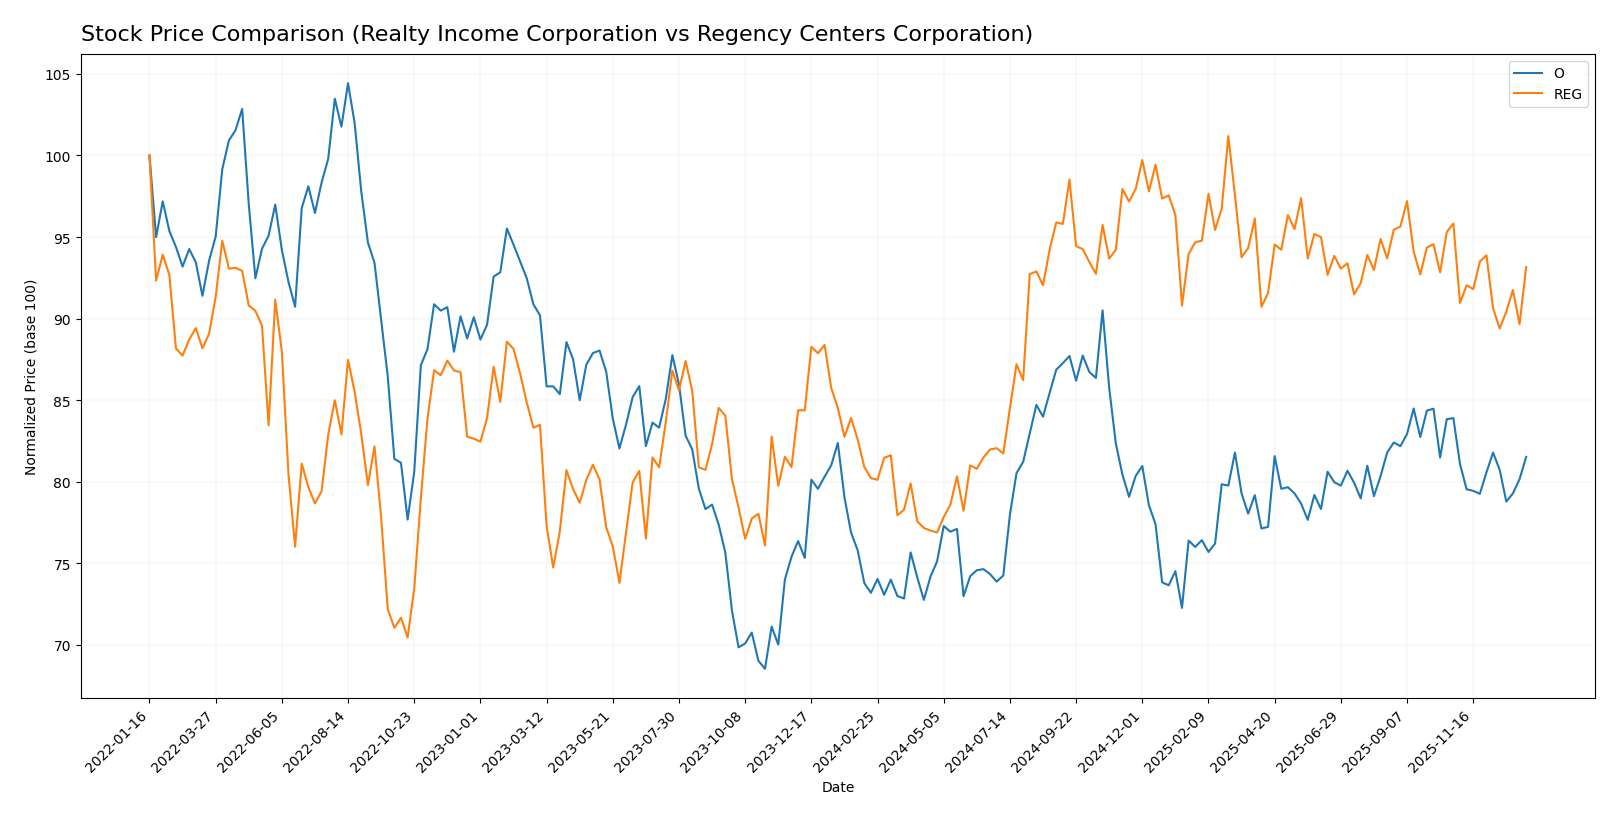
The stock prices of Realty Income Corporation and Regency Centers Corporation have shown notable bullish trends over the past 12 months, with recent short-term declines indicating a slight reversal in trading momentum.
Trend Analysis
Realty Income Corporation’s stock experienced an 11.39% price increase over the past year, indicating a bullish trend with decelerating momentum. It reached a high of 64.71 and a low of 51.67, with moderate volatility (std deviation 2.92). Recent weeks show a -2.83% decline.
Regency Centers Corporation’s stock price rose 16.13% over the same period, also reflecting a bullish but decelerating trend. The stock’s volatility is higher (std deviation 4.92), with prices ranging from 58.28 to 76.7. The recent short-term trend dropped by -2.78%.
Comparing both, Regency Centers Corporation delivered the highest market performance over the past year with a 16.13% gain versus Realty Income’s 11.39%, despite both showing recent slight downward corrections.
Target Prices
The target price consensus for Realty Income Corporation and Regency Centers Corporation indicates positive analyst expectations.
| Company | Target High | Target Low | Consensus |
|---|---|---|---|
| Realty Income Corporation | 65 | 60 | 61.57 |
| Regency Centers Corporation | 85 | 75 | 80.14 |
Analysts expect both stocks to rise moderately, with consensus targets above current prices of 58.29 for Realty Income and 70.62 for Regency Centers, suggesting potential upside.
Analyst Opinions Comparison
This section compares analysts’ ratings and grades for Realty Income Corporation (O) and Regency Centers Corporation (REG):
Rating Comparison
O Rating
- Rated B- with a very favorable overall evaluation.
- Discounted Cash Flow Score of 5, indicating very favorable future cash flow projections.
- Return on Equity Score of 2, reflecting moderate efficiency in generating profit from equity.
- Return on Assets Score of 2, indicating moderate effectiveness in asset utilization.
- Debt to Equity Score of 2, signaling moderate financial risk with balanced debt levels.
- Overall Score of 2, classified as moderate strength.
REG Rating
- Rated B with a very favorable overall evaluation.
- Discounted Cash Flow Score of 5, also very favorable for future cash flow.
- Return on Equity Score of 3, showing moderate but superior efficiency compared to O.
- Return on Assets Score of 4, a favorable rating highlighting better asset use.
- Debt to Equity Score of 2, similarly moderate financial risk assessment.
- Overall Score of 3, suggesting a stronger moderate financial standing.
Which one is the best rated?
Based strictly on the data, REG holds a higher overall score (3 vs. 2) and better return on equity and assets scores, indicating a superior rating compared to O. Both share the same discounted cash flow and debt to equity scores.
Scores Comparison
Here is a comparison of the financial scores for Realty Income Corporation and Regency Centers Corporation:
O Scores
- Altman Z-Score: 0.95, indicating financial distress zone, high bankruptcy risk.
- Piotroski Score: 5, reflecting average financial strength.
REG Scores
- Altman Z-Score: 1.28, also in the distress zone, suggesting financial risk.
- Piotroski Score: 5, showing average financial strength as well.
Which company has the best scores?
Both Realty Income and Regency Centers are in the financial distress zone based on their Altman Z-Scores, with Regency slightly higher but still risky. Their Piotroski Scores are identical at 5, indicating average financial health for both companies.
Grades Comparison
This section compares the latest available grades from recognized financial institutions for Realty Income Corporation and Regency Centers Corporation:
Realty Income Corporation Grades
The table below shows recent grades assigned by major financial firms to Realty Income Corporation:
| Grading Company | Action | New Grade | Date |
|---|---|---|---|
| Morgan Stanley | Maintain | Equal Weight | 2025-12-24 |
| JP Morgan | Downgrade | Underweight | 2025-12-18 |
| Mizuho | Maintain | Neutral | 2025-12-17 |
| Barclays | Maintain | Equal Weight | 2025-12-03 |
| Wells Fargo | Maintain | Equal Weight | 2025-11-25 |
| Cantor Fitzgerald | Maintain | Neutral | 2025-11-06 |
| RBC Capital | Maintain | Outperform | 2025-11-04 |
| Barclays | Maintain | Equal Weight | 2025-10-20 |
| Mizuho | Maintain | Neutral | 2025-09-11 |
| Scotiabank | Maintain | Sector Perform | 2025-08-28 |
Overall, grades for Realty Income Corporation predominantly indicate a neutral to hold stance, with a recent downgrade by JP Morgan reflecting some caution.
Regency Centers Corporation Grades
Below is a summary table of recent grades by recognized firms for Regency Centers Corporation:
| Grading Company | Action | New Grade | Date |
|---|---|---|---|
| JP Morgan | Downgrade | Neutral | 2025-12-18 |
| Keybanc | Downgrade | Sector Weight | 2025-12-04 |
| Truist Securities | Maintain | Buy | 2025-11-18 |
| Barclays | Upgrade | Overweight | 2025-11-18 |
| Scotiabank | Maintain | Sector Perform | 2025-11-13 |
| Wells Fargo | Maintain | Overweight | 2025-10-21 |
| Barclays | Maintain | Equal Weight | 2025-10-06 |
| Evercore ISI Group | Maintain | In Line | 2025-09-15 |
| Scotiabank | Maintain | Sector Perform | 2025-08-28 |
| Wells Fargo | Maintain | Overweight | 2025-08-27 |
Regency Centers Corporation shows a more favorable rating mix with several overweight and buy ratings, despite some recent downgrades.
Which company has the best grades?
Regency Centers Corporation has received generally better grades than Realty Income Corporation, featuring more buy and overweight recommendations. This difference may influence investors seeking stronger growth potential or more positive outlooks.
Strengths and Weaknesses
Below is a comparative summary of key strengths and weaknesses for Realty Income Corporation (O) and Regency Centers Corporation (REG) based on the latest financial and strategic data.
| Criterion | Realty Income Corporation (O) | Regency Centers Corporation (REG) |
|---|---|---|
| Diversification | High product and geographic diversification, strong retail segment dominance with growing industrial exposure. | More focused on property management and leasing services, less product diversification. |
| Profitability | Moderate net margin (16.3%), but low ROIC (3.2%) below WACC, indicating value destruction. | Higher net margin (26.6%) and ROIC (7.98%) above WACC, showing improving profitability. |
| Innovation | Limited indications of innovation; traditional REIT model. | Some innovation in property management services and fee structures. |
| Global presence | Primarily US and UK markets with steady expansion. | Mostly US-based with no significant international presence. |
| Market Share | Large presence in retail real estate with $4B+ retail revenue; strong fixed asset turnover. | Focused niche player with growing asset management services and leasing fees. |
Key takeaways: Realty Income offers strong diversification and a solid retail footprint but struggles with profitability and competitive advantage. Regency Centers shows improving profitability and operational focus but is less diversified and more US-centric. Investors should weigh diversification against profitability trends when choosing between the two.
Risk Analysis
Below is a comparative table highlighting key risks for Realty Income Corporation (O) and Regency Centers Corporation (REG) as of 2024:
| Metric | Realty Income Corporation (O) | Regency Centers Corporation (REG) |
|---|---|---|
| Market Risk | Moderate (Beta 0.81) | Moderate to higher (Beta 0.95) |
| Debt level | Neutral (D/E 0.69, 39% debt to assets) | Neutral (D/E 0.75, 41% debt to assets) |
| Regulatory Risk | Moderate – REIT compliance and real estate regulations | Moderate – Similar REIT regulatory exposure |
| Operational Risk | Low – Stable cash flow from 6,500+ leases | Moderate – Sensitivity to tenant performance in affluent trade areas |
| Environmental Risk | Low – Standard real estate environmental exposures | Low – Similar real estate environmental risks |
| Geopolitical Risk | Low – US-focused operations | Low – US-focused operations |
Both companies face typical market risks inherent to REITs, with Regency Centers showing slightly higher market sensitivity due to its beta. Debt levels are manageable but warrant monitoring. Operational risk for Realty Income is mitigated by diversified leases, while Regency’s tenant concentration in affluent areas may pose moderate risk if economic conditions deteriorate. Both remain exposed to regulatory changes impacting REITs but currently show no significant red flags. Notably, both firms’ Altman Z-Scores indicate distress zone levels, signaling caution on financial stability.
Which Stock to Choose?
Realty Income Corporation (O) shows strong income growth with a 220% revenue increase over five years, favorable gross and EBIT margins, but declining net margin and EPS. Financial ratios are slightly favorable, with good liquidity and moderate debt levels, yet a low ROE and ROIC. The company has a very favorable rating but faces value destruction as ROIC underperforms WACC with a negative trend.
Regency Centers Corporation (REG) presents moderate income growth, with 43% revenue rise and strong net margin improvement. Its financial ratios are slightly unfavorable overall, marked by weaker liquidity but decent profitability and moderate leverage. REG holds a very favorable rating and displays a slightly favorable moat status, with ROIC exceeding WACC and an improving profitability trend.
Investors focused on growth might find Realty Income’s robust revenue expansion and strong income statement favorable, despite its declining profitability metrics and value destruction signals. Conversely, those prioritizing improving profitability and a slightly favorable moat may view Regency Centers’ stable income growth and improving returns as more appealing. Both companies show bullish stock trends with recent deceleration, adding complexity to timing considerations.
Disclaimer: Investment carries a risk of loss of initial capital. The past performance is not a reliable indicator of future results. Be sure to understand risks before making an investment decision.
Go Further
I encourage you to read the complete analyses of Realty Income Corporation and Regency Centers Corporation to enhance your investment decisions: