Home > Comparison > Financial Services > GS vs RJF
The strategic rivalry between The Goldman Sachs Group, Inc. and Raymond James Financial, Inc. shapes the financial services sector’s competitive landscape. Goldman Sachs operates as a global investment banking powerhouse with diversified capital markets and asset management segments. In contrast, Raymond James focuses on diversified financial services with a strong private client and banking emphasis. This analysis evaluates which business model offers superior risk-adjusted returns for a diversified portfolio amid evolving market dynamics.

Table of contents
Companies Overview
The Goldman Sachs Group, Inc. and Raymond James Financial, Inc. dominate key niches in financial services, shaping capital markets in distinct ways.
The Goldman Sachs Group, Inc.: Global Financial Powerhouse
Goldman Sachs leads as a premier financial institution with a broad footprint in investment banking, global markets, asset management, and consumer wealth management. Its core revenue derives from advisory services, underwriting, trading, and managing diverse assets. In 2026, the firm focuses strategically on expanding its consumer and wealth management segments to diversify beyond traditional capital markets dominance.
Raymond James Financial, Inc.: Diversified Financial Services Leader
Raymond James serves individuals and institutions with a diversified financial services platform emphasizing private client investment, capital markets, asset management, and banking. Revenue flows from portfolio management, underwriting, brokerage, and loan services. The company prioritizes enhancing its private client group and expanding banking capabilities to deepen client relationships and grow fee-based income.
Strategic Collision: Similarities & Divergences
Both firms excel in capital markets and asset management, yet Goldman Sachs pursues a global, high-touch advisory model while Raymond James emphasizes a client-centric, diversified service approach. Their primary battleground is wealth management and retail banking, where scale and customization collide. Investors face distinct profiles: Goldman Sachs offers scale and market leadership; Raymond James provides stable, client-focused growth.
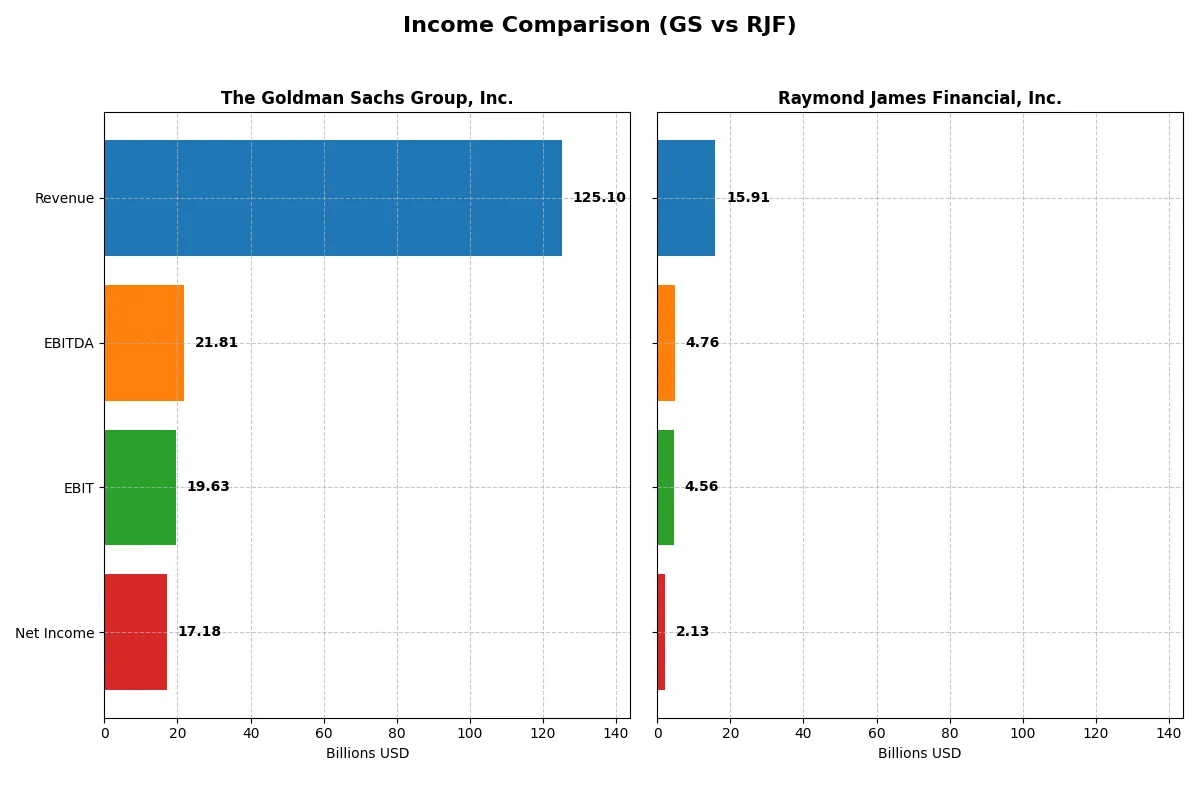
Income Statement Comparison
The following data dissects the core profitability and scalability of both corporate engines to reveal who dominates the bottom line:
| Metric | The Goldman Sachs Group, Inc. (GS) | Raymond James Financial, Inc. (RJF) |
|---|---|---|
| Revenue | 125.1B | 15.9B |
| Cost of Revenue | 67.9B | 1.9B |
| Operating Expenses | 37.5B | 9.5B |
| Gross Profit | 57.2B | 14.0B |
| EBITDA | 21.8B | 4.8B |
| EBIT | 19.6B | 4.6B |
| Interest Expense | 66.8B | 1.8B |
| Net Income | 17.2B | 2.1B |
| EPS | 51.95 | 10.53 |
| Fiscal Year | 2025 | 2025 |
Income Statement Analysis: The Bottom-Line Duel
This income statement comparison reveals the true efficiency and profitability of two major financial firms across recent years.
The Goldman Sachs Group, Inc. Analysis
Goldman Sachs’ revenue grew impressively by 92.5% from 2021 to 2025 but slipped slightly by 1.4% in 2025 alone. Its gross margin remains strong at 45.7%, reflecting solid cost control. The net margin rebounded 22% in 2025, lifting net income to $17.2B, indicating improving profitability despite a high interest expense ratio of 53.4%.
Raymond James Financial, Inc. Analysis
Raymond James posted steady revenue growth of 62.7% over five years, gaining 7.9% in 2025 to $15.9B. The firm boasts an exceptional gross margin of 88.2% and a robust EBIT margin of 28.7%, signaling excellent operational efficiency. Net income rose 52% over the period to $2.1B, although net margin dipped slightly by 4.4% in the latest year.
Margin Power vs. Revenue Scale
Goldman Sachs dominates in revenue scale with $125B but struggles with higher interest expenses that compress margins. Raymond James excels in margin quality and operational efficiency despite smaller revenue, delivering stronger EBIT margins. For investors, Goldman Sachs offers scale and improving bottom-line momentum, while Raymond James presents a cleaner margin profile with consistent profitability growth.
Financial Ratios Comparison
These vital ratios act as a diagnostic tool to expose the underlying fiscal health, valuation premiums, and capital efficiency of the companies analyzed:
| Ratios | The Goldman Sachs Group, Inc. (GS) | Raymond James Financial, Inc. (RJF) |
|---|---|---|
| ROE | 13.74% | 17.08% |
| ROIC | 0.98% | 15.88% |
| P/E | 16.00 | 16.33 |
| P/B | 2.20 | 2.79 |
| Current Ratio | 1.21 | 0.32 |
| Quick Ratio | 1.21 | 0.32 |
| D/E | 4.95 | 0.36 |
| Debt-to-Assets | 34.20% | 5.15% |
| Interest Coverage | 0.29 | 2.47 |
| Asset Turnover | 0.069 | 0.18 |
| Fixed Asset Turnover | 3.47 | 10.35 |
| Payout Ratio | 25.49% | 19.48% |
| Dividend Yield | 1.59% | 1.19% |
| Fiscal Year | 2025 | 2025 |
Efficiency & Valuation Duel: The Vital Signs
Ratios act as a company’s DNA, revealing hidden risks and operational excellence that shape long-term investor outcomes.
The Goldman Sachs Group, Inc.
Goldman Sachs shows a solid net margin of 13.73% and a neutral ROE at 13.74%, indicating average profitability. The P/E ratio at 16.0 suggests fair valuation, neither cheap nor stretched. Dividend yield of 1.59% signals moderate shareholder returns, balancing payouts with reinvestment in operational efficiency.
Raymond James Financial, Inc.
Raymond James boasts a stronger ROE of 17.08% and a favorable ROIC of 15.88%, highlighting efficient capital use. Its P/E of 16.33 is neutral, supporting a reasonable valuation. Despite a lower dividend yield of 1.19%, the company’s focus on growth and prudent leverage enhances risk-adjusted returns.
Balanced Profitability vs. Capital Efficiency
Raymond James offers more favorable profitability ratios and capital efficiency than Goldman Sachs. Goldman Sachs maintains stable dividends but lags in ROIC. Investors prioritizing capital efficiency and growth may lean toward Raymond James, while those valuing steady dividends might consider Goldman Sachs’s profile.
Which one offers the Superior Shareholder Reward?
I see Goldman Sachs (GS) offers a higher dividend yield around 2.4% in 2025, with a payout ratio near 31.5%, reflecting moderate distribution while retaining capital. GS’s buyback activity is less visible but leverage and payout suggest cautious capital return. Raymond James Financial (RJF) yields roughly 1.2% with a lower payout ratio near 19%, signaling more retained earnings for growth or acquisitions. RJF’s buybacks appear consistent, enhancing shareholder value alongside dividends. Historically, GS’s model favors income with moderate growth, while RJF prioritizes sustainable capital reinvestment and steady buybacks. For 2026, I judge RJF’s balanced approach more sustainable and attractive for total return, blending moderate dividends with growth potential and buyback intensity, whereas GS’s higher yield carries leverage risk.
Comparative Score Analysis: The Strategic Profile
The radar chart reveals the fundamental DNA and trade-offs of both firms, highlighting their financial strengths and vulnerabilities:
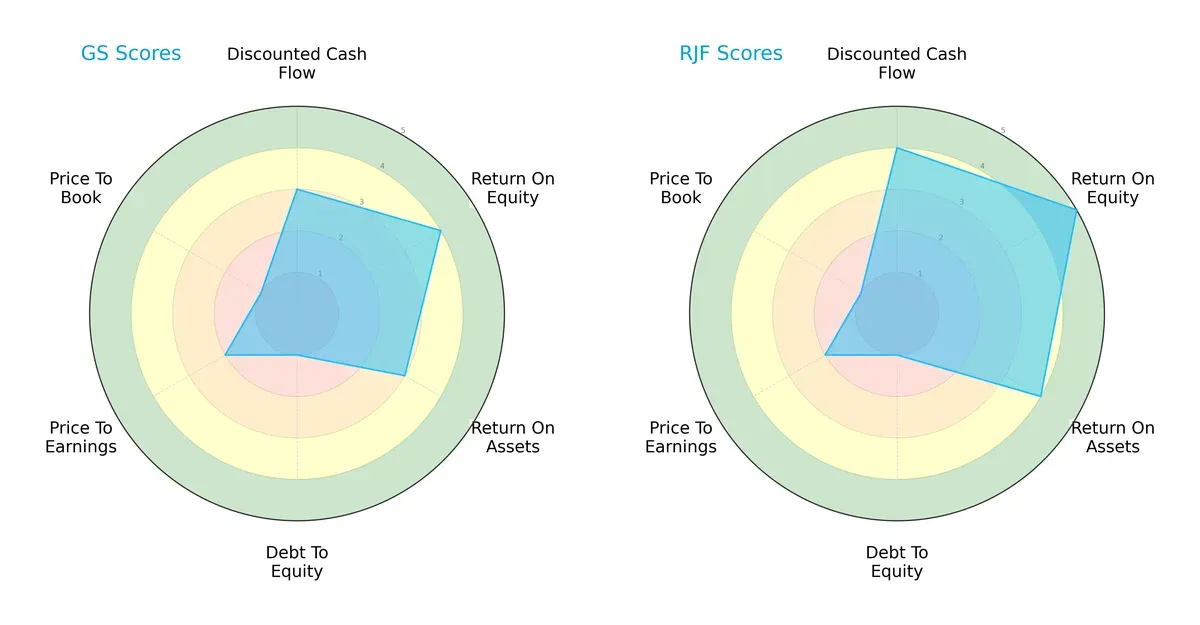
Raymond James Financial (RJF) demonstrates a more balanced and robust profile, leading in DCF (4 vs. 3), ROE (5 vs. 4), and ROA (4 vs. 3). Both firms share a weak Debt/Equity score (1), signaling elevated financial risk. Goldman Sachs (GS) relies more heavily on its return metrics, but suffers from very unfavorable valuation scores (P/E and P/B at 2 and 1), indicating potential overvaluation compared to RJF.
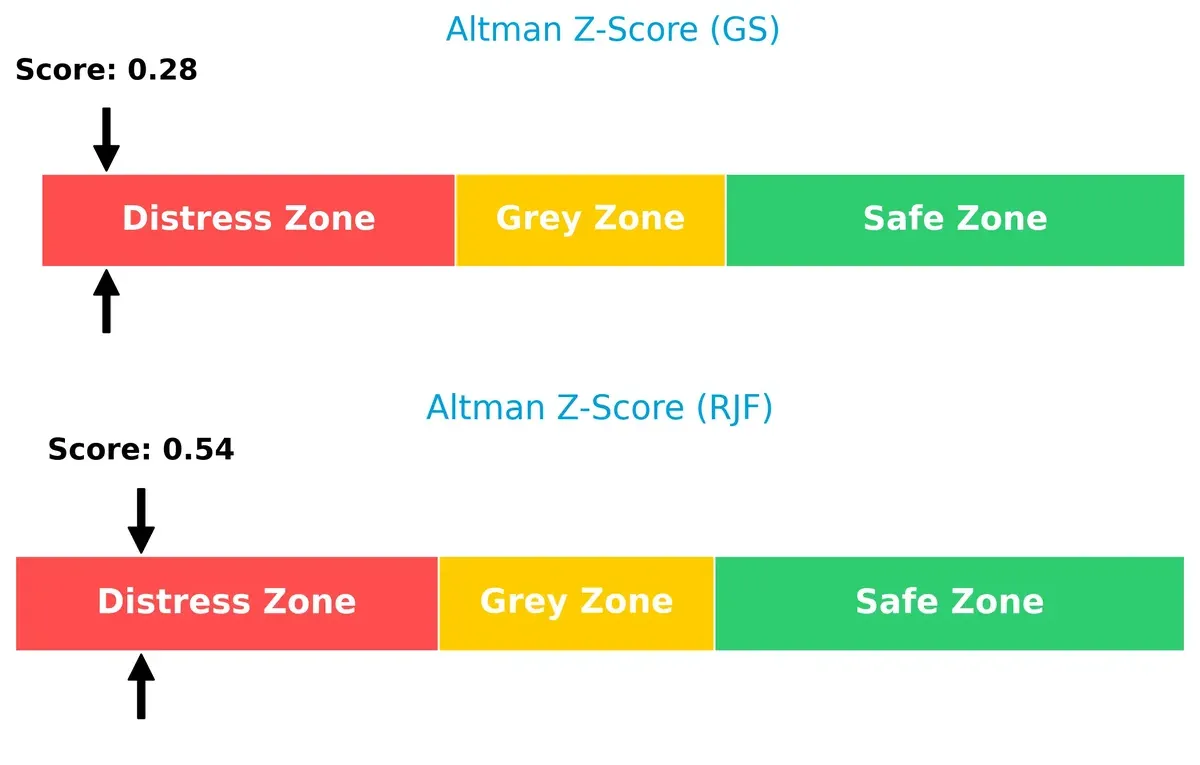
Bankruptcy Risk: Solvency Showdown
The Altman Z-Scores place both firms in the distress zone, with GS at 0.28 and RJF slightly higher at 0.54. These low scores imply significant bankruptcy risk for both companies in this cycle:
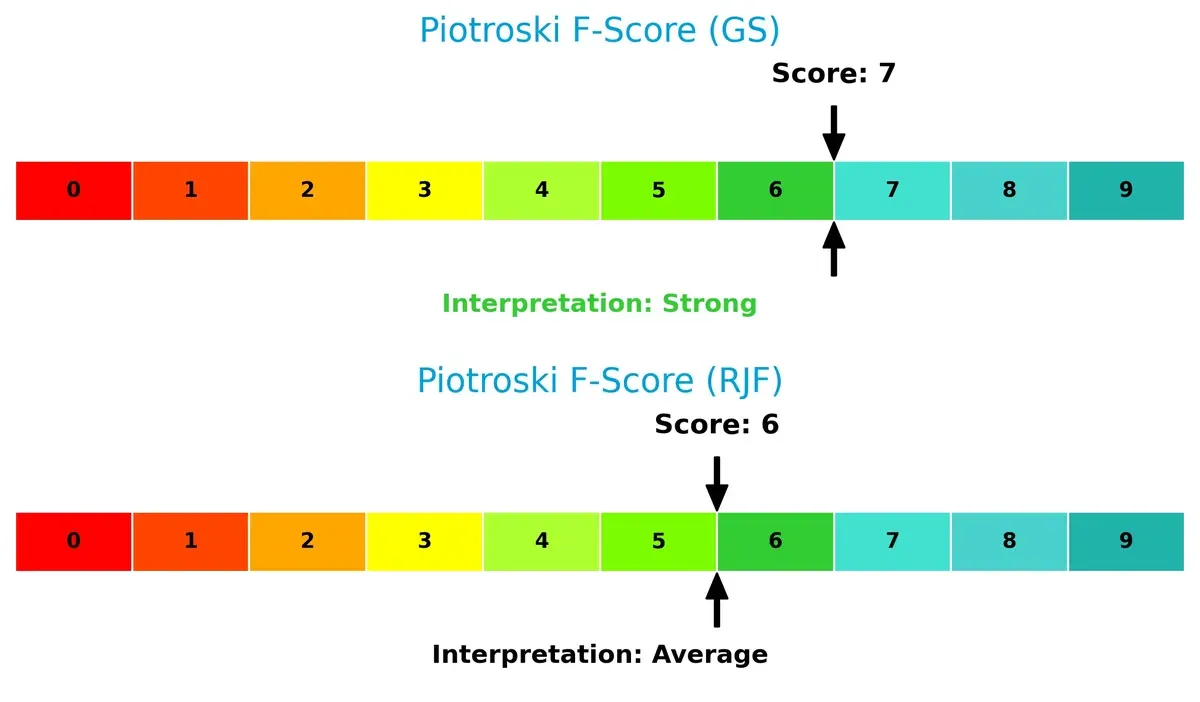
Financial Health: Quality of Operations
GS scores a 7 on the Piotroski F-Score, indicating strong financial health, while RJF’s 6 suggests average operational quality. GS shows fewer red flags internally:
How are the two companies positioned?
This section dissects GS and RJF’s operational DNA by comparing revenue distribution and internal dynamics—strengths and weaknesses. The goal is to confront their economic moats to identify which model offers the most resilient, sustainable advantage today.
Revenue Segmentation: The Strategic Mix
This comparison dissects how The Goldman Sachs Group, Inc. and Raymond James Financial, Inc. diversify their income streams and where their primary sector bets lie:
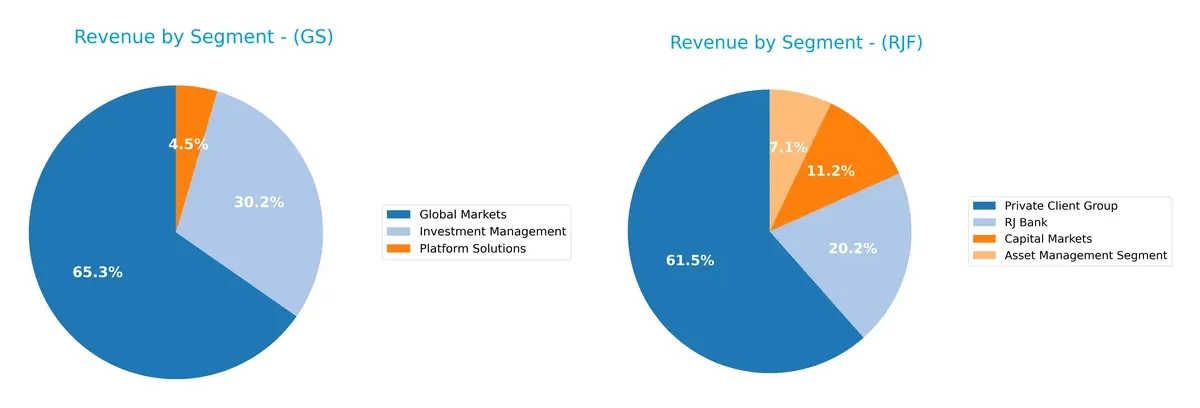
Goldman Sachs anchors revenue in Global Markets with $34.9B in 2024, dwarfing other segments like Investment Management at $16.1B and Platform Solutions at $2.4B. This concentration signals a stronghold in market-making and trading infrastructure. Conversely, Raymond James relies heavily on its Private Client Group at $10.3B, supported by RJ Bank ($3.4B) and Capital Markets ($1.9B). Raymond James shows a more client-facing, diversified model, reducing concentration risk but with less dominance in trading ecosystems.
Strengths and Weaknesses Comparison
This table compares the Strengths and Weaknesses of GS and RJF based on diversification, profitability, financials, innovation, global presence, and market share:
GS Strengths
- Broad revenue streams in Investment Management, Global Markets, and Platform Solutions
- Strong presence across Americas, EMEA, Asia
- Favorable quick ratio and fixed asset turnover
RJF Strengths
- High returns on equity and invested capital
- Low debt-to-equity and debt-to-assets ratios support financial stability
- Favorable fixed asset turnover and net margin
GS Weaknesses
- Unfavorable returns on invested capital and high debt-to-equity ratio
- Weak interest coverage and asset turnover ratios
- Slightly unfavorable overall financial ratios
RJF Weaknesses
- Low current and quick ratios indicate liquidity constraints
- Unfavorable weighted average cost of capital and asset turnover
- Moderate unfavorable financial ratios present caution
GS demonstrates diversified revenue and global reach but faces capital efficiency and leverage challenges. RJF shows superior profitability and conservative leverage but struggles with liquidity and cost of capital. Each company’s financial profile implies distinct strategic priorities in managing growth and risk.
The Moat Duel: Analyzing Competitive Defensibility
A structural moat is the only reliable shield protecting long-term profits from relentless competition erosion. Let’s dissect the competitive advantages of Goldman Sachs and Raymond James Financial:
The Goldman Sachs Group, Inc.: Intangible Assets Powerhouse
Goldman Sachs leverages elite brand reputation and global client networks as its moat. Despite strong margin stability, its declining ROIC signals value erosion, challenging its moat durability in 2026.
Raymond James Financial, Inc.: Operational Efficiency Edge
Raymond James relies on superior capital allocation and operational efficiency, reflected in a rising ROIC above WACC. Its expanding profitability suggests a strengthening moat and growth potential in new wealth management markets.
Elite Brand vs. Operational Mastery: The Moat Clash
Raymond James boasts a deeper, more durable moat, driven by growing ROIC and value creation. Goldman Sachs’ intangible assets remain powerful but face margin pressures and declining returns, weakening its moat defense. Raymond James stands better equipped to sustain and expand market share.
Which stock offers better returns?
The past year shows strong price rallies for both stocks, with Goldman Sachs accelerating sharply, while Raymond James posts steady gains amid contrasting volume trends.
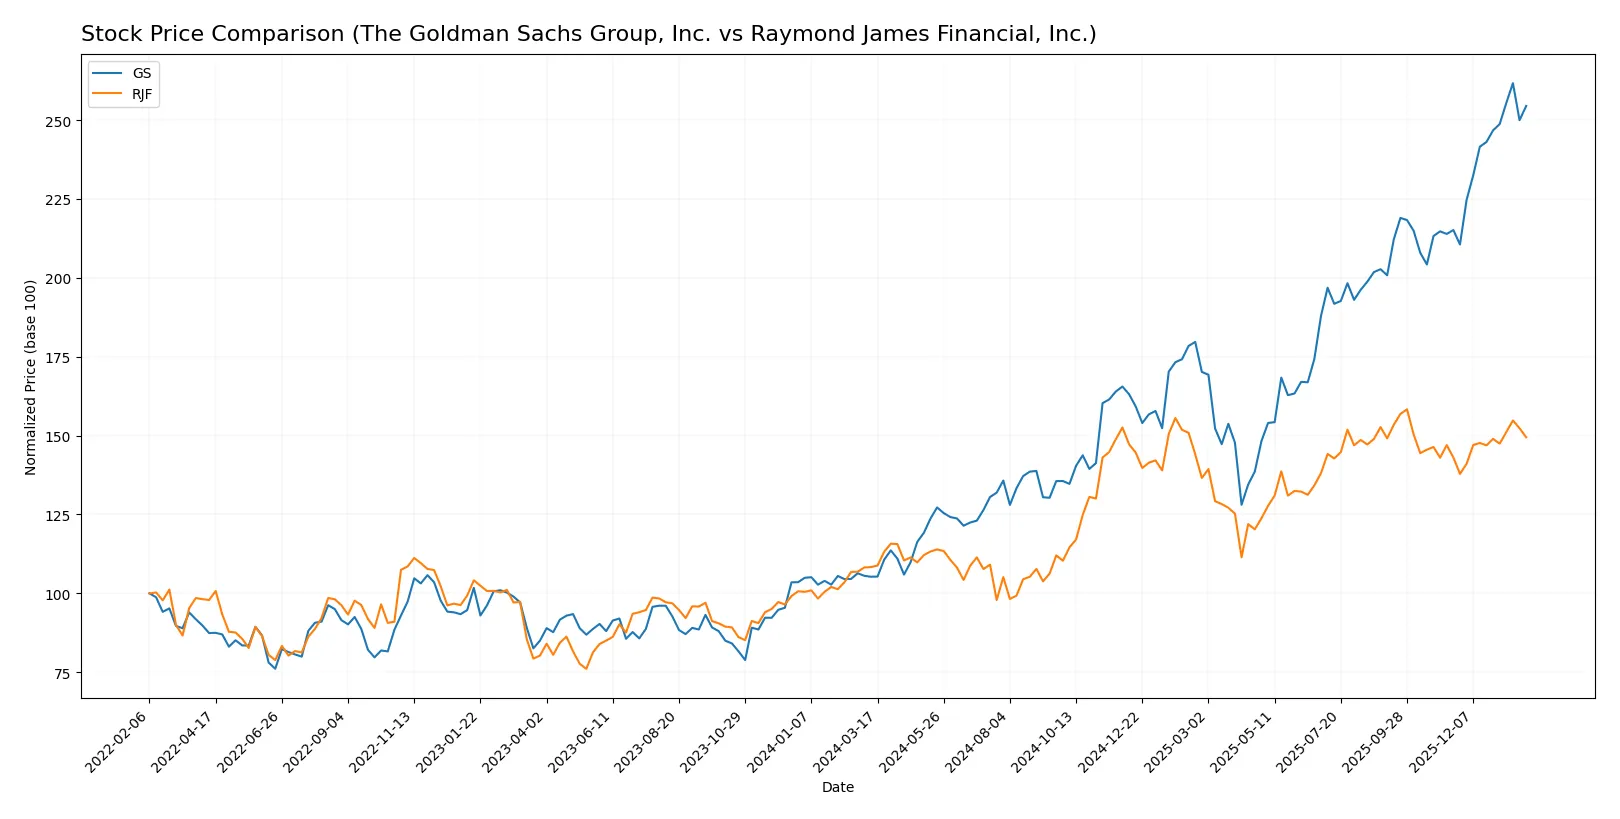
Trend Comparison
The Goldman Sachs Group, Inc. stock rose 142% over the last 12 months, showing a bullish trend with accelerating momentum and a high volatility level (std dev 149.43). It peaked at 962 and bottomed at 387.
Raymond James Financial, Inc. gained 38% in the same period, also bullish with acceleration but lower volatility (std dev 19.46). The stock ranged from 109 to 176, reflecting steadier growth.
Goldman Sachs outperformed Raymond James by a wide margin, delivering the highest market return and stronger recent price acceleration despite greater volatility.
Target Prices
Analysts present a mixed but generally optimistic consensus on target prices for The Goldman Sachs Group, Inc. and Raymond James Financial, Inc.
| Company | Target Low | Target High | Consensus |
|---|---|---|---|
| The Goldman Sachs Group, Inc. | 604 | 1100 | 902.83 |
| Raymond James Financial, Inc. | 176 | 198 | 187 |
The Goldman Sachs target consensus at 902.83 slightly undercuts its current price of 935.41, indicating modest downside risk. Raymond James shows upside potential, with a consensus target 13% above its current 165.86 price.

Don’t Let Luck Decide Your Entry Point
Optimize your entry points with our advanced ProRealTime indicators. You’ll get efficient buy signals with precise price targets for maximum performance. Start outperforming now!
How do institutions grade them?
The Goldman Sachs Group, Inc. Grades
Here are the recent institutional grades for Goldman Sachs from major analysts:
| Grading Company | Action | New Grade | Date |
|---|---|---|---|
| RBC Capital | Maintain | Sector Perform | 2026-01-20 |
| Keefe, Bruyette & Woods | Maintain | Market Perform | 2026-01-16 |
| Wells Fargo | Maintain | Overweight | 2026-01-16 |
| JP Morgan | Maintain | Neutral | 2026-01-08 |
| Barclays | Maintain | Overweight | 2026-01-05 |
Raymond James Financial, Inc. Grades
This table shows Raymond James Financial’s latest grades by leading firms:
| Grading Company | Action | New Grade | Date |
|---|---|---|---|
| TD Cowen | Maintain | Hold | 2026-01-14 |
| Morgan Stanley | Maintain | Equal Weight | 2025-12-22 |
| B of A Securities | Maintain | Neutral | 2025-12-10 |
| BMO Capital | Maintain | Market Perform | 2025-10-23 |
| Keefe, Bruyette & Woods | Maintain | Market Perform | 2025-10-23 |
Which company has the best grades?
Goldman Sachs generally receives stronger ratings, including several Overweight grades, indicating more optimism. Raymond James mostly holds Neutral or Market Perform grades. This suggests Goldman Sachs may be viewed as having better near-term potential, but investors should consider each firm’s risk profile.
Risks specific to each company
The following categories identify critical pressure points and systemic threats facing both firms in the 2026 market environment:
1. Market & Competition
The Goldman Sachs Group, Inc.
- Faces intense competition in global investment banking and asset management, with pressure from fintech disruptors and large diversified banks.
Raymond James Financial, Inc.
- Competes mainly in wealth management and regional capital markets, with challenges from larger national firms and digital advisory platforms.
2. Capital Structure & Debt
The Goldman Sachs Group, Inc.
- High debt-to-equity ratio (4.95) and weak interest coverage (0.29) pose significant financial risk and leverage strain.
Raymond James Financial, Inc.
- Maintains conservative leverage (D/E 0.36) and stronger interest coverage (2.47), reflecting a more stable capital structure.
3. Stock Volatility
The Goldman Sachs Group, Inc.
- Beta of 1.322 signals above-market volatility, exposing investors to higher risk in turbulent markets.
Raymond James Financial, Inc.
- Beta near 1.0 indicates stock volatility closely tracks the broader market, implying steadier price movements.
4. Regulatory & Legal
The Goldman Sachs Group, Inc.
- Operates globally, facing complex regulations and legal scrutiny in multiple jurisdictions, increasing compliance costs.
Raymond James Financial, Inc.
- Primarily U.S.-focused, with comparatively simpler regulatory environment but still subject to evolving financial regulations.
5. Supply Chain & Operations
The Goldman Sachs Group, Inc.
- Relies heavily on technology and global talent; operational risks include cyber threats and talent retention challenges.
Raymond James Financial, Inc.
- Operations are more concentrated regionally; faces risks in technology integration and scaling client services effectively.
6. ESG & Climate Transition
The Goldman Sachs Group, Inc.
- Increasing pressure to finance sustainable projects and manage ESG risks across diverse portfolios; reputational risks are significant.
Raymond James Financial, Inc.
- ESG initiatives growing but less exposed to complex global mandates; opportunity to improve ESG credentials in wealth management.
7. Geopolitical Exposure
The Goldman Sachs Group, Inc.
- High geopolitical risk due to global operations, including emerging markets and cross-border transactions.
Raymond James Financial, Inc.
- Lower geopolitical risk with a U.S.-centric footprint, though international exposure exists in Canada and Europe.
Which company shows a better risk-adjusted profile?
Raymond James Financial’s strongest risk buffer lies in its conservative capital structure and stable market volatility. Goldman Sachs, while dominant, carries heavier leverage and global regulatory complexities. Goldman’s debt servicing and Altman Z-Score in distress zone highlight acute financial risk. Raymond James, despite a lower Piotroski Score, exhibits a more balanced risk profile. The critical risk for Goldman Sachs is its high leverage and weak interest coverage, which threaten financial flexibility amid market stress. For Raymond James, the main risk is its low liquidity ratios that could strain short-term operations. Overall, Raymond James presents a superior risk-adjusted profile supported by robust ROIC and manageable debt, while Goldman Sachs’s aggressive leverage demands caution.
Final Verdict: Which stock to choose?
The Goldman Sachs Group, Inc. (GS) excels as a cash-generating powerhouse with strong earnings growth and operational efficiency. Its main point of vigilance is the declining return on invested capital, signaling potential challenges in sustaining value creation. GS suits aggressive growth portfolios willing to navigate profitability headwinds.
Raymond James Financial, Inc. (RJF) offers a durable competitive moat supported by consistently high ROIC exceeding its cost of capital. Its strategic advantage lies in disciplined capital allocation and stable profitability, presenting a safer profile compared to GS. RJF fits well within GARP portfolios seeking growth with more stability.
If you prioritize aggressive growth and can tolerate volatility, GS is the compelling choice due to robust earnings momentum and cash flow strength. However, if you seek durable value creation with better stability and a proven moat, RJF outshines as the superior option. Both carry risks, but their profiles address distinct investor appetites.
Disclaimer: Investment carries a risk of loss of initial capital. The past performance is not a reliable indicator of future results. Be sure to understand risks before making an investment decision.
Go Further
I encourage you to read the complete analyses of The Goldman Sachs Group, Inc. and Raymond James Financial, Inc. to enhance your investment decisions: