Home > Comparison > Financial Services > SCHW vs RJF
The strategic rivalry between The Charles Schwab Corporation and Raymond James Financial, Inc. shapes the Financial Services sector’s evolution. Schwab operates as a capital markets powerhouse with broad retail and advisory services. Raymond James combines private client wealth management with diversified capital markets and banking solutions. This head-to-head pits scale and technology against personalized service and niche expertise. This analysis will clarify which model delivers superior risk-adjusted returns for a diversified portfolio in 2026.

Table of contents
Companies Overview
The Charles Schwab and Raymond James Financial stand as pivotal players in the financial capital markets, shaping wealth management and advisory services in the U.S.
The Charles Schwab Corporation: Wealth Management Powerhouse
The Charles Schwab Corporation dominates as a wealth management and brokerage leader. It generates revenue through retail brokerage, investment advisory, banking, and asset management services. In 2021, Schwab strategically focused on expanding its Advisor Services segment, delivering custodial, trading, and banking products tailored for institutional clients and financial advisors.
Raymond James Financial, Inc.: Diversified Financial Services
Raymond James Financial, Inc. operates as a diversified financial services firm offering investment banking, asset management, and private client services. Its revenue streams include equity and debt underwriting, portfolio management, and banking loans. In 2021, the company emphasized growth in its Private Client Group and Capital Markets segments to capture broader market penetration across the U.S., Canada, and Europe.
Strategic Collision: Similarities & Divergences
Both firms compete fiercely in wealth management but diverge in business philosophy. Schwab emphasizes a technology-driven, advisory-focused model, while Raymond James pursues a relationship-driven, diversified financial services approach. Their primary battleground lies in capturing retail and advisor clientele. Schwab offers a scalable platform; Raymond James provides personalized service, creating distinct investment profiles for different investor appetites.
Income Statement Comparison
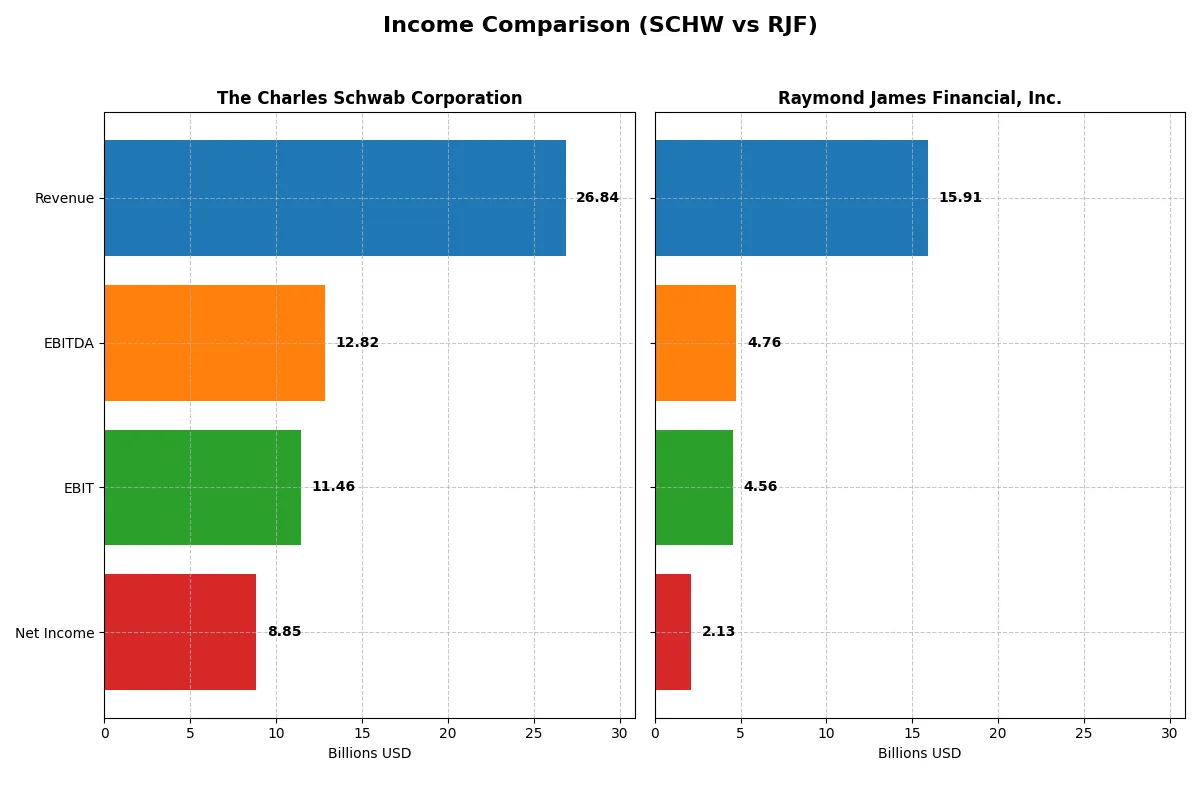
The following data dissects the core profitability and scalability of both corporate engines to reveal who dominates the bottom line:
| Metric | The Charles Schwab Corporation (SCHW) | Raymond James Financial, Inc. (RJF) |
|---|---|---|
| Revenue | 26.8B | 15.9B |
| Cost of Revenue | 2.9B | 1.9B |
| Operating Expenses | 12.5B | 9.5B |
| Gross Profit | 23.9B | 14.0B |
| EBITDA | 12.8B | 4.8B |
| EBIT | 11.5B | 4.6B |
| Interest Expense | 3.8B | 1.8B |
| Net Income | 8.9B | 2.1B |
| EPS | 4.68 | 10.53 |
| Fiscal Year | 2025 | 2025 |
Income Statement Analysis: The Bottom-Line Duel
This income statement comparison will uncover which company runs a more efficient and profitable corporate engine through recent financial performance.
The Charles Schwab Corporation Analysis
Schwab’s revenue rose steadily from 19B in 2021 to 26.8B in 2025, with net income surging from 5.4B to 8.8B. Gross margins remain robust at 89%, driving strong profitability. The 2025 year stands out with a 44% net margin increase, reflecting superior operational efficiency and momentum.
Raymond James Financial, Inc. Analysis
Raymond James grew revenue from 9.8B in 2021 to 15.9B in 2025, with net income rising from 1.4B to 2.1B. Its gross margin is solid at 88%, though net margins trail Schwab at 13%. Despite 73% EBIT growth in 2025, net margin shrank slightly, signaling margin pressure amid top-line gains.
Margin Power vs. Revenue Scale
Schwab dominates with higher absolute profits and superior net margins, showcasing a finely tuned cost structure and scalable earnings. Raymond James delivers faster revenue growth but struggles to convert it into net income efficiently. For investors, Schwab’s profile offers stronger profitability and margin resilience in a competitive sector.
Financial Ratios Comparison
These vital ratios act as a diagnostic tool to expose the underlying fiscal health, valuation premiums, and capital efficiency of the companies compared below:
| Ratios | The Charles Schwab Corporation (SCHW) | Raymond James Financial, Inc. (RJF) |
|---|---|---|
| ROE | 12.3% (2024) | 17.0% (2025) |
| ROIC | 5.6% (2024) | 15.9% (2025) |
| P/E | 22.8x (2024) | 16.3x (2025) |
| P/B | 2.80x (2024) | 2.79x (2025) |
| Current Ratio | 0.54 (2024) | 0.32 (2025) |
| Quick Ratio | 0.54 (2024) | 0.32 (2025) |
| D/E | 0.93 (2024) | 0.36 (2025) |
| Debt-to-Assets | 9.4% (2024) | 5.2% (2025) |
| Interest Coverage | 1.20x (2024) | 2.47x (2025) |
| Asset Turnover | 0.054 (2024) | 0.18 (2025) |
| Fixed Asset Turnover | 6.62 (2024) | 10.35 (2025) |
| Payout ratio | 21.6% (2025) | 19.5% (2025) |
| Dividend yield | 1.08% (2025) | 1.19% (2025) |
| Fiscal Year | 2025 | 2025 |
Efficiency & Valuation Duel: The Vital Signs
Financial ratios act as the company’s DNA, unveiling hidden risks and operational strengths crucial for investment insight.
The Charles Schwab Corporation
Schwab’s net margin of 33% signals strong profitability, but zero reported ROE and ROIC raise concerns about capital efficiency. Its P/E of 20 suggests a neutral valuation, neither cheap nor stretched. The dividend yield of 1.08% is modest, reflecting a balanced approach between shareholder returns and reinvestment, though several liquidity ratios remain unfavorable.
Raymond James Financial, Inc.
Raymond James posts a solid ROE of 17.1% and ROIC of 15.9%, showing efficient use of capital and operational strength. Its P/E of 16.3 is neutral, implying fair market pricing. The company delivers a slightly higher dividend yield of 1.19%, supported by favorable debt metrics, although liquidity ratios are weak, indicating some short-term risk.
Balanced Profitability vs. Liquidity Concerns
Raymond James offers better capital efficiency and a slightly more favorable overall ratio profile than Schwab. Schwab’s strong margins contrast with weak capital returns and liquidity, making it riskier. Investors valuing operational efficiency may prefer Raymond James, while those focusing on margin strength might lean toward Schwab.
Which one offers the Superior Shareholder Reward?
I find The Charles Schwab Corporation (SCHW) and Raymond James Financial, Inc. (RJF) pursue distinct shareholder reward models. SCHW offers a modest 1.08% dividend yield with a 22% payout ratio, balancing dividends with steady buybacks to sustain value. RJF yields slightly higher at 1.19%, supported by a lower 19% payout ratio, and executes more aggressive buybacks enhancing total return. SCHW’s distribution is conservative but sustainable, relying on strong free cash flow and capital discipline. RJF’s model favors higher buyback intensity, boosting shareholder returns but with moderate margin volatility. For 2026, I favor RJF’s combination of yield and buyback-driven growth as the superior total return opportunity.
Comparative Score Analysis: The Strategic Profile
The radar chart reveals the fundamental DNA and trade-offs of The Charles Schwab Corporation and Raymond James Financial, Inc.:
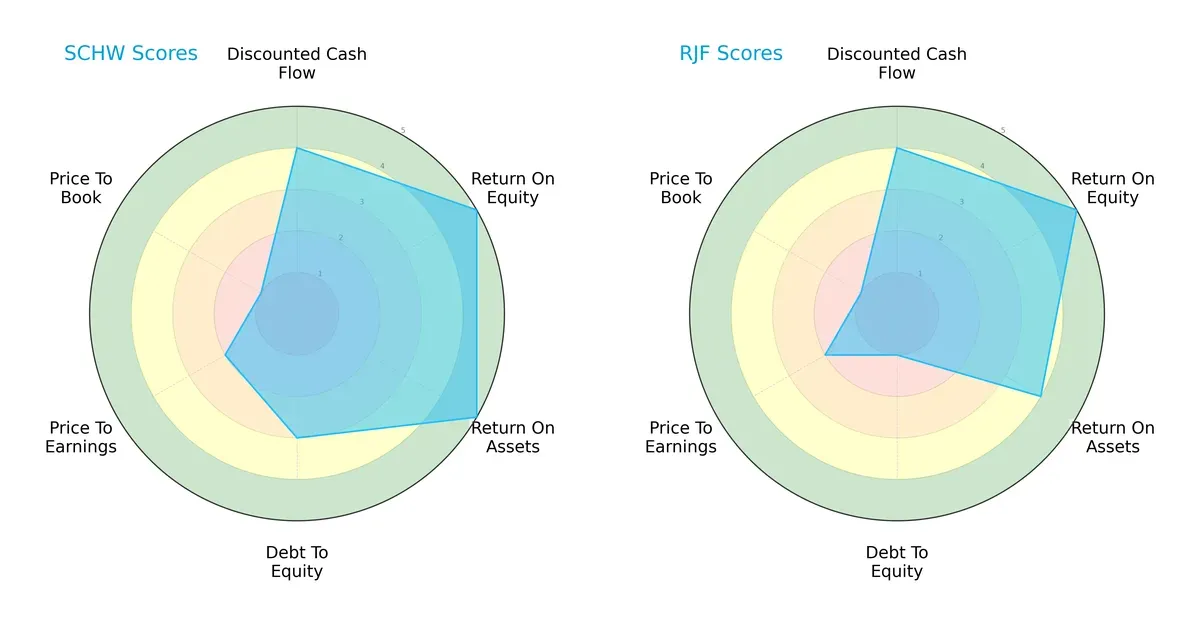
Charles Schwab delivers a more balanced profile with very favorable ROE and ROA scores, reflecting efficient asset and equity utilization. Raymond James matches Schwab’s ROE but lags in ROA and suffers from a very unfavorable debt-to-equity score, signaling higher financial risk. Schwab’s moderate valuation scores contrast with Raymond James’s similar valuation but weaker leverage profile. Schwab leans on operational efficiency and moderate leverage; Raymond James depends heavily on equity returns but carries debt risks.
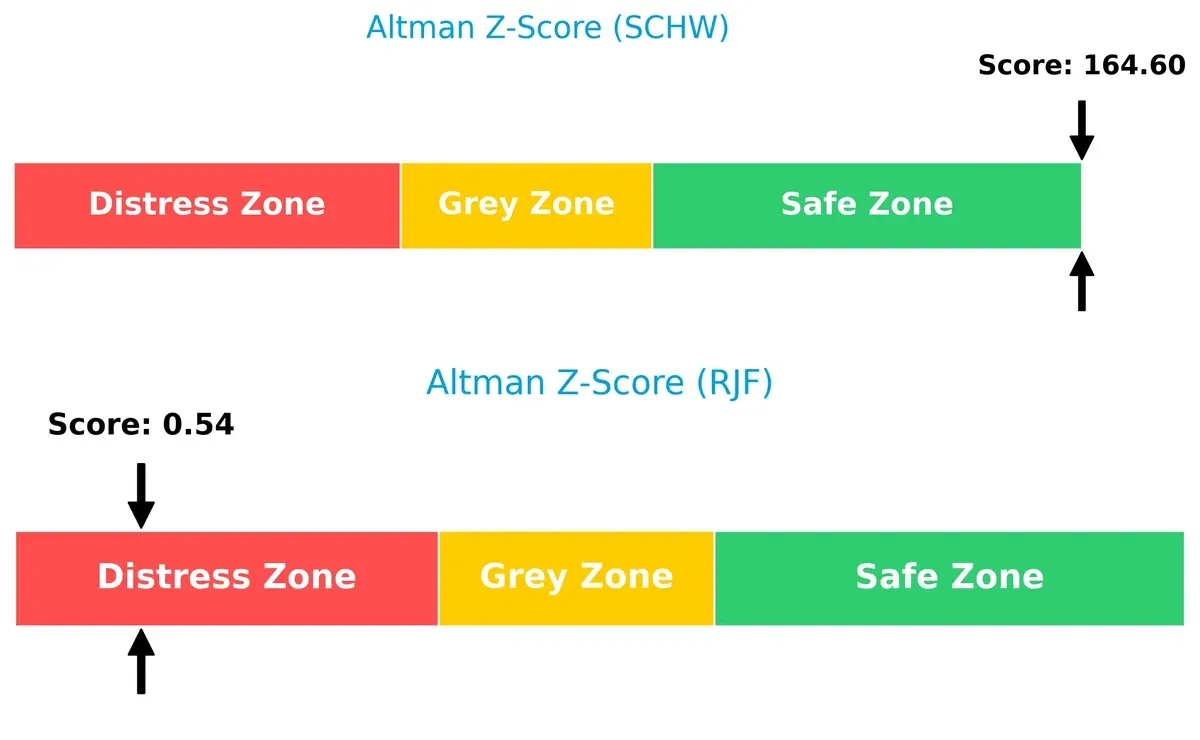
Bankruptcy Risk: Solvency Showdown
Charles Schwab’s Altman Z-Score at 165 places it confidently in the safe zone, while Raymond James’s score of 0.54 signals distress risk. This gap indicates Schwab’s superior long-term solvency and resilience in current market cycles:
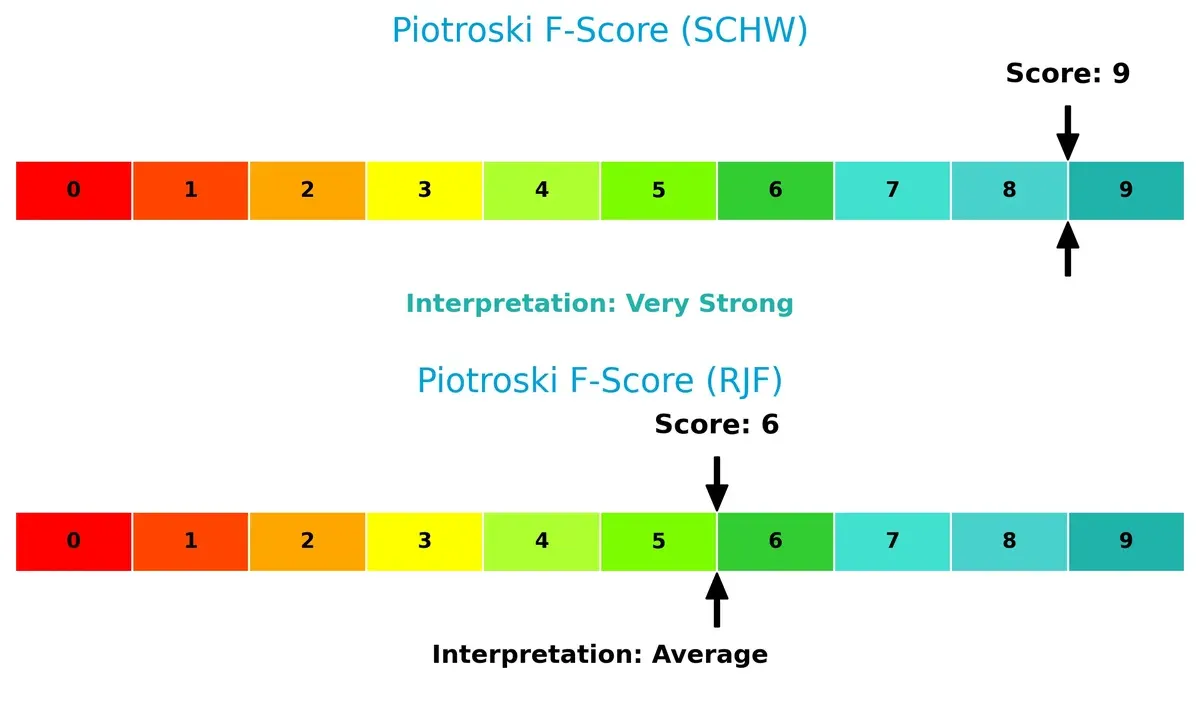
Financial Health: Quality of Operations
Schwab’s Piotroski F-Score of 9 reflects peak financial health with robust profitability and operational strength. Raymond James’s score of 6 is average, suggesting some internal weaknesses compared to Schwab’s strong fundamentals:
How are the two companies positioned?
This section dissects the operational DNA of SCHW and RJF by comparing their revenue distribution and internal dynamics—strengths and weaknesses. The goal is to confront their economic moats and identify which model offers the most resilient, sustainable competitive advantage today.
Revenue Segmentation: The Strategic Mix
The following visual comparison dissects how The Charles Schwab Corporation and Raymond James Financial diversify their income streams and where their primary sector bets lie:
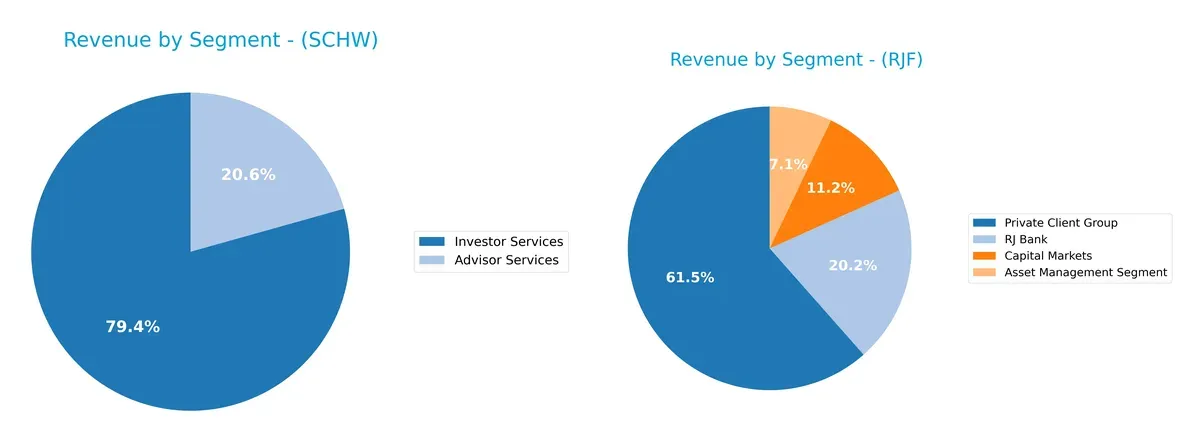
Charles Schwab anchors its revenue in Investor Services, generating $15.5B in 2024, while Advisor Services contribute $4.0B. This mix shows moderate diversification but a clear reliance on Investor Services. Raymond James Financial presents a broader portfolio: Private Client Group leads with $10.3B, followed by RJ Bank at $3.4B, Capital Markets at $1.9B, and Asset Management near $1.2B. RJF’s spread reduces concentration risk and leverages multiple financial ecosystems. Schwab’s focus suggests stronger ecosystem lock-in in retail investing.
Strengths and Weaknesses Comparison
This table compares the Strengths and Weaknesses of The Charles Schwab Corporation and Raymond James Financial, Inc.:
SCHW Strengths
- High net margin at 33%
- Favorable debt to equity and debt to assets ratios
- Large revenue in Investor Services segment
RJF Strengths
- Favorable ROE and ROIC ratios
- Strong fixed asset turnover at 10.35
- Diversified revenue including Private Client Group and RJ Bank
SCHW Weaknesses
- Zero ROE and ROIC indicating poor capital efficiency
- Unfavorable liquidity ratios with zero current and quick ratios
- Low asset turnover ratios
RJF Weaknesses
- WACC of 11.15% is unfavorable compared to ROIC
- Low current and quick ratios at 0.32
- Net margin lower at 13.4% compared to SCHW
Both companies show strengths in profitability and segment revenue diversity but face liquidity challenges. SCHW struggles with capital efficiency, while RJF has a higher cost of capital that may pressure returns. These factors shape their strategic focus on improving operational and financial resilience.
The Moat Duel: Analyzing Competitive Defensibility
A structural moat is the sole protector of long-term profits from relentless competitive erosion. Let’s dissect the core moats defending two financial giants:
The Charles Schwab Corporation: Intangible Assets and Scale Advantage
Schwab leverages strong brand recognition and scale, reflected in stable high margins near 33%. However, a declining ROIC trend signals potential pressure on its competitive edge in 2026.
Raymond James Financial, Inc.: Efficient Capital Allocation and Growing ROIC
Raymond James contrasts Schwab with a rising ROIC surpassing WACC by 4.7%, highlighting superior capital efficiency. Its expanding international presence fuels growth and deepens its moat.
Scale and Capital Efficiency: Schwab’s Brand vs. Raymond James’ Rising ROIC
Raymond James boasts a wider, more sustainable moat driven by improving returns and capital discipline. Schwab’s intangible assets remain valuable but face mounting challenges defending market share.
Which stock offers better returns?
The past year shows strong upward momentum for both stocks, with noticeable price acceleration and increasing buyer dominance confirming robust trading dynamics.
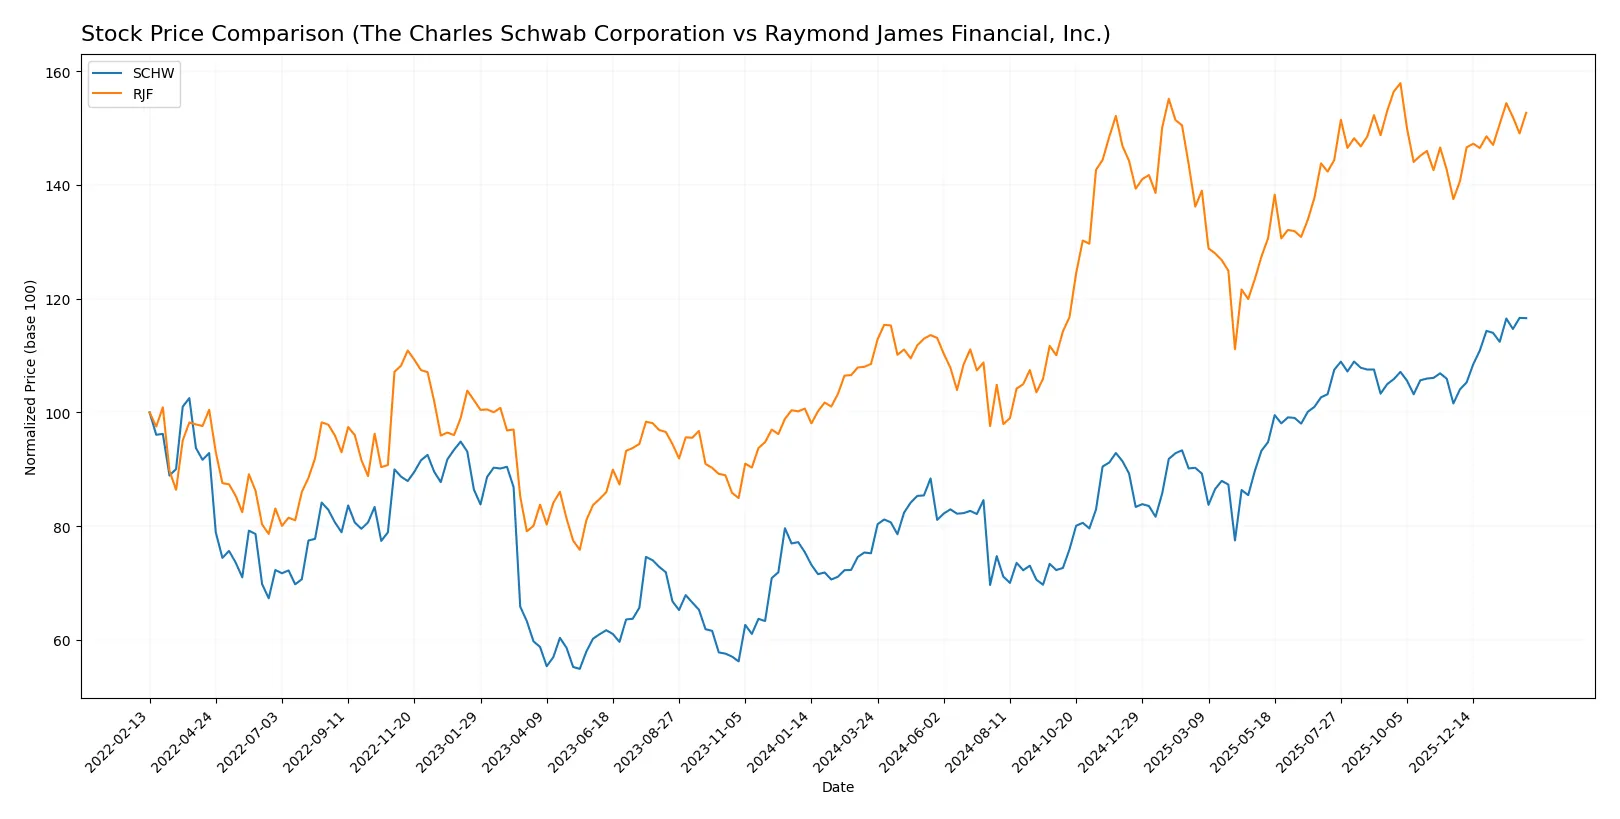
Trend Comparison
The Charles Schwab Corporation’s stock rose 54.95% over the past 12 months, showing a bullish trend with accelerating gains. It hit a high of 103.92 and maintained moderate volatility (std dev 11.77).
Raymond James Financial, Inc. gained 40.68% in the same period, also bullish with acceleration. It reached a peak of 175.69 but displayed higher volatility (std dev 19.44).
Schwab outperformed Raymond James by delivering stronger total returns and steadier price appreciation over the last year.
Target Prices
Analysts set a constructive target consensus for both The Charles Schwab Corporation and Raymond James Financial, Inc.
| Company | Target Low | Target High | Consensus |
|---|---|---|---|
| The Charles Schwab Corporation | 105 | 148 | 122.78 |
| Raymond James Financial, Inc. | 176 | 198 | 187 |
The Charles Schwab target consensus suggests a moderate upside from the current 103.88 price, while Raymond James shows a stronger expected appreciation from 169.89. Overall, analysts expect solid gains across these financial market players.

Don’t Let Luck Decide Your Entry Point
Optimize your entry points with our advanced ProRealTime indicators. You’ll get efficient buy signals with precise price targets for maximum performance. Start outperforming now!
How do institutions grade them?
The following tables summarize the latest institutional grades for The Charles Schwab Corporation and Raymond James Financial, Inc.:
The Charles Schwab Corporation Grades
This table shows the recent grades and actions from major grading companies for Schwab.
| Grading Company | Action | New Grade | Date |
|---|---|---|---|
| Barclays | Maintain | Overweight | 2026-01-26 |
| Barclays | Maintain | Overweight | 2026-01-22 |
| UBS | Maintain | Buy | 2026-01-22 |
| Truist Securities | Maintain | Buy | 2026-01-22 |
| TD Cowen | Maintain | Buy | 2026-01-22 |
| Piper Sandler | Maintain | Neutral | 2026-01-14 |
| TD Cowen | Maintain | Buy | 2026-01-14 |
| Citizens | Maintain | Market Outperform | 2026-01-12 |
| Barclays | Maintain | Overweight | 2026-01-08 |
| UBS | Maintain | Buy | 2026-01-07 |
Raymond James Financial, Inc. Grades
This table lists recent grades and actions from established firms for Raymond James.
| Grading Company | Action | New Grade | Date |
|---|---|---|---|
| TD Cowen | Maintain | Hold | 2026-01-14 |
| Morgan Stanley | Maintain | Equal Weight | 2025-12-22 |
| B of A Securities | Maintain | Neutral | 2025-12-10 |
| JMP Securities | Maintain | Market Outperform | 2025-10-23 |
| BMO Capital | Maintain | Market Perform | 2025-10-23 |
| JP Morgan | Maintain | Neutral | 2025-10-23 |
| TD Cowen | Maintain | Hold | 2025-10-23 |
| Keefe, Bruyette & Woods | Maintain | Market Perform | 2025-10-23 |
| JMP Securities | Maintain | Market Outperform | 2025-10-09 |
| JP Morgan | Maintain | Neutral | 2025-10-07 |
Which company has the best grades?
The Charles Schwab Corporation holds consistently higher grades with multiple Buy and Overweight ratings. Raymond James Financial shows more Hold and Neutral grades. Schwab’s superior ratings may signal stronger institutional confidence, potentially influencing investor sentiment positively.
Risks specific to each company
The following categories identify critical pressure points and systemic threats facing both firms in the 2026 market environment:
1. Market & Competition
The Charles Schwab Corporation
- Dominates retail brokerage with broad service portfolio but faces intense competition from fintech disruptors.
Raymond James Financial, Inc.
- Focuses on private client and capital markets, contending with pressure from larger rivals and evolving wealth management trends.
2. Capital Structure & Debt
The Charles Schwab Corporation
- Maintains favorable debt metrics, low leverage supports financial flexibility.
Raymond James Financial, Inc.
- Moderate debt-to-equity ratio (0.36) signals manageable leverage but requires monitoring amid rising interest rates.
3. Stock Volatility
The Charles Schwab Corporation
- Beta of 0.91 suggests below-market volatility, offering relative stability to investors.
Raymond James Financial, Inc.
- Beta near 1 (0.996) implies stock moves closely with market, indicating typical sector risk exposure.
4. Regulatory & Legal
The Charles Schwab Corporation
- Subject to US financial regulations; compliance complexity grows with banking and advisory services.
Raymond James Financial, Inc.
- Faces regulatory scrutiny in multiple jurisdictions, including US, Canada, and Europe, increasing legal risk exposure.
5. Supply Chain & Operations
The Charles Schwab Corporation
- Operations rely on advanced technology infrastructure; risks include cybersecurity and tech integration challenges.
Raymond James Financial, Inc.
- Operational risks center on managing diverse service platforms and integration of private equity investments.
6. ESG & Climate Transition
The Charles Schwab Corporation
- ESG initiatives advancing but industry-wide pressure to enhance climate-related disclosures and sustainable investment products.
Raymond James Financial, Inc.
- Faces increasing demand for ESG-compliant portfolios; must balance growth with environmental and social governance standards.
7. Geopolitical Exposure
The Charles Schwab Corporation
- Limited international footprint reduces exposure but also limits global diversification opportunities.
Raymond James Financial, Inc.
- Broader international presence in North America and Europe increases geopolitical risk amid regulatory and economic shifts.
Which company shows a better risk-adjusted profile?
The Charles Schwab Corporation’s strongest risk is regulatory complexity due to its diverse service lines. For Raymond James, capital structure and financial distress pose the greatest risk, highlighted by its Altman Z-score in the distress zone. Schwab’s lower volatility and superior financial stability deliver a better risk-adjusted profile. Schwab’s very strong Piotroski score (9) versus Raymond James’s average (6) confirms Schwab’s healthier financial footing in 2026.
Final Verdict: Which stock to choose?
The Charles Schwab Corporation excels as a cash-generating powerhouse with strong income growth and a very favorable rating profile. Its main point of vigilance is the declining ROIC trend, signaling potential challenges in capital efficiency. Schwab suits investors seeking aggressive growth with a focus on robust profitability momentum.
Raymond James Financial, Inc. benefits from a very favorable moat characterized by growing ROIC above its cost of capital, reflecting a sustainable competitive advantage. It offers greater stability than Schwab, albeit with more moderate earnings growth. Raymond James fits well within GARP (Growth at a Reasonable Price) portfolios that value both growth and capital discipline.
If you prioritize aggressive growth and strong income statement momentum, Schwab is the compelling choice due to its superior profitability and cash flow generation. However, if you seek better capital efficiency and a durable moat with steadier returns, Raymond James offers better stability and value creation. Both stocks present distinct strategic profiles requiring alignment with your investment objectives.
Disclaimer: Investment carries a risk of loss of initial capital. The past performance is not a reliable indicator of future results. Be sure to understand risks before making an investment decision.
Go Further
I encourage you to read the complete analyses of The Charles Schwab Corporation and Raymond James Financial, Inc. to enhance your investment decisions: