Home > Comparison > Financial Services > HOOD vs RJF
The strategic rivalry between Robinhood Markets, Inc. and Raymond James Financial, Inc. shapes the evolution of the financial services sector. Robinhood operates as a digital-first, platform-based disruptor focusing on retail investment accessibility. In contrast, Raymond James is a diversified financial powerhouse with broad wealth management and capital markets operations. This analysis aims to identify which approach offers a superior risk-adjusted return, guiding investors seeking durable exposure within financial capital markets.

Table of contents
Companies Overview
Robinhood Markets, Inc. and Raymond James Financial, Inc. hold pivotal roles in the evolving financial services landscape.
Robinhood Markets, Inc.: Democratizing Access to Financial Markets
Robinhood Markets, Inc. operates a digital trading platform that enables retail investors to trade stocks, ETFs, options, gold, and cryptocurrencies. Its core revenue stems from order flow payments and premium subscription services. In 2026, the company emphasizes expanding its user education and engagement tools, aiming to deepen market participation among younger and less experienced investors.
Raymond James Financial, Inc.: Diversified Wealth Management Powerhouse
Raymond James Financial, Inc. delivers a broad spectrum of wealth management and capital markets services to individuals and institutions across North America and Europe. Revenue derives from advisory fees, underwriting, brokerage commissions, and banking operations. The firm’s strategic focus remains on enhancing its private client group and asset management capabilities, reinforcing its full-service advisory model in a competitive market.
Strategic Collision: Similarities & Divergences
Robinhood and Raymond James both operate in financial capital markets but embody contrasting philosophies. Robinhood champions a technology-driven, low-cost trading ecosystem, while Raymond James relies on personalized advisory and diversified financial services. Their primary battleground is client acquisition and retention in wealth management. Investors face a choice between Robinhood’s high-growth, retail-centric profile and Raymond James’ stable, fee-based, full-service franchise.
Income Statement Comparison
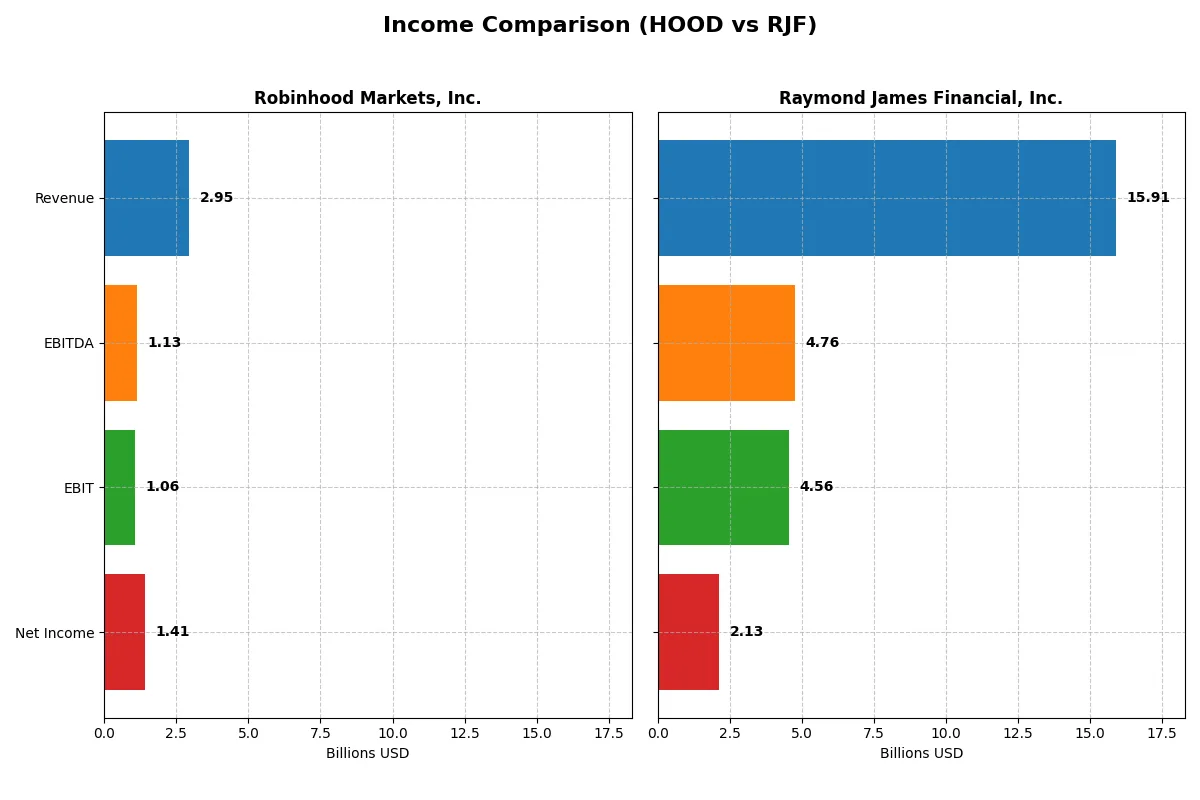
The following data dissects the core profitability and scalability of both corporate engines to reveal who dominates the bottom line:
| Metric | Robinhood Markets, Inc. (HOOD) | Raymond James Financial, Inc. (RJF) |
|---|---|---|
| Revenue | 2.95B | 15.91B |
| Cost of Revenue | 504M | 1.88B |
| Operating Expenses | 1.39B | 9.47B |
| Gross Profit | 2.45B | 14.03B |
| EBITDA | 1.13B | 4.76B |
| EBIT | 1.06B | 4.56B |
| Interest Expense | 0 | 1.85B |
| Net Income | 1.41B | 2.14B |
| EPS | 1.60 | 10.53 |
| Fiscal Year | 2024 | 2025 |
Income Statement Analysis: The Bottom-Line Duel
This income statement comparison reveals which company runs a more efficient and profitable corporate engine in recent years.
Robinhood Markets, Inc. Analysis
Robinhood’s revenue surged from 958M in 2020 to 2.95B in 2024, reflecting rapid growth. Net income swung from a 3M profit in 2020 to a 1.41B profit in 2024, showing remarkable turnaround. Its gross margin stays robust at 82.9%, and net margin impressively expands to 47.8%, signaling strong operational leverage and margin momentum in 2024.
Raymond James Financial, Inc. Analysis
Raymond James grew revenue steadily from 9.78B in 2021 to 15.91B in 2025, marking solid expansion. Net income climbed from 1.40B in 2021 to 2.13B in 2025, but net margin remains modest at 13.4%. Its gross margin is healthy at 88.2%, though interest expense at 11.6% weighs on net margins. Efficiency improves, but margin gains are less dramatic.
Rapid Growth and Margin Expansion vs. Steady Scale and Consistency
Robinhood outpaces Raymond James in growth and margin expansion, turning a deep loss into strong profitability with nearly 48% net margin in 2024. Raymond James delivers consistent revenue scale and stable profits but with lower net margin pressure from interest costs. Robinhood’s profile suits investors seeking dynamic margin expansion, while Raymond James offers steady financial services scale.
Financial Ratios Comparison
These vital ratios act as a diagnostic tool to expose underlying fiscal health, valuation premiums, and capital efficiency for the companies compared below:
| Ratios | Robinhood Markets, Inc. (HOOD) | Raymond James Financial, Inc. (RJF) |
|---|---|---|
| ROE | 17.7% | 17.1% |
| ROIC | 6.8% | 15.9% |
| P/E | 23.3 | 16.3 |
| P/B | 4.1 | 2.8 |
| Current Ratio | 1.39 | 0.32 |
| Quick Ratio | 1.39 | 0.32 |
| D/E | 0.94 | 0.36 |
| Debt-to-Assets | 28.5% | 5.2% |
| Interest Coverage | 0 | 2.5 |
| Asset Turnover | 0.11 | 0.18 |
| Fixed Asset Turnover | 21.2 | 10.3 |
| Payout ratio | 0% | 19.5% |
| Dividend yield | 0% | 1.2% |
| Fiscal Year | 2024 | 2025 |
Efficiency & Valuation Duel: The Vital Signs
Financial ratios act as a company’s DNA, uncovering hidden risks and operational strengths that shape investor outcomes.
Robinhood Markets, Inc.
Robinhood posts a strong ROE of 17.7% with a robust net margin near 48%, signaling solid profitability. Its P/E ratio of 23.3 suggests a moderately valued stock, though a high price-to-book of 4.12 raises caution. The company reinvests heavily in R&D, foregoing dividends to fuel growth, which suits a growth-focused profile.
Raymond James Financial, Inc.
Raymond James delivers a comparable ROE of 17.1% but with a lower net margin of 13.4%, reflecting steadier profitability. At a P/E of 16.3 and price-to-book near 2.8, the stock appears more attractively valued. The firm pays a modest 1.19% dividend, blending income with a disciplined capital structure and efficient operations.
Balanced Growth vs. Value Stability
Both firms exhibit slightly favorable ratio profiles, yet Raymond James offers a better valuation with solid returns and dividends. Robinhood’s high margin and reinvestment signal growth potential but come with valuation and leverage risks. Growth investors may favor Robinhood’s aggressive stance; value seekers might prefer Raymond James’s steadier metrics.
Which one offers the Superior Shareholder Reward?
I compare Robinhood Markets (HOOD) and Raymond James Financial (RJF) on their shareholder reward strategies. HOOD pays no dividends and shows negative free cash flow, focusing on reinvestment amid rising margins but lacks buyback activity. RJF yields a modest 1.2% dividend with a sustainable 19% payout ratio, supported by strong free cash flow of 9.4B and consistent buybacks enhancing total returns. RJF’s balanced distribution and steady profitability offer a more attractive, sustainable shareholder reward profile for 2026.
Comparative Score Analysis: The Strategic Profile
The radar chart reveals the fundamental DNA and trade-offs of Robinhood Markets, Inc. and Raymond James Financial, Inc., highlighting their core financial strengths and weaknesses:
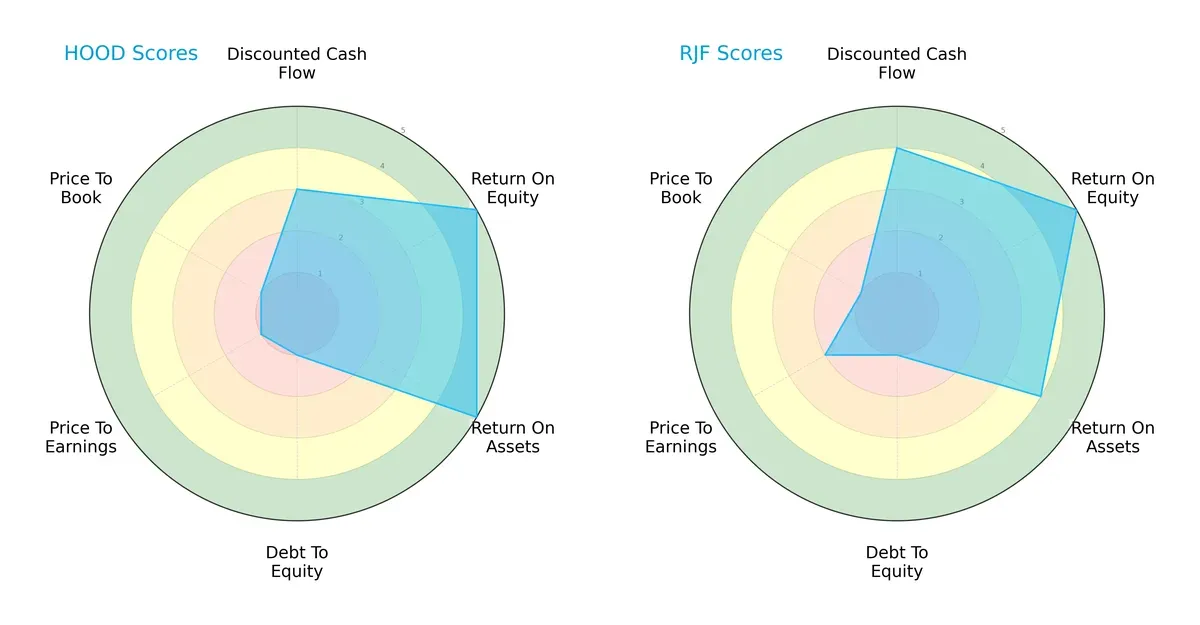
Robinhood shows strong operational efficiency with top scores in ROE and ROA but struggles with valuation and leverage, scoring very low on debt-to-equity and valuation metrics. Raymond James offers a more balanced profile with favorable DCF and valuation scores, though it shares a weak debt-to-equity position with Robinhood. Overall, Raymond James leans on a steadier valuation and cash flow foundation, while Robinhood depends heavily on operational efficiency.
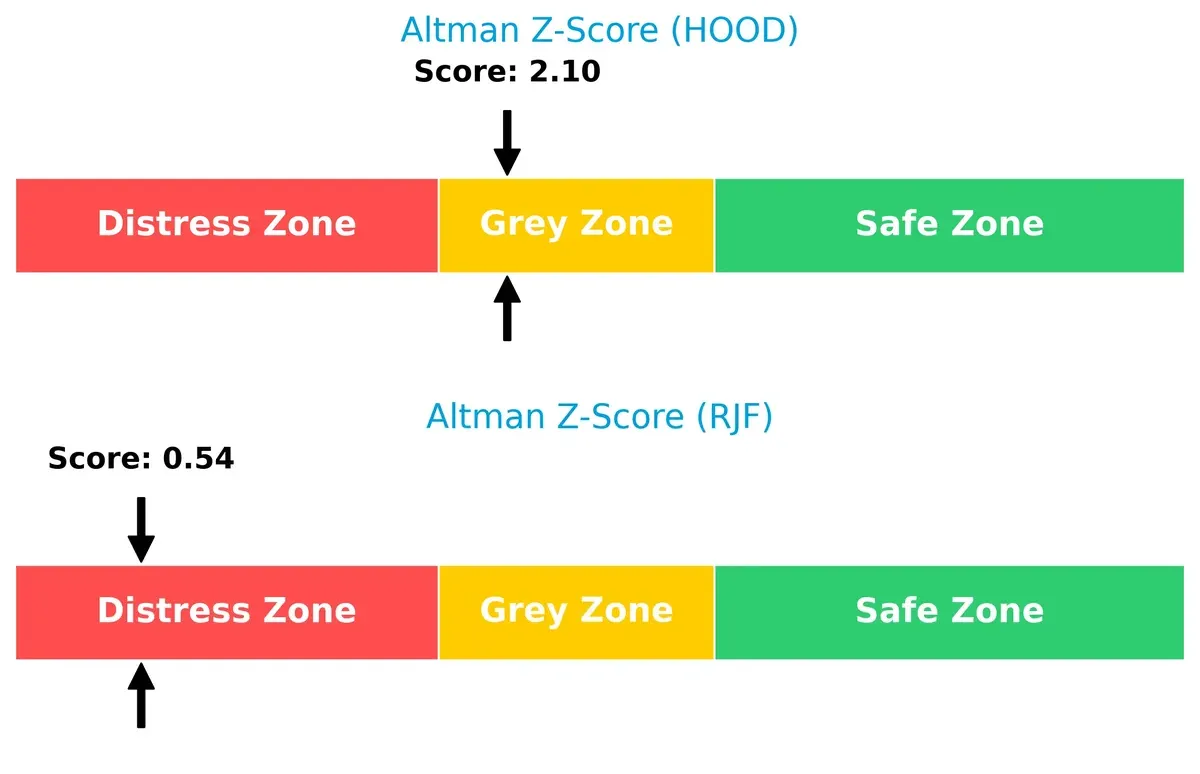
Bankruptcy Risk: Solvency Showdown
Raymond James scores 0.54 in the Altman Z-Score distress zone, suggesting high bankruptcy risk. Robinhood, at 2.10 in the grey zone, faces moderate risk but is better positioned for survival in this cycle:
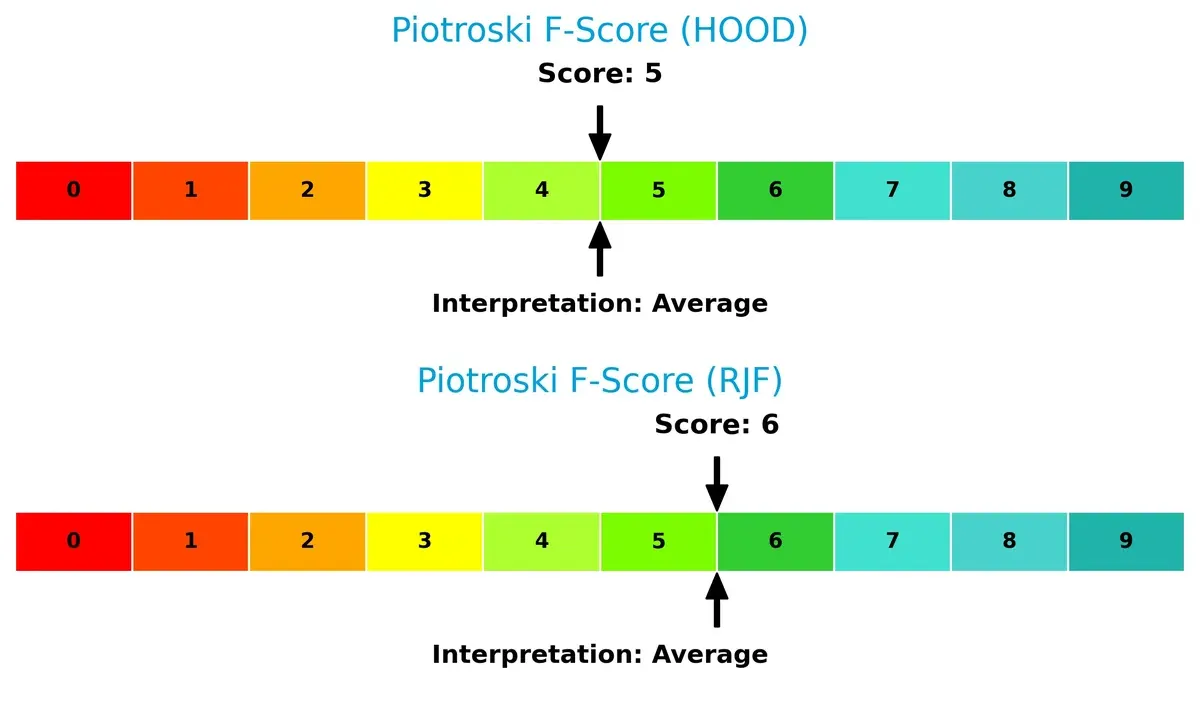
Financial Health: Quality of Operations
Both firms show average Piotroski F-Scores, with Raymond James slightly ahead at 6 versus Robinhood’s 5, indicating marginally stronger internal financial metrics. Neither signals critical red flags, but neither stands out as exceptionally robust:
How are the two companies positioned?
This section dissects the operational DNA of HOOD and RJF by comparing their revenue distribution and internal dynamics. The goal is to confront their economic moats to identify the most resilient competitive advantage today.
Revenue Segmentation: The Strategic Mix
This visual comparison dissects how Robinhood Markets, Inc. and Raymond James Financial, Inc. diversify their income streams and where their primary sector bets lie:
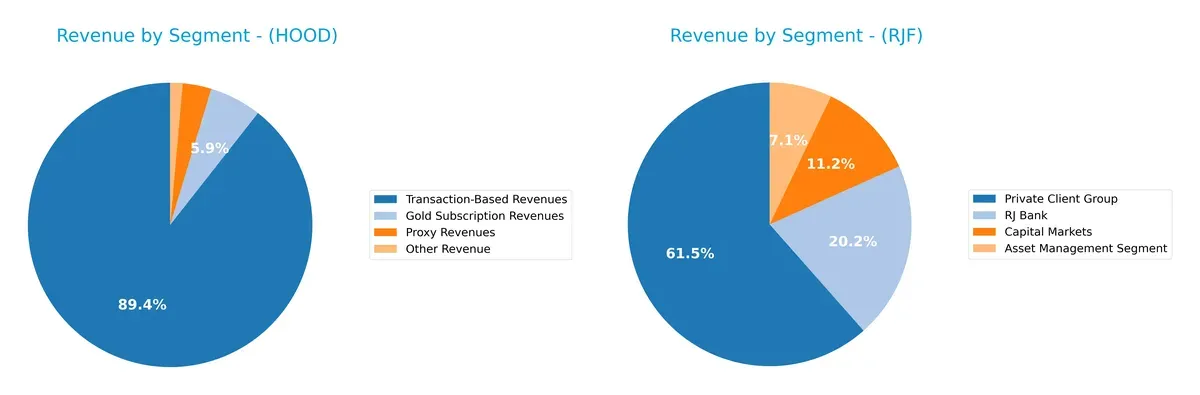
Robinhood anchors its revenue in transaction-based revenues at $1.65B, dwarfing its other segments like Gold Subscriptions at $109M. Raymond James shows a more diversified mix, with Private Client Group revenue dominating at $10.28B but balanced by RJ Bank ($3.38B), Capital Markets ($1.87B), and Asset Management ($1.19B). Robinhood’s heavy concentration in transaction fees signals risk from market volatility, while Raymond James leverages ecosystem lock-in with broader financial services.
Strengths and Weaknesses Comparison
This table compares the strengths and weaknesses of Robinhood Markets, Inc. and Raymond James Financial, Inc.:
Robinhood Strengths
- High net margin at 47.81%
- Favorable ROE at 17.7%
- Low debt-to-assets at 28.5%
- Strong interest coverage (infinite)
- Diverse revenues from subscriptions and transactions
Raymond James Strengths
- Solid ROE at 17.08%
- Favorable ROIC at 15.88%
- Low debt-to-assets at 5.15%
- Diversified revenue streams across client services, capital markets, and banking
- Geographic presence in US, Canada, Europe
Robinhood Weaknesses
- WACC of 14.43% above ROIC at 6.79%
- Unfavorable PB at 4.12
- Low asset turnover at 0.11
- No dividend yield
- Neutral current ratio at 1.39
Raymond James Weaknesses
- Low current and quick ratios at 0.32 indicating liquidity concerns
- WACC of 11.21% exceeds ROIC slightly
- Unfavorable asset turnover at 0.18
- Neutral valuation multiples (PE 16.33, PB 2.79)
Both companies show balanced profiles with notable profitability and moderate leverage. Robinhood exhibits high margins and strong interest coverage but struggles with capital efficiency and valuation. Raymond James demonstrates robust capital allocation and geographic diversification but reveals liquidity risks and slightly unfavorable capital costs. These factors shape their strategic positioning in financial services.
The Moat Duel: Analyzing Competitive Defensibility
A structural moat is the only safeguard for a company’s long-term profits against relentless competitive pressure. Let’s dissect the moats of two financial sector players:
Robinhood Markets, Inc.: User Engagement & Cost Advantage
Robinhood leverages low-cost trading and intuitive platform design as its moat. Despite stable profitability, it currently destroys value with ROIC below WACC. Its rapid revenue and margin growth in 2024 signals potential moat deepening if it converts growth into lasting returns.
Raymond James Financial, Inc.: Diversified Services & Capital Efficiency
Raymond James boasts a traditional financial services moat with a diversified client base and growing ROIC well above WACC. Its steady expansion in North America and Europe underpins durable competitive strength and potential to disrupt through asset management and capital markets.
Verdict: Cost Leadership vs. Capital Discipline
Raymond James holds the deeper moat, evidenced by a growing ROIC that exceeds WACC by 4.7% and robust geographic expansion. Robinhood’s cost advantage drives growth but fails to translate into value creation yet. Raymond James is better equipped to defend market share long term.
Which stock offers better returns?
Over the past year, Robinhood Markets, Inc. surged sharply before decelerating, while Raymond James Financial, Inc. showed steady gains with accelerating momentum.
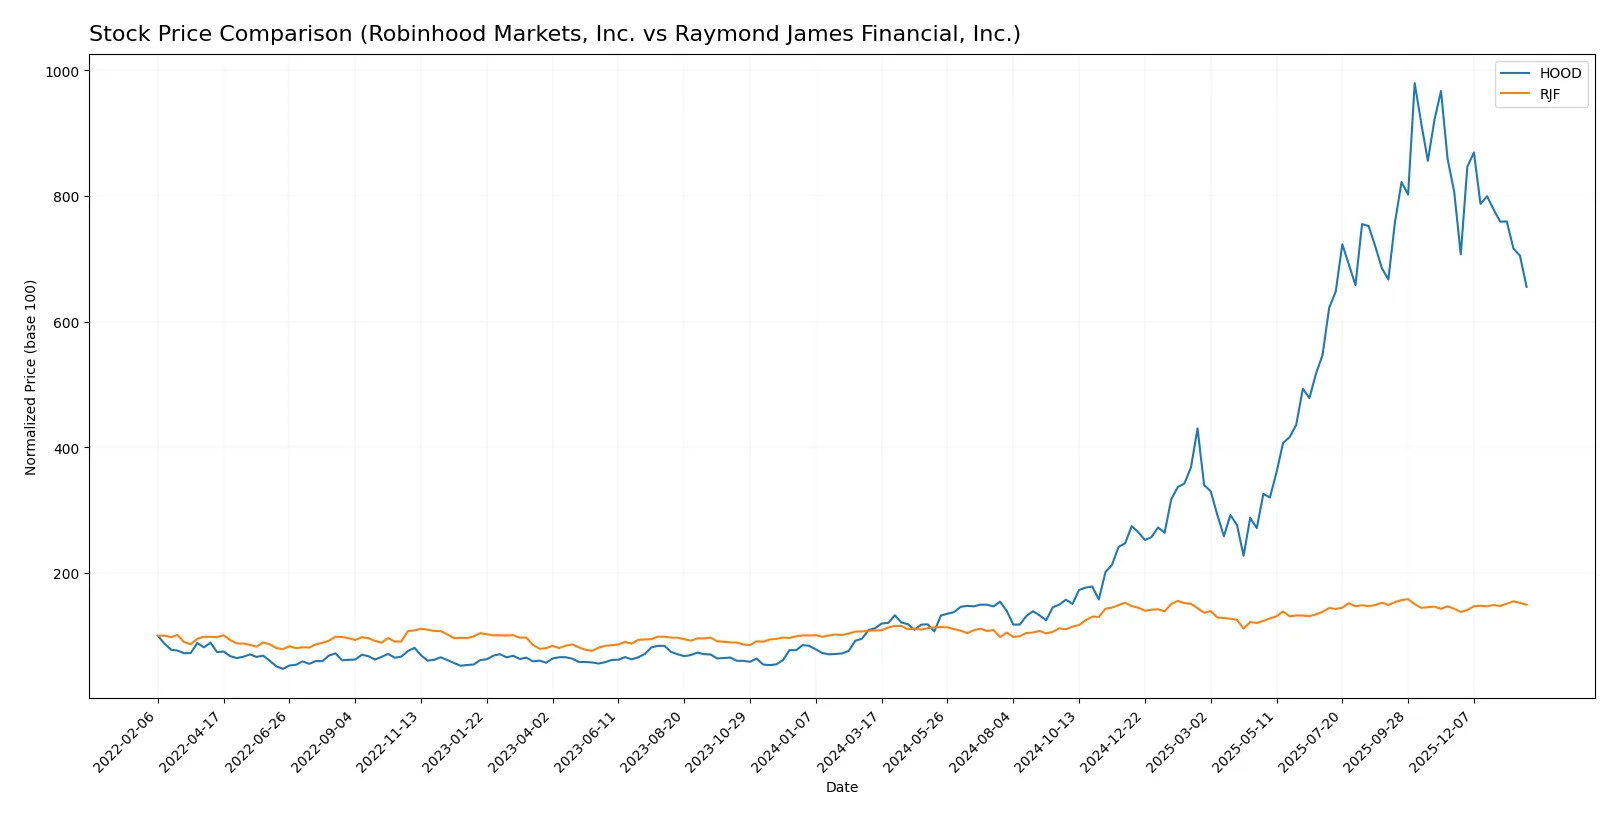
Trend Comparison
Robinhood Markets, Inc. posted a 485.18% price increase over 12 months, marking a bullish trend but with recent deceleration and an 18.79% decline in the last 2.5 months.
Raymond James Financial, Inc. recorded a 37.99% gain over the same period, maintaining a bullish trend with accelerating growth and a 4.49% rise in the recent 2.5 months.
Robinhood’s overall return far outpaces Raymond James, though recent weakness contrasts with Raymond James’s modest but stable upward trend.
Target Prices
Analysts present a confident target price consensus for Robinhood Markets, Inc. and Raymond James Financial, Inc.
| Company | Target Low | Target High | Consensus |
|---|---|---|---|
| Robinhood Markets, Inc. | 135 | 170 | 151.25 |
| Raymond James Financial, Inc. | 176 | 198 | 187 |
The consensus targets imply significant upside for both stocks versus current prices: Robinhood at $99.48 and Raymond James at $165.86. Analysts expect strong sector performance ahead.

Don’t Let Luck Decide Your Entry Point
Optimize your entry points with our advanced ProRealTime indicators. You’ll get efficient buy signals with precise price targets for maximum performance. Start outperforming now!
How do institutions grade them?
Here is a comparative overview of institutional grades assigned to Robinhood Markets, Inc. and Raymond James Financial, Inc.:
Robinhood Markets, Inc. Grades
This table summarizes recent grades and actions from reputable grading firms for Robinhood Markets, Inc.
| Grading Company | Action | New Grade | Date |
|---|---|---|---|
| Needham | Maintain | Buy | 2026-01-28 |
| Barclays | Maintain | Overweight | 2026-01-08 |
| Morgan Stanley | Maintain | Equal Weight | 2025-12-22 |
| Barclays | Maintain | Overweight | 2025-12-12 |
| Cantor Fitzgerald | Maintain | Overweight | 2025-12-11 |
| B of A Securities | Maintain | Buy | 2025-12-10 |
| Needham | Maintain | Buy | 2025-12-05 |
| Needham | Maintain | Buy | 2025-11-26 |
| Citizens | Maintain | Market Outperform | 2025-11-07 |
| Mizuho | Maintain | Outperform | 2025-11-06 |
Raymond James Financial, Inc. Grades
Below are the latest institutional grades and actions for Raymond James Financial, Inc. from established grading entities.
| Grading Company | Action | New Grade | Date |
|---|---|---|---|
| TD Cowen | Maintain | Hold | 2026-01-14 |
| Morgan Stanley | Maintain | Equal Weight | 2025-12-22 |
| B of A Securities | Maintain | Neutral | 2025-12-10 |
| BMO Capital | Maintain | Market Perform | 2025-10-23 |
| Keefe, Bruyette & Woods | Maintain | Market Perform | 2025-10-23 |
| TD Cowen | Maintain | Hold | 2025-10-23 |
| JMP Securities | Maintain | Market Outperform | 2025-10-23 |
| JP Morgan | Maintain | Neutral | 2025-10-23 |
| JMP Securities | Maintain | Market Outperform | 2025-10-09 |
| JP Morgan | Maintain | Neutral | 2025-10-07 |
Which company has the best grades?
Robinhood Markets consistently receives more favorable ratings, including multiple “Buy” and “Overweight” grades. Raymond James Financial’s grades mostly range from “Hold” to “Market Perform.” This suggests stronger institutional confidence in Robinhood’s near-term prospects, potentially influencing investor sentiment accordingly.
Risks specific to each company
The following categories identify the critical pressure points and systemic threats facing both firms in the 2026 market environment:
1. Market & Competition
Robinhood Markets, Inc.
- Faces intense competition from established brokers and fintech disruptors; high beta (2.45) signals sensitivity to market swings.
Raymond James Financial, Inc.
- Competes in diversified financial services with stable market positioning; beta near 1.0 reflects moderate market sensitivity.
2. Capital Structure & Debt
Robinhood Markets, Inc.
- Debt-to-equity ratio near 0.94 shows moderate leverage; interest coverage is infinite indicating strong ability to service debt.
Raymond James Financial, Inc.
- Lower leverage with debt-to-equity around 0.36; interest coverage at 2.47 suggests tighter but manageable debt servicing.
3. Stock Volatility
Robinhood Markets, Inc.
- High beta of 2.45 exposes investors to notable volatility; wide trading range (29.66–153.86) signals elevated price swings.
Raymond James Financial, Inc.
- Beta of 1.00 and narrower price range (117.57–177.66) indicate relatively stable stock price movements.
4. Regulatory & Legal
Robinhood Markets, Inc.
- Subject to regulatory scrutiny typical for fintech platforms, including compliance risks in crypto and retail trading.
Raymond James Financial, Inc.
- Faces regulatory oversight across banking, asset management, and capital markets with complex compliance demands.
5. Supply Chain & Operations
Robinhood Markets, Inc.
- Operates a digital platform with reliance on technology infrastructure and cybersecurity resilience.
Raymond James Financial, Inc.
- Depends on broad operational infrastructure supporting diverse financial services and large employee base (~19K).
6. ESG & Climate Transition
Robinhood Markets, Inc.
- Early stage on ESG integration, with investor pressure to enhance sustainability reporting and risk management.
Raymond James Financial, Inc.
- More mature ESG initiatives due to size and institutional client focus, facing evolving climate-related financial risks.
7. Geopolitical Exposure
Robinhood Markets, Inc.
- Primarily US domestic focus, limiting direct geopolitical risks but sensitive to US regulatory shifts.
Raymond James Financial, Inc.
- Operates in US, Canada, and Europe, exposing it to cross-border regulatory and geopolitical uncertainties.
Which company shows a better risk-adjusted profile?
Robinhood’s highest risk is market volatility amplified by its high beta and fintech regulatory challenges. Raymond James’s greatest risk is its capital structure coupled with exposure to multi-jurisdictional regulatory complexities. Despite Robinhood’s volatility, its strong interest coverage and tech-driven model offer agility. Raymond James has steadier stock behavior but faces strain from low liquidity ratios and a distress-level Altman Z-score. Overall, Robinhood shows a better risk-adjusted profile due to superior debt servicing capacity and lower bankruptcy risk despite market sensitivity.
Final Verdict: Which stock to choose?
Robinhood Markets, Inc. (HOOD) commands attention with its rapid growth and impressive efficiency in scaling revenues and margins. Its superpower lies in innovative user engagement and high net margins. A point of vigilance remains its inability to generate returns above its cost of capital, signaling value destruction risk. It suits aggressive growth portfolios willing to embrace volatility.
Raymond James Financial, Inc. (RJF) benefits from a strong economic moat built on consistent value creation and durable profitability. Its competitive advantage is reflected in a growing ROIC well above WACC, paired with a stable dividend yield. Compared to HOOD, RJF offers better financial stability, fitting well in GARP (Growth at a Reasonable Price) portfolios seeking steady returns.
If you prioritize rapid expansion and market disruption, Robinhood might be the compelling choice due to its top-line acceleration and margin gains. However, if you seek durable competitive advantage and superior capital efficiency, Raymond James outshines with better stability and value creation. Both carry risks, so aligning choice with your risk tolerance and investment horizon is essential.
Disclaimer: Investment carries a risk of loss of initial capital. The past performance is not a reliable indicator of future results. Be sure to understand risks before making an investment decision.
Go Further
I encourage you to read the complete analyses of Robinhood Markets, Inc. and Raymond James Financial, Inc. to enhance your investment decisions: