Home > Comparison > Healthcare > TMO vs DGX
The strategic rivalry between Thermo Fisher Scientific Inc. and Quest Diagnostics Incorporated defines the current trajectory of the healthcare diagnostics sector. Thermo Fisher operates as a capital-intensive life sciences solutions powerhouse, while Quest Diagnostics focuses on diagnostic testing and information services. This head-to-head reflects a battle between broad scientific innovation and specialized clinical diagnostics. This analysis will determine which corporate trajectory offers superior risk-adjusted potential for a diversified healthcare portfolio.

Table of contents
Companies Overview
Thermo Fisher Scientific and Quest Diagnostics are key players shaping the medical diagnostics and research landscape.
Thermo Fisher Scientific Inc.: Life Sciences Solutions Powerhouse
Thermo Fisher Scientific dominates the Medical – Diagnostics & Research sector with a broad portfolio spanning life sciences solutions, analytical instruments, specialty diagnostics, and biopharma services. Its core revenue engine relies on reagents, instruments, and consumables for research and drug production, serving global markets. In 2026, the company sharpened its strategic focus on integrated solutions across biosciences, pharmaceuticals, and clinical diagnostics to deepen market penetration.
Quest Diagnostics Incorporated: Diagnostic Information Leader
Quest Diagnostics is a leading provider of diagnostic testing and information services in the U.S. and abroad. Its revenue primarily comes from routine and advanced clinical testing, supported by a broad network of labs and patient service centers. In 2026, Quest concentrated on expanding diagnostic capabilities and IT solutions to enhance service delivery for healthcare organizations and life insurance risk assessments.
Strategic Collision: Similarities & Divergences
Both companies operate within medical diagnostics but differ in approach. Thermo Fisher pursues a diversified product ecosystem spanning research to clinical applications, while Quest focuses on diagnostic service delivery and information technology. Their primary battleground lies in clinical diagnostics where market share depends on innovation and operational scale. Thermo Fisher presents a capital-intensive, broad-moat profile; Quest offers a service-heavy, niche-advantaged investment character.
Income Statement Comparison
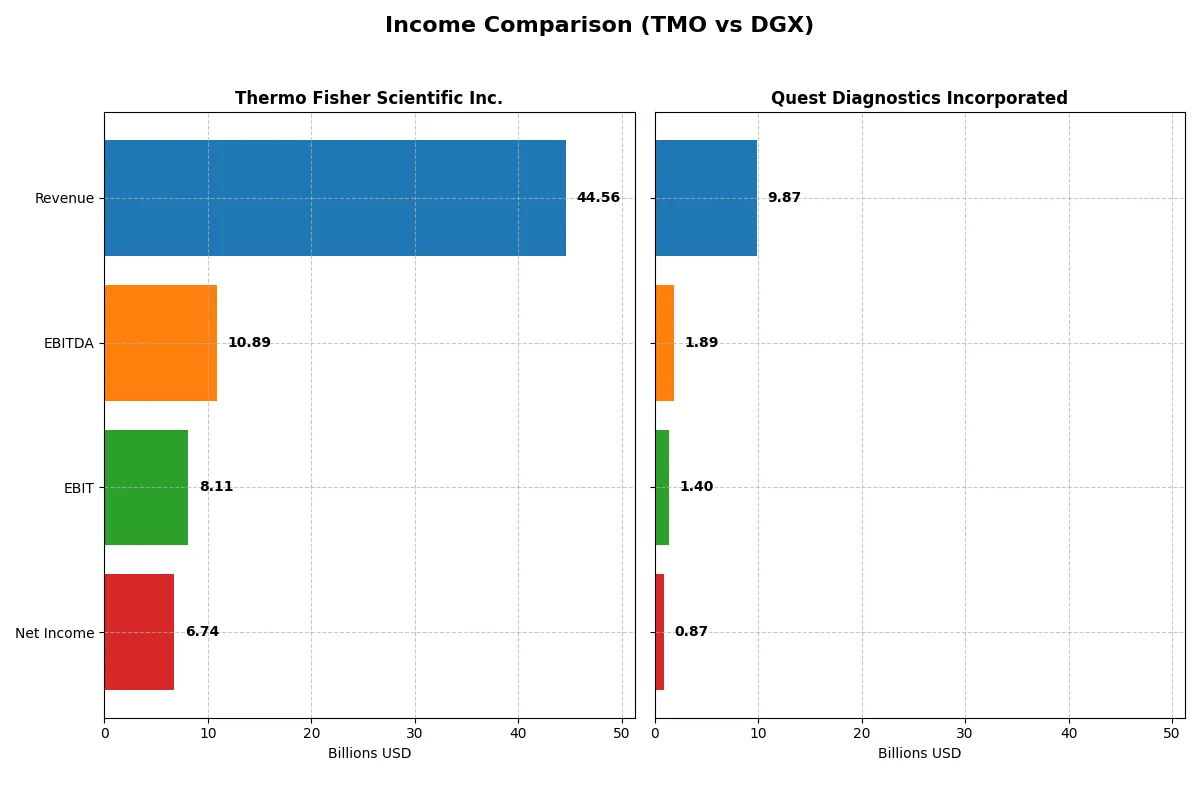
This data dissects the core profitability and scalability of both corporate engines to reveal who dominates the bottom line:
| Metric | Thermo Fisher Scientific Inc. (TMO) | Quest Diagnostics Incorporated (DGX) |
|---|---|---|
| Revenue | 44.6B | 9.87B |
| Cost of Revenue | 27.8B | 6.63B |
| Operating Expenses | 8.67B | 1.90B |
| Gross Profit | 16.8B | 3.24B |
| EBITDA | 10.9B | 1.89B |
| EBIT | 8.11B | 1.40B |
| Interest Expense | 1.42B | 0.23B |
| Net Income | 6.74B | 0.87B |
| EPS | 17.77 | 7.80 |
| Fiscal Year | 2025 | 2024 |
Income Statement Analysis: The Bottom-Line Duel
This income statement comparison uncovers how efficiently each company transforms revenue into profit and sustains margin strength over time.
Thermo Fisher Scientific Inc. Analysis
Thermo Fisher’s revenue climbed steadily to $44.6B in 2025, reflecting a 3.9% one-year growth. Net income, however, declined over the period to $6.7B, signaling margin pressure. Its 37.7% gross margin remains robust but contracted year-over-year, while net margin held at a favorable 15.1%. Efficiency dipped slightly as EBIT fell 6.7%, yet EPS rose 7.3%, suggesting improved share count management.
Quest Diagnostics Incorporated Analysis
Quest Diagnostics generated $9.9B revenue in 2024, marking moderate growth of 6.7%. Net income dropped sharply to $871M, driving net margin down to 8.8%. Its gross margin of 32.9% and EBIT margin of 14.2% remain sound but reflect tighter profitability. Operating expenses scaled favorably with revenue, supporting a modest EBIT increase of 8.4%, while EPS grew 2.3%, showing stable shareholder returns despite net margin headwinds.
Margin Resilience vs. Revenue Expansion
Thermo Fisher excels in margin resilience with a stronger gross and net margin profile despite recent profit softness. Quest Diagnostics demonstrates steadier revenue growth but struggles with sharper net income declines. Thermo Fisher’s superior profitability and scale make it the clearer fundamental winner. Investors seeking a robust margin engine will find Thermo Fisher’s profile more compelling.
Financial Ratios Comparison
These vital ratios act as a diagnostic tool to expose the underlying fiscal health, valuation premiums, and capital efficiency of the companies compared below:
| Ratios | Thermo Fisher Scientific Inc. (TMO) | Quest Diagnostics Incorporated (DGX) |
|---|---|---|
| ROE | 12.6% | 12.9% |
| ROIC | 7.6% | 7.0% |
| P/E | 32.3 | 19.2 |
| P/B | 4.08 | 2.47 |
| Current Ratio | 1.89 | 1.10 |
| Quick Ratio | 1.53 | 1.02 |
| D/E | 0.74 | 1.05 |
| Debt-to-Assets | 35.7% | 43.9% |
| Interest Coverage | 5.7x | 6.0x |
| Asset Turnover | 0.40 | 0.61 |
| Fixed Asset Turnover | 4.22 | 3.57 |
| Payout Ratio | 9.4% | 38.0% |
| Dividend Yield | 0.29% | 1.98% |
| Fiscal Year | 2025 | 2024 |
Efficiency & Valuation Duel: The Vital Signs
Financial ratios act as a company’s DNA, revealing hidden risks and operational excellence behind headline figures.
Thermo Fisher Scientific Inc.
Thermo Fisher posts a solid 12.6% ROE and a strong 15.1% net margin, indicating efficient profitability. However, its P/E of 32.3 signals an expensive valuation, stretched beyond typical sector norms. The company returns value modestly via a low 0.29% dividend yield, favoring reinvestment into R&D and growth initiatives.
Quest Diagnostics Incorporated
Quest Diagnostics delivers a comparable 12.9% ROE but with a thinner 8.8% net margin, reflecting moderate profitability. Its P/E of 19.2 appears fair, not demanding a valuation premium. The stock provides a 1.98% dividend yield, offering steady shareholder returns while maintaining a neutral leverage profile.
Valuation Premium vs. Balanced Profitability
Thermo Fisher commands a premium valuation justified by superior margins and reinvestment capacity, yet it carries valuation risk. Quest Diagnostics balances moderate profitability with a fairer price and consistent dividends. Investors seeking growth might prefer Thermo Fisher’s profile; those favoring income and valuation discipline may lean toward Quest Diagnostics.
Which one offers the Superior Shareholder Reward?
Thermo Fisher Scientific (TMO) delivers a conservative 0.29% dividend yield with a low 9.4% payout ratio, preserving 80%+ of free cash flow for growth and buybacks. Its disciplined buyback program boosts returns sustainably. Quest Diagnostics (DGX) pays a hefty 1.98% yield but with a 38% payout ratio, limiting reinvestment. DGX’s buybacks are less aggressive, risking slower capital appreciation. Historically, TMO’s balanced distribution and high-quality cash flow underpin superior long-term shareholder reward in 2026. I favor TMO for total return investors seeking growth plus yield.
Comparative Score Analysis: The Strategic Profile
The radar chart reveals the fundamental DNA and trade-offs of Thermo Fisher Scientific Inc. and Quest Diagnostics Incorporated:
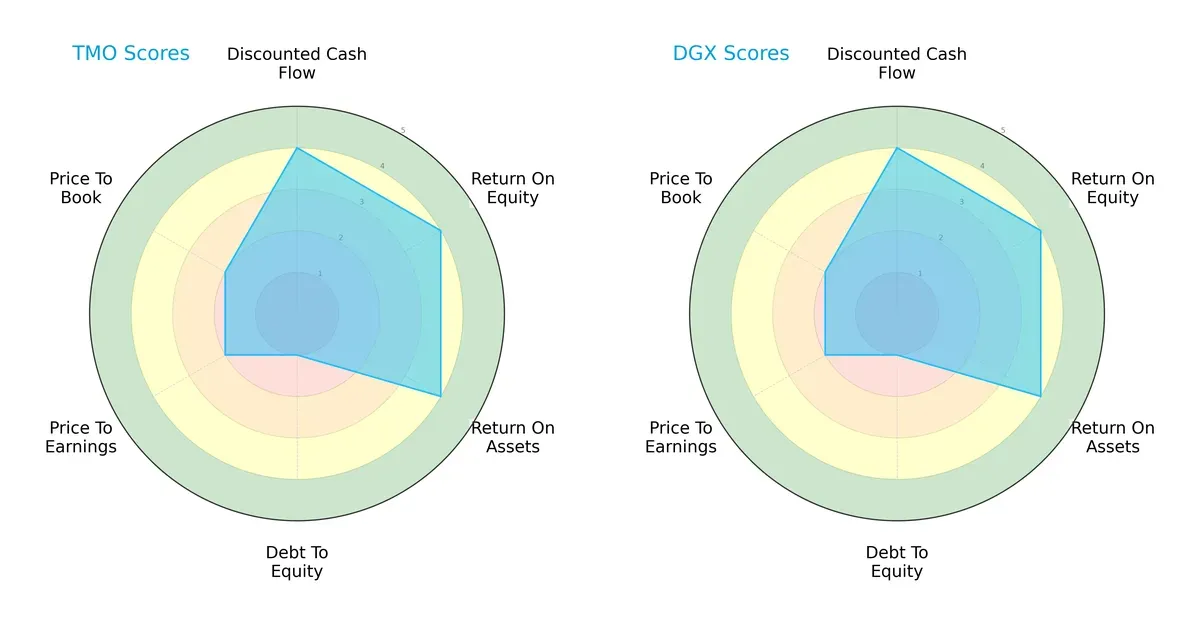
Both firms share identical scores across key metrics: a strong DCF (4), robust ROE and ROA (4 each), but very weak debt-to-equity positioning (1) that signals financial leverage risks. Their moderate valuation scores (PE and PB at 2) suggest neither is deeply undervalued. This parity shows no clear advantage, with both companies relying on operational efficiency rather than balance sheet strength.
Bankruptcy Risk: Solvency Showdown
Thermo Fisher Scientific (Z=3.09) and Quest Diagnostics (Z=3.26) both reside safely above the distress threshold, indicating low bankruptcy risk in this cycle:
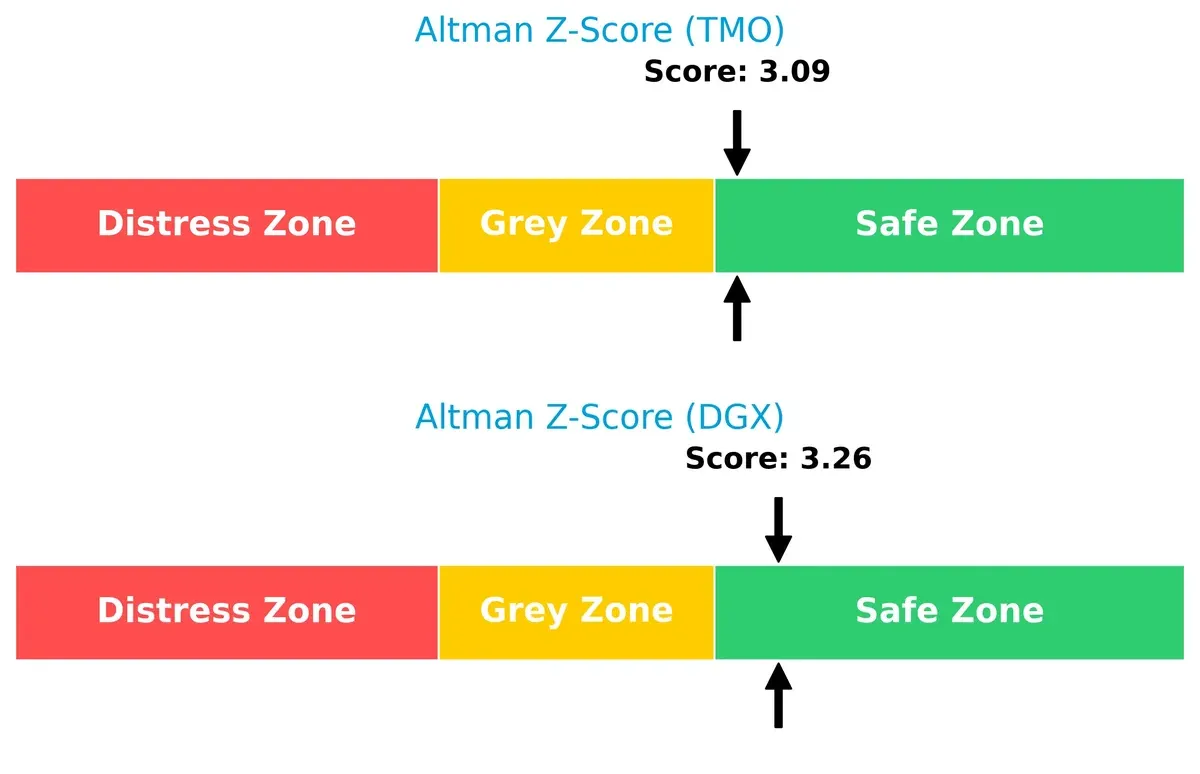
Quest Diagnostics holds a slightly stronger solvency cushion, yet both companies demonstrate resilience to financial stress in the current market environment.
Financial Health: Quality of Operations
Quest Diagnostics posts a Piotroski F-Score of 7 (strong), edging Thermo Fisher Scientific’s 6 (average) in financial health metrics:
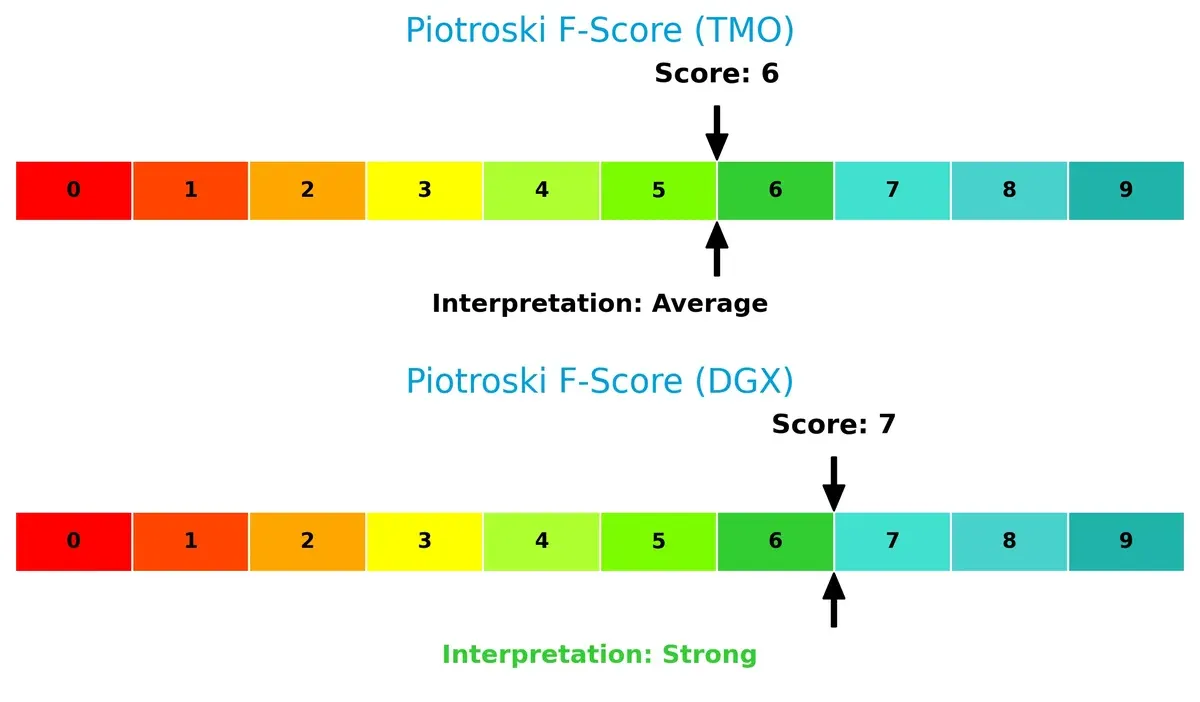
This difference suggests Quest Diagnostics maintains better operational quality and fewer red flags internally, giving it an incremental advantage in financial strength and efficiency.
How are the two companies positioned?
This section dissects the operational DNA of Thermo Fisher Scientific (TMO) and Quest Diagnostics (DGX) by comparing revenue distribution and internal dynamics. Our goal is to confront their economic moats to identify which model offers the most resilient competitive advantage today.
Revenue Segmentation: The Strategic Mix
The following comparison dissects how Thermo Fisher Scientific Inc. and Quest Diagnostics Incorporated diversify their income streams and where their primary sector bets lie:
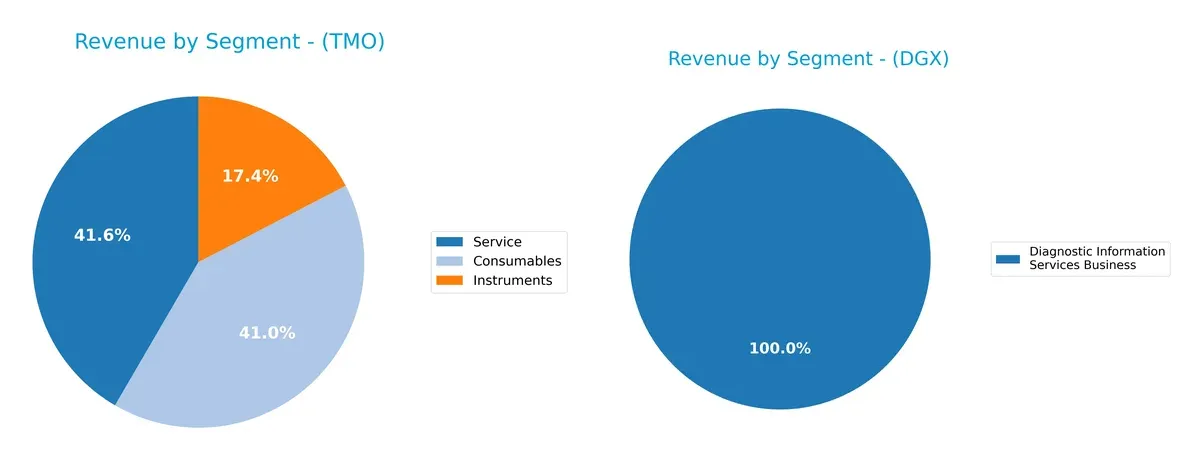
Thermo Fisher Scientific splits its $42B 2024 revenue almost evenly between Consumables ($17.6B) and Service ($17.8B), with Instruments trailing at $7.4B. This broad mix anchors Thermo Fisher’s ecosystem lock-in across lab and research infrastructure. Quest Diagnostics, by contrast, leans heavily on its Diagnostic Information Services Business, generating $9.6B of $9.6B total revenue in 2024. Quest’s concentration signals high exposure to diagnostic testing but also a dominant niche infrastructure position.
Strengths and Weaknesses Comparison
This table compares the strengths and weaknesses of Thermo Fisher Scientific (TMO) and Quest Diagnostics (DGX):
TMO Strengths
- Strong diversification across consumables, instruments, and services
- Favorable net margin of 15.12%
- Solid current and quick ratios indicating liquidity
- Favorable interest coverage ratio
- Global presence with significant revenue in US, Europe, Asia Pacific
DGX Strengths
- Focused diagnostic services business with steady revenue
- Favorable weighted average cost of capital (WACC) at 5.8%
- Favorable quick ratio and interest coverage
- Neutral price-to-earnings ratio at 19.23
- Higher dividend yield at 1.98%
TMO Weaknesses
- Unfavorable price-to-earnings (PE) and price-to-book (PB) ratios indicating possible overvaluation
- Lower asset turnover at 0.4
- Unfavorable dividend yield at 0.29%
- Neutral return on equity (ROE) and return on invested capital (ROIC)
- Moderate debt levels
DGX Weaknesses
- Higher debt-to-equity ratio at 1.05 posing leverage risk
- Neutral net margin at 8.82% lower than TMO
- Neutral asset turnover at 0.61
- Limited diversification with most revenue from diagnostic information services
- Lower current ratio at 1.1 indicating tighter liquidity
Both companies present slightly favorable financial profiles but differ in diversification and leverage. TMO’s broad product mix and global footprint contrast with DGX’s focused diagnostics and higher leverage, shaping distinct strategic priorities.
The Moat Duel: Analyzing Competitive Defensibility
A structural moat alone protects long-term profits from relentless competition and market disruption. Let’s dissect the unique moats of Thermo Fisher and Quest Diagnostics:
Thermo Fisher Scientific Inc.: Innovation-Driven Intangible Assets
Thermo Fisher’s moat hinges on intangible assets like patents and proprietary technologies. This leads to stable margins and a high ROIC historically, despite recent declines. Expansion in biologics and diagnostics innovation could deepen its moat in 2026.
Quest Diagnostics Incorporated: Scale and Network Effects
Quest Diagnostics relies on scale and extensive lab network effects, contrasting Thermo Fisher’s tech moat. It drives efficient cost structures and margin resilience. However, its shrinking ROIC signals pressure; growth in advanced diagnostics might unlock new opportunities.
Innovation Moat vs. Scale Network: Who Defends Profit Better?
Both firms face declining ROIC trends, signaling eroding moats. However, Thermo Fisher’s intangible asset base offers a wider moat than Quest’s scale-dependent model. Thermo Fisher remains better equipped to sustain market share amid intensifying competition.
Which stock offers better returns?
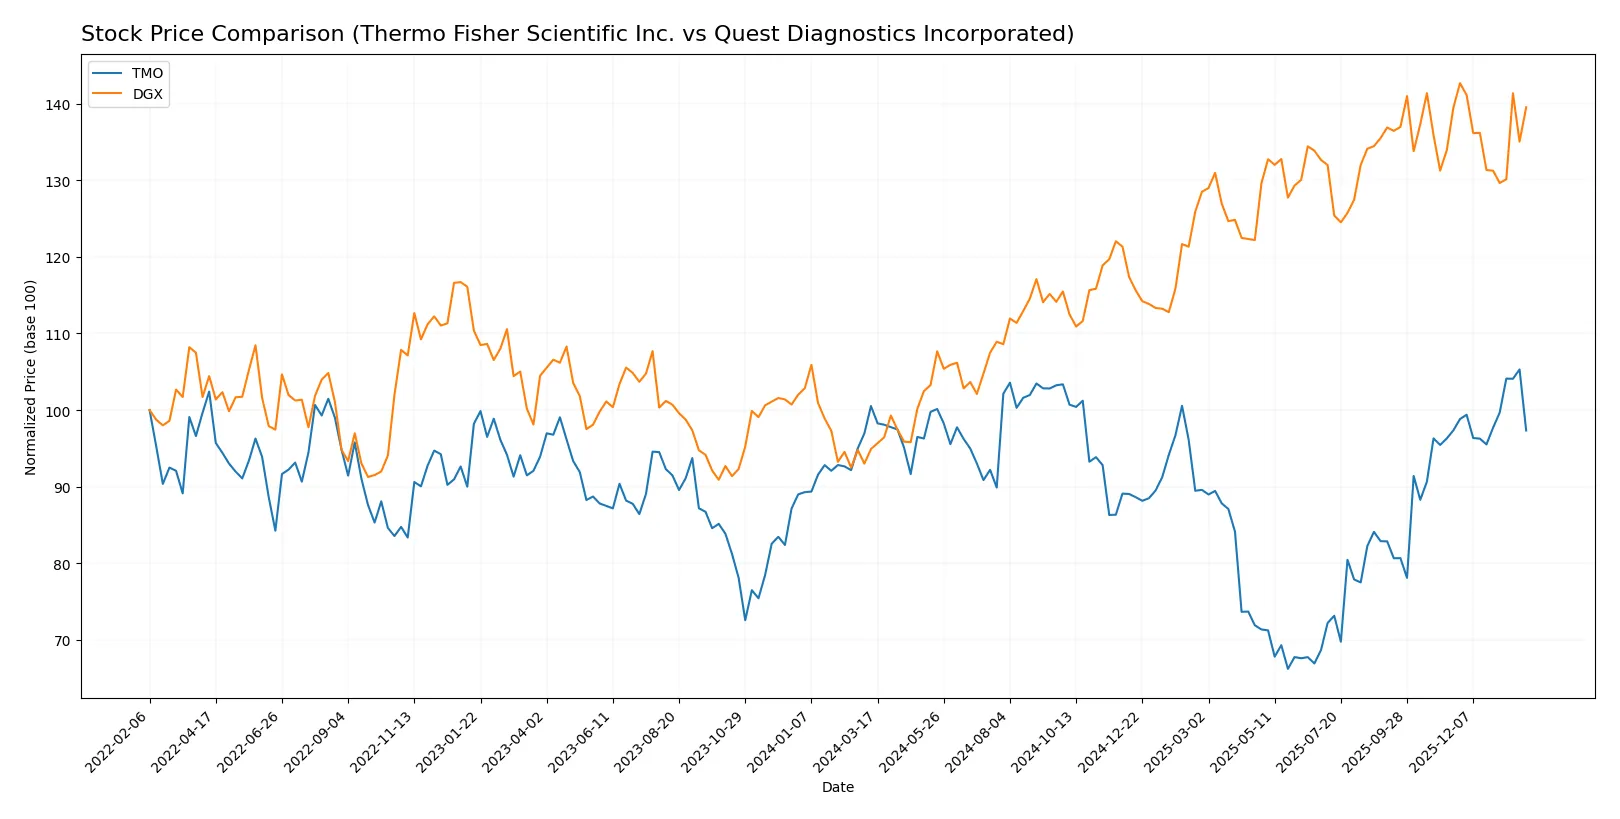
The past year shows contrasting dynamics: Thermo Fisher Scientific’s stock declined steadily while Quest Diagnostics surged sharply, reflecting divergent market sentiment and performance trajectories.
Trend Comparison
Thermo Fisher Scientific’s stock fell 3.18% over the past year, marking a bearish trend with accelerating decline and high volatility, hitting a low of 393.66 and a high of 625.98.
Quest Diagnostics’ stock gained 46.99% over the past year, confirming a bullish trend with decelerating momentum and lower volatility, reaching a low of 127.24 and a high of 191.25.
Quest Diagnostics outperformed Thermo Fisher Scientific, delivering the highest market returns and a strong positive trend over the last 12 months.
Target Prices
Analysts present a bullish consensus for both Thermo Fisher Scientific Inc. and Quest Diagnostics Incorporated.
| Company | Target Low | Target High | Consensus |
|---|---|---|---|
| Thermo Fisher Scientific Inc. | 561 | 750 | 643.69 |
| Quest Diagnostics Incorporated | 190 | 215 | 203.1 |
Thermo Fisher’s consensus target of 644 exceeds the current price of 579 by 11%. Quest Diagnostics’ target consensus of 203 also suggests upside from its current 187 price.

Don’t Let Luck Decide Your Entry Point
Optimize your entry points with our advanced ProRealTime indicators. You’ll get efficient buy signals with precise price targets for maximum performance. Start outperforming now!
How do institutions grade them?
Thermo Fisher Scientific Inc. Grades
The following table summarizes recent grades issued by major institutions for Thermo Fisher Scientific Inc.:
| Grading Company | Action | New Grade | Date |
|---|---|---|---|
| TD Cowen | maintain | Buy | 2026-01-30 |
| Barclays | maintain | Overweight | 2026-01-30 |
| Citigroup | maintain | Buy | 2026-01-30 |
| Stifel | maintain | Buy | 2026-01-09 |
| TD Cowen | maintain | Buy | 2026-01-07 |
| Wells Fargo | maintain | Overweight | 2025-12-15 |
| Citigroup | upgrade | Buy | 2025-12-11 |
| Keybanc | upgrade | Overweight | 2025-12-08 |
| Morgan Stanley | maintain | Overweight | 2025-12-02 |
| HSBC | upgrade | Buy | 2025-12-01 |
Quest Diagnostics Incorporated Grades
The following table summarizes recent grades issued by major institutions for Quest Diagnostics Incorporated:
| Grading Company | Action | New Grade | Date |
|---|---|---|---|
| Piper Sandler | maintain | Neutral | 2025-10-27 |
| Truist Securities | maintain | Hold | 2025-10-22 |
| Barclays | maintain | Equal Weight | 2025-10-22 |
| Jefferies | maintain | Buy | 2025-10-21 |
| Leerink Partners | maintain | Outperform | 2025-10-21 |
| Mizuho | maintain | Outperform | 2025-10-17 |
| UBS | maintain | Neutral | 2025-10-17 |
| Evercore ISI Group | maintain | In Line | 2025-10-08 |
| Barclays | maintain | Equal Weight | 2025-10-02 |
| Baird | downgrade | Neutral | 2025-08-25 |
Which company has the best grades?
Thermo Fisher Scientific Inc. consistently receives Buy and Overweight ratings from reputable institutions, reflecting strong confidence. Quest Diagnostics shows a mixed profile, with several Neutral and Hold ratings alongside some Outperform grades. Investors may interpret Thermo Fisher’s stronger consensus as a signal of greater institutional conviction.
Risks specific to each company
The following categories identify the critical pressure points and systemic threats facing both firms in the 2026 market environment:
1. Market & Competition
Thermo Fisher Scientific Inc.
- Dominates with broad life sciences solutions, facing intense innovation pressure.
Quest Diagnostics Incorporated
- Competes mainly in diagnostic testing, challenged by consolidation and tech advances.
2. Capital Structure & Debt
Thermo Fisher Scientific Inc.
- Moderate debt-to-equity (0.74), interest coverage strong at 5.71 times.
Quest Diagnostics Incorporated
- Higher debt-to-equity (1.05) raises financial risk despite good interest coverage (6.2).
3. Stock Volatility
Thermo Fisher Scientific Inc.
- Beta at 0.91 indicates moderate volatility close to market risk.
Quest Diagnostics Incorporated
- Lower beta of 0.64 shows less price fluctuation, appealing for risk-averse investors.
4. Regulatory & Legal
Thermo Fisher Scientific Inc.
- Faces complex global regulations across multiple segments and geographies.
Quest Diagnostics Incorporated
- Primarily US-regulated, with risks from healthcare policy changes and reimbursement pressures.
5. Supply Chain & Operations
Thermo Fisher Scientific Inc.
- Diverse global supply chain vulnerable to geopolitical disruptions and raw material costs.
Quest Diagnostics Incorporated
- Operations concentrated in US, risks from lab capacity and logistics disruptions.
6. ESG & Climate Transition
Thermo Fisher Scientific Inc.
- Large footprint demands aggressive ESG initiatives; transition risks exist but manageable.
Quest Diagnostics Incorporated
- Smaller scale eases ESG compliance but must adapt to rising stakeholder expectations.
7. Geopolitical Exposure
Thermo Fisher Scientific Inc.
- Significant international exposure to trade tensions and regulatory shifts.
Quest Diagnostics Incorporated
- Mostly domestic, limiting geopolitical risk but susceptible to US policy volatility.
Which company shows a better risk-adjusted profile?
Thermo Fisher’s most impactful risk is its complex global supply chain and geopolitical exposure. Quest Diagnostics faces greater financial risk from higher leverage. Despite this, Quest’s lower stock volatility and strong Piotroski score suggest a more balanced risk-adjusted profile. Recent data show Thermo Fisher’s debt-to-equity remains moderate but warrants caution given its high valuation multiples.
Final Verdict: Which stock to choose?
Thermo Fisher Scientific Inc. (TMO) impresses with its unmatched operational efficiency and strong cash flow generation. Its superpower lies in leveraging a robust asset base to maintain favorable margins despite a challenging macro environment. The main point of vigilance is its declining ROIC trend, signaling potential pressure on long-term value creation. TMO suits aggressive growth portfolios that can tolerate cyclical swings.
Quest Diagnostics Incorporated (DGX) benefits from a solid strategic moat anchored in steady recurring revenues and a safer balance sheet profile relative to TMO. Its reliable cash conversion cycle and conservative leverage offer a cushion against volatility. DGX fits well within GARP portfolios seeking growth with reasonable stability and moderate valuation risk.
If you prioritize operational excellence and high-margin growth, TMO stands out due to its superior scale and cash generation. However, if you seek better downside protection and consistent income streams, DGX offers better stability with a defensible competitive position. Both present analytical scenarios worth considering based on your risk tolerance and investment horizon.
Disclaimer: Investment carries a risk of loss of initial capital. The past performance is not a reliable indicator of future results. Be sure to understand risks before making an investment decision.
Go Further
I encourage you to read the complete analyses of Thermo Fisher Scientific Inc. and Quest Diagnostics Incorporated to enhance your investment decisions: