Home > Comparison > Technology > WDC vs QUBT
The strategic rivalry between Western Digital Corporation and Quantum Computing, Inc. shapes the evolution of the technology hardware sector. Western Digital operates as a capital-intensive data storage manufacturer with a broad product portfolio and global scale. Quantum Computing, in contrast, pursues a high-growth model focused on quantum software and hardware innovation. This analysis will assess which corporate trajectory offers superior risk-adjusted returns for a diversified portfolio navigating technological disruption.
Table of contents
Companies Overview
Western Digital Corporation and Quantum Computing, Inc. represent contrasting forces within the computer hardware sector, each shaping distinct market niches.
Western Digital Corporation: Storage Solutions Powerhouse
Western Digital dominates as a leading developer and manufacturer of data storage devices. It generates revenue primarily from hard disk drives, solid-state drives, and flash storage products across consumer, enterprise, and industrial markets. In 2026, the company focuses on expanding data center solutions and enhancing flash-based storage platforms to capture growing cloud and enterprise demand.
Quantum Computing, Inc.: Quantum Software Innovator
Quantum Computing, Inc. operates in the nascent quantum software and application acceleration space. Its core revenue comes from Qatalyst, a platform enabling developers to build quantum-ready applications compatible with multiple quantum processors. The firm’s strategic emphasis remains on advancing commercial and government adoption of quantum computing through software innovation.
Strategic Collision: Similarities & Divergences
Western Digital pursues a hardware-centric, scale-driven model, while Quantum Computing bets on software agility within an emerging technology frontier. Their primary battleground lies in computing infrastructure, but with vastly different approaches—mature storage solutions versus quantum application enablement. Investors face distinct profiles: Western Digital offers established market leadership; Quantum Computing presents high-risk, high-reward innovation exposure.
Income Statement Comparison
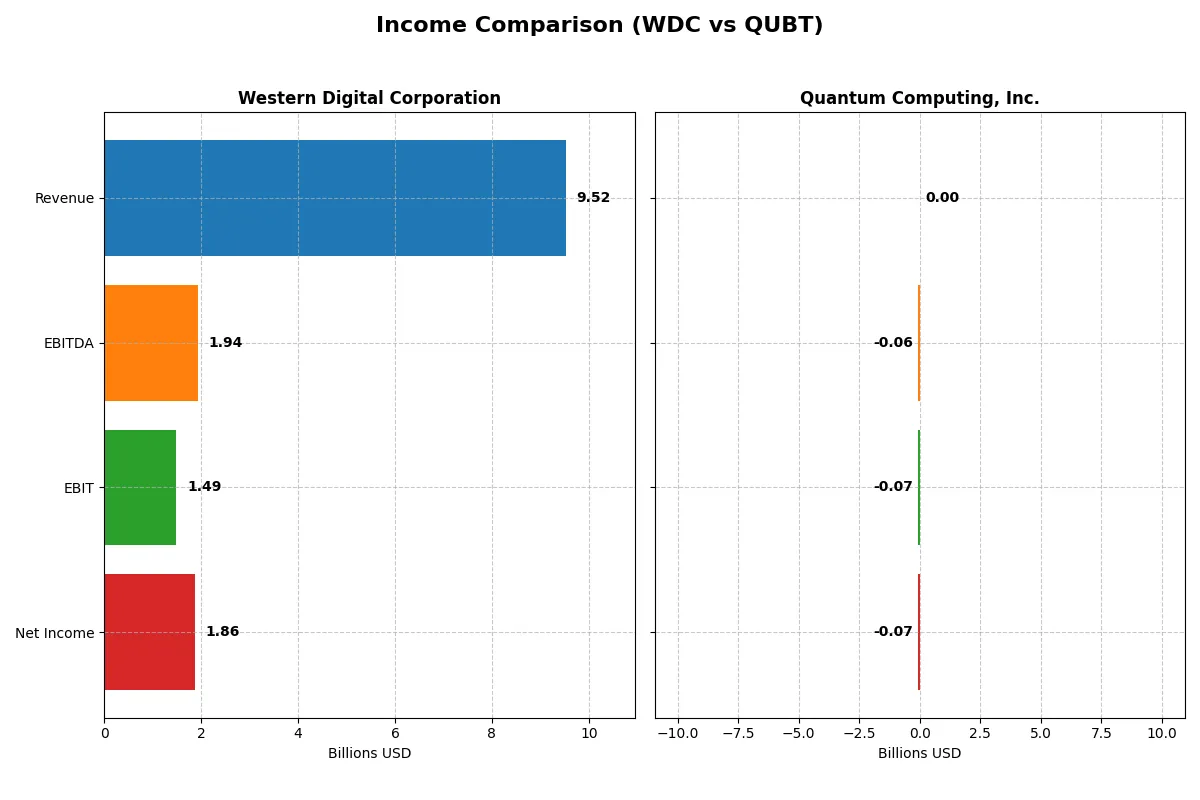
This table dissects the core profitability and scalability of both corporate engines to reveal who dominates the bottom line:
| Metric | Western Digital Corporation (WDC) | Quantum Computing, Inc. (QUBT) |
|---|---|---|
| Revenue | 9.52B | 373K |
| Cost of Revenue | 5.83B | 4.06M |
| Operating Expenses | 1.36B | 22.25M |
| Gross Profit | 3.69B | -3.69M |
| EBITDA | 1.94B | -62.25M |
| EBIT | 1.49B | -66.05M |
| Interest Expense | 357M | 2.50M |
| Net Income | 1.86B | -68.54M |
| EPS | 5.31 | -0.73 |
| Fiscal Year | 2025 | 2024 |
Income Statement Analysis: The Bottom-Line Duel
This income statement comparison reveals the true efficiency and profitability of Western Digital Corporation and Quantum Computing, Inc.
Western Digital Corporation Analysis
Western Digital’s revenue shows volatility, peaking at 18.8B in 2022 before dropping to 9.5B in 2025, yet net income recovered strongly to 1.86B in 2025. Its gross margin stands at a healthy 38.8%, and net margin at 19.6%, signaling solid operational control and improving profitability momentum in 2025.
Quantum Computing, Inc. Analysis
Quantum Computing’s revenue remains negligible, around 0.37M in 2024, with persistent net losses of -68.5M in the same year. It suffers from a negative gross margin of -988%, and net margin at -18,376%, reflecting severe inefficiencies and heavy operational costs outpacing revenues consistently.
Margin Strength vs. Scale Deficiency
Western Digital clearly outperforms Quantum Computing with robust margins and positive net income growth despite revenue swings. Quantum’s large losses and negative margins expose fundamental operational weaknesses. For investors, Western Digital’s profile offers tangible profitability, while Quantum’s remains a high-risk research-stage play.
Financial Ratios Comparison
These vital ratios act as a diagnostic tool to expose the underlying fiscal health, valuation premiums, and capital efficiency of these companies:
| Ratios | Western Digital Corporation (WDC) | Quantum Computing, Inc. (QUBT) |
|---|---|---|
| ROE | 35.0% | -63.9% |
| ROIC | 21.5% | -17.4% |
| P/E | 11.8 | -22.7 |
| P/B | 4.14 | 14.48 |
| Current Ratio | 1.08 | 17.36 |
| Quick Ratio | 0.84 | 17.36 |
| D/E | 0.96 | 0.01 |
| Debt-to-Assets | 36.3% | 0.8% |
| Interest Coverage | 6.54 | -10.4 |
| Asset Turnover | 0.68 | 0.0024 |
| Fixed Asset Turnover | 4.06 | 0.038 |
| Payout ratio | 2.36% | -0.31% |
| Dividend yield | 0.20% | 0.01% |
| Fiscal Year | 2025 | 2024 |
Efficiency & Valuation Duel: The Vital Signs
Financial ratios serve as a company’s DNA, unveiling hidden risks and signaling operational strength or weakness beneath the surface.
Western Digital Corporation
Western Digital demonstrates robust profitability with a 35% ROE and a healthy 19.55% net margin, signaling strong operational efficiency. The stock trades at a reasonable P/E of 11.8, suggesting undervaluation relative to earnings. However, its P/B ratio of 4.14 indicates stretched book value. Shareholders receive minimal dividends (0.2%), reflecting a modest return while the company balances reinvestment and buybacks.
Quantum Computing, Inc.
Quantum Computing suffers severe losses, marked by a negative ROE of -63.9% and a drastically unfavorable net margin of -18,375%. The P/E ratio is negative but rated favorable due to the stock’s speculative nature. Its sky-high P/B of 14.48 and excessive current ratio of 17.36 highlight an inefficient capital structure. The company reinvests heavily in R&D without dividends, reflecting a high-risk growth profile.
Balanced Profitability vs. High-Risk Growth
Western Digital offers a far superior balance of profitability and valuation metrics, with manageable risks and solid operational returns. Quantum Computing’s ratios reveal extreme volatility and financial distress, suitable only for investors with a high-risk tolerance seeking speculative growth. The choice hinges on risk appetite: stable income versus aggressive innovation.
Which one offers the Superior Shareholder Reward?
I observe Western Digital Corporation (WDC) and Quantum Computing, Inc. (QUBT) take markedly different approaches to shareholder rewards. WDC pays a modest dividend yield of 0.2% with a very low payout ratio of 2.4%, supported by strong free cash flow of 3.7/share, signaling sustainable dividends. It also executes meaningful buybacks, enhancing total shareholder return. In contrast, QUBT offers a near-negligible dividend yield (~0.01%) but suffers massive losses and negative free cash flow, reflecting an aggressive reinvestment strategy in R&D and growth. Buybacks are absent for QUBT, consistent with its cash burn phase. I conclude WDC’s balanced dividend and buyback model delivers a more attractive and sustainable total return profile for investors in 2026, while QUBT remains a speculative growth play with high risk.
Comparative Score Analysis: The Strategic Profile
The radar chart reveals the fundamental DNA and trade-offs of Western Digital Corporation and Quantum Computing, Inc., highlighting their strategic strengths and weaknesses:
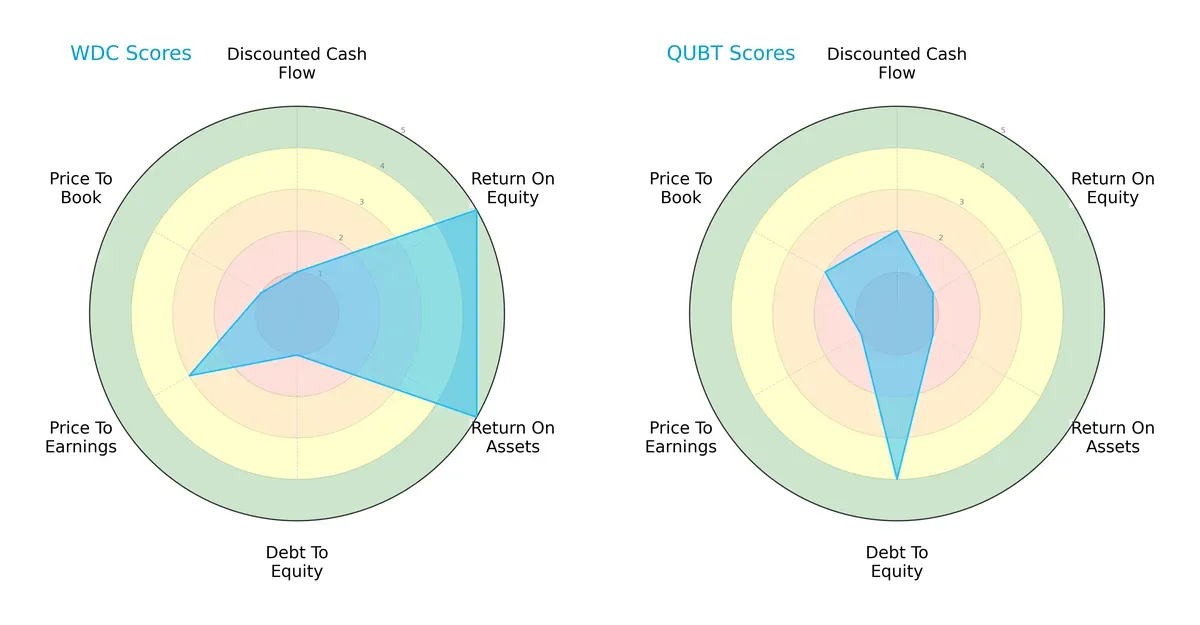
Western Digital shows strong operational efficiency with top ROE and ROA scores (5 each), but its financial leverage is a clear weakness, marked by a very unfavorable debt-to-equity score (1). Quantum Computing excels in balance sheet strength with a favorable debt-to-equity score (4), yet struggles on profitability metrics, scoring only 1 on ROE and ROA. Western Digital’s profile is more unbalanced, relying heavily on operational performance, while Quantum Computing presents a more conservative financial structure but lacks earnings efficiency.
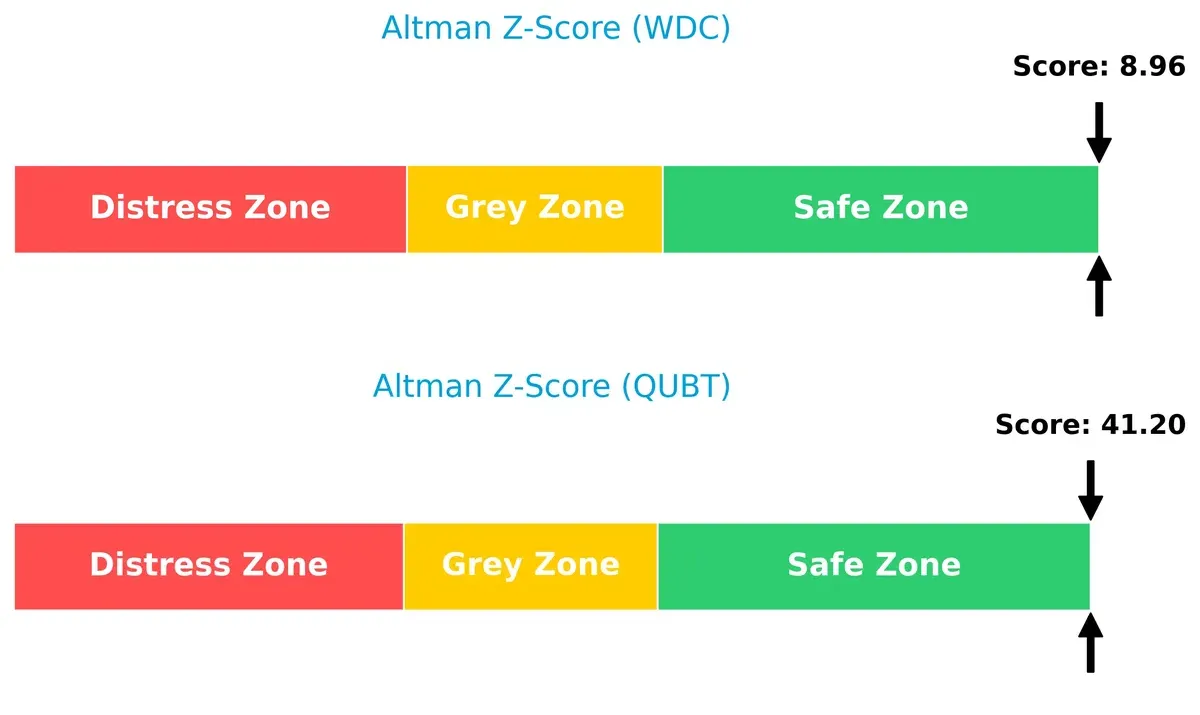
Bankruptcy Risk: Solvency Showdown
Western Digital and Quantum Computing both reside firmly in the safe zone, but Quantum Computing’s Altman Z-Score far exceeds Western Digital’s, implying superior long-term solvency resilience in volatile cycles:
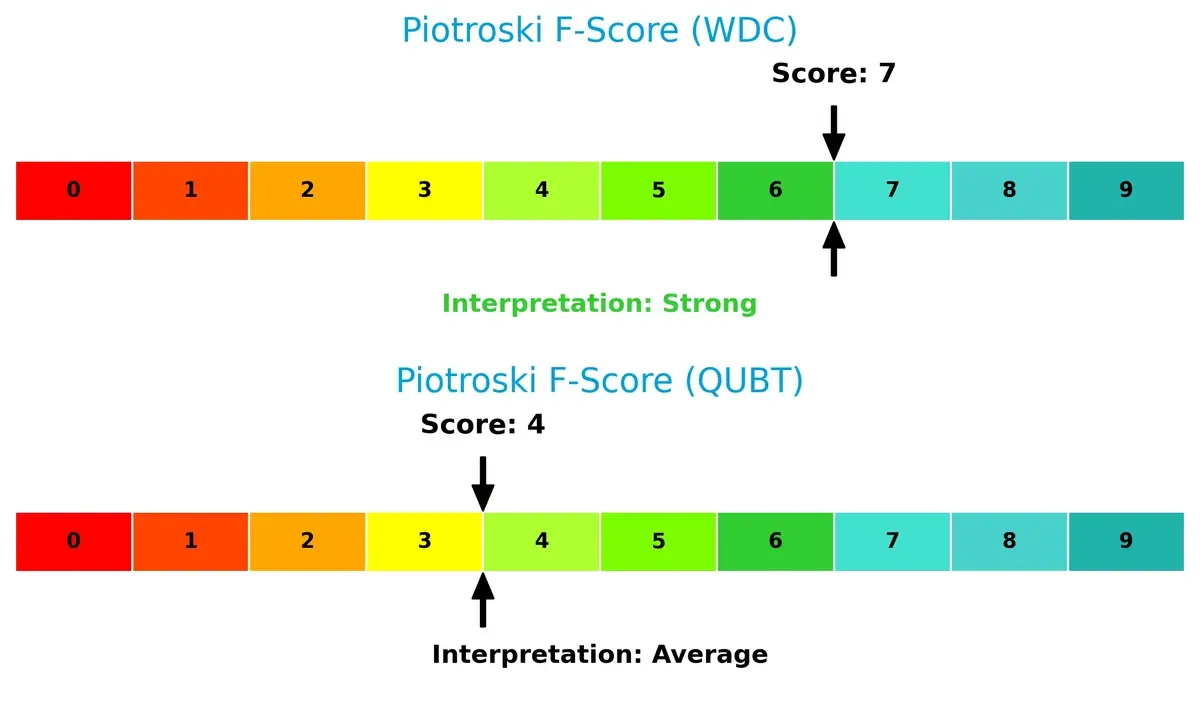
Financial Health: Quality of Operations
Western Digital outperforms Quantum Computing in operational quality, with a Piotroski F-Score of 7 indicating strong financial health. Quantum Computing’s score of 4 signals average performance and some internal red flags:
How are the two companies positioned?
This section dissects the operational DNA of Western Digital and Quantum Computing by comparing their revenue distribution and internal dynamics. The goal is to confront their economic moats and identify which model offers the most sustainable competitive advantage today.
Revenue Segmentation: The Strategic Mix
This visual comparison dissects how Western Digital Corporation and Quantum Computing, Inc. diversify their income streams and where their primary sector bets lie:
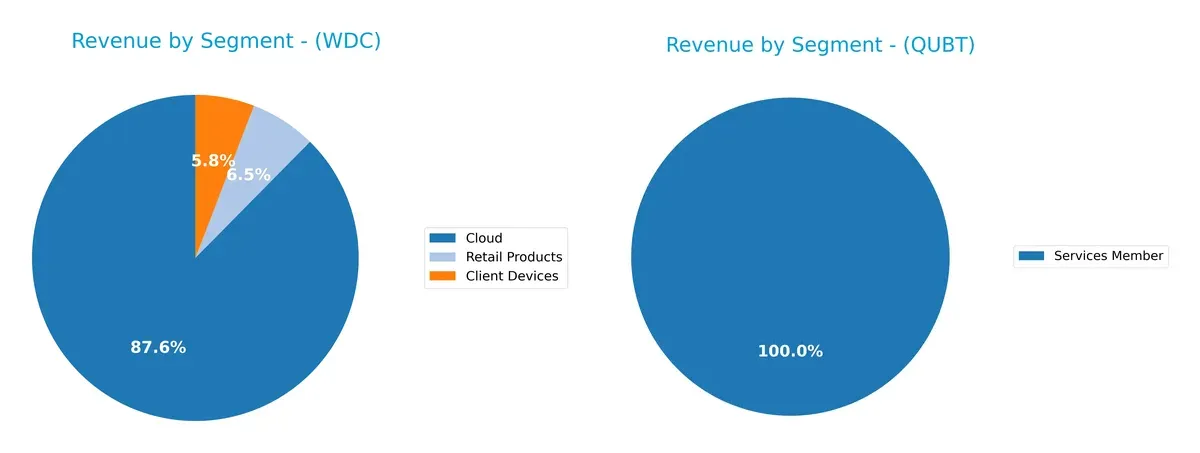
Western Digital anchors revenue heavily in Cloud at $8.34B (2025), dwarfing Client Devices ($556M) and Retail Products ($623M). This signals a pivot towards infrastructure dominance but raises concentration risk. Quantum Computing relies solely on Services Member at $346K, showing no diversification. Western Digital’s broader segment mix offers ecosystem lock-in potential; Quantum’s narrow base limits strategic flexibility.
Strengths and Weaknesses Comparison
This table compares the strengths and weaknesses of Western Digital Corporation (WDC) and Quantum Computing, Inc. (QUBT):
WDC Strengths
- Diversified revenue across Client Devices, Cloud, and Retail Products
- Favorable net margin (19.55%) and ROE (35.04%)
- Strong fixed asset turnover (4.06) indicates efficient use of assets
- Established global presence with significant revenues in Asia, Americas, and EMEA
QUBT Strengths
- Very low debt-to-equity (0.01) and debt-to-assets (0.77%) show conservative leverage
- Favorable quick ratio (17.36) indicates strong short-term liquidity
- PE ratio favorable despite losses, suggesting market values growth potential
WDC Weaknesses
- WACC (12.21%) exceeds ROIC, signaling potential value destruction
- Price-to-book ratio (4.14) considered expensive
- Dividend yield very low (0.2%)
- Marginal current and quick ratios (~1.08 and 0.84) limit liquidity cushion
QUBT Weaknesses
- Deep negative profitability (net margin -18375.87%, ROE -63.89%)
- Negative ROIC (-17.41%) and poor asset turnover (0.0) reflect operational inefficiency
- High WACC (20.54%) raises cost of capital concerns
- Negative interest coverage (-26.46) signals difficulty servicing debt
- Extremely limited revenue base focused on a single small segment
Western Digital demonstrates robust profitability and asset efficiency backed by a diversified global footprint. Quantum Computing faces significant operational and profitability challenges despite strong liquidity and low leverage. These contrasts highlight differing strategic and financial maturity stages.
The Moat Duel: Analyzing Competitive Defensibility
A structural moat is the only true shield protecting long-term profits from relentless competitive erosion:
Western Digital Corporation: Durable Cost Advantage
Western Digital’s moat stems from its cost-efficient manufacturing scale and brand legacy. It sustains high ROIC well above WACC, reflecting robust margin stability. In 2026, expansion into enterprise storage and cloud segments should deepen this moat.
Quantum Computing, Inc.: Emerging Innovation Moat
Quantum Computing thrives on cutting-edge quantum software tools, contrasting Western Digital’s hardware focus. Despite value destruction, its ROIC trend improves, signaling growing competitive positioning. Market adoption of quantum apps offers future opportunity but remains nascent.
Cost Leadership vs. Innovation Potential
Western Digital holds a wider and deeper moat with proven value creation and scale efficiency. Quantum Computing shows promise but currently lacks sustainable profitability. Western Digital is better equipped to defend market share in 2026.
Which stock offers better returns?
The past year showed stark price surges for both companies, with Western Digital accelerating sharply and Quantum Computing facing recent deceleration and a mild pullback.
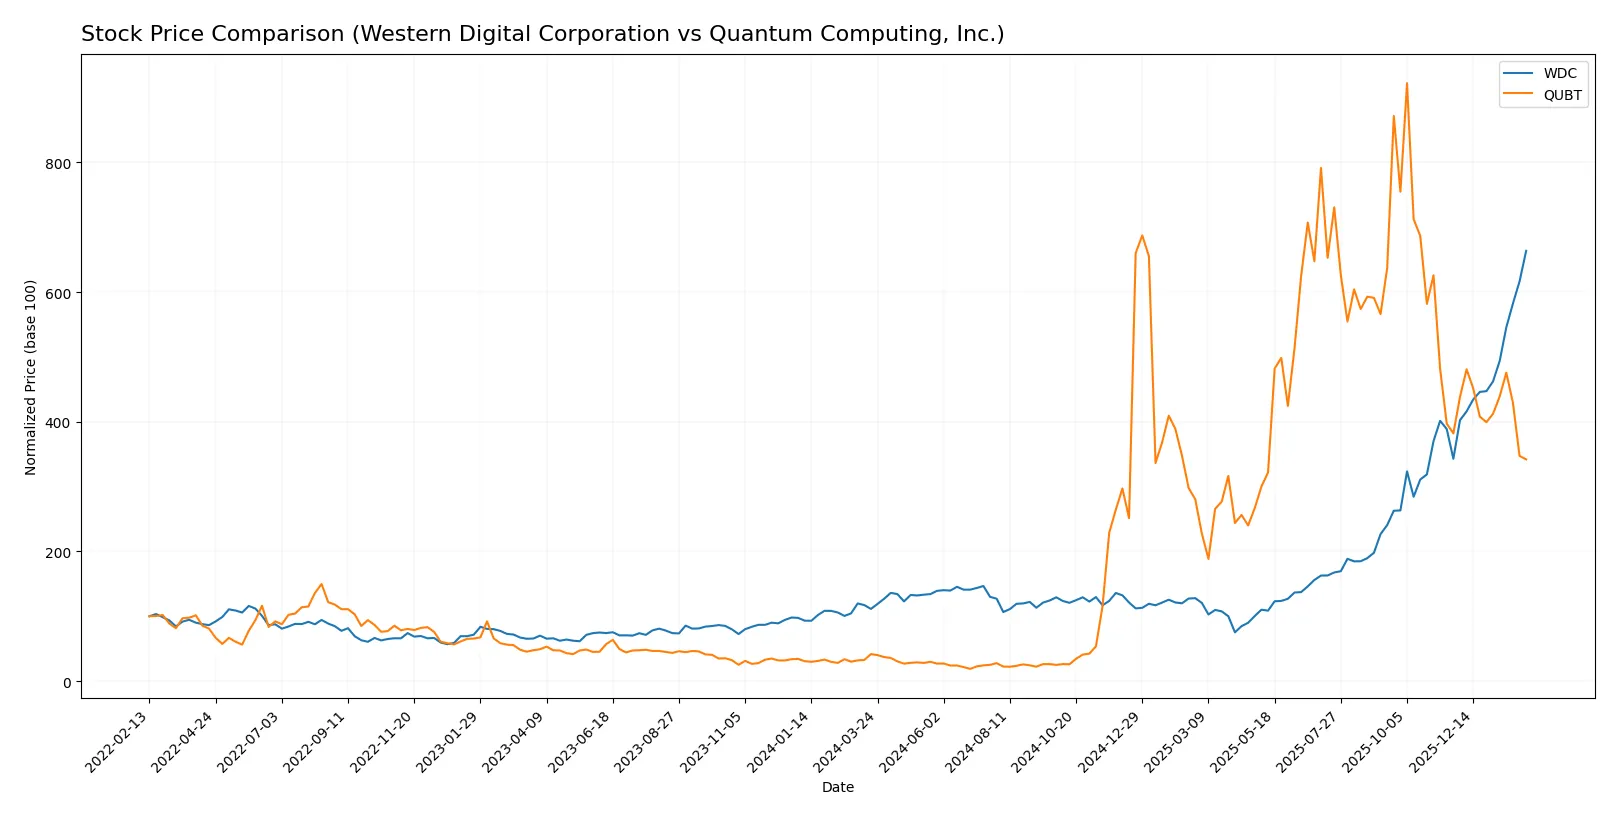
Trend Comparison
Western Digital’s stock surged 496.3% over the past year, displaying bullish acceleration and a high volatility of 52.49. The price peaked at 269.41 and bottomed at 30.54.
Quantum Computing’s stock rose 722.52% over the year with bullish but decelerating momentum. Volatility remained low at 6.8, reaching highs of 24.62 and lows of 0.5.
Quantum Computing outperformed Western Digital overall, despite recent weakness. It delivered higher total gains but shows deceleration, unlike Western Digital’s accelerating trend.
Target Prices
Analysts present a cautiously optimistic consensus on these technology hardware stocks.
| Company | Target Low | Target High | Consensus |
|---|---|---|---|
| Western Digital Corporation | 205 | 340 | 285.92 |
| Quantum Computing, Inc. | 12 | 40 | 22.67 |
Western Digital’s target consensus exceeds its current price of 269.41, implying upside potential. Quantum Computing’s consensus at 22.67 also suggests significant appreciation from its 9.13 trading level.

Don’t Let Luck Decide Your Entry Point
Optimize your entry points with our advanced ProRealTime indicators. You’ll get efficient buy signals with precise price targets for maximum performance. Start outperforming now!
How do institutions grade them?
Western Digital Corporation Grades
The following table summarizes recent grades assigned by major financial institutions to Western Digital Corporation:
| Grading Company | Action | New Grade | Date |
|---|---|---|---|
| Citigroup | Maintain | Buy | 2026-02-02 |
| Barclays | Maintain | Overweight | 2026-02-02 |
| Cantor Fitzgerald | Maintain | Overweight | 2026-01-30 |
| Wells Fargo | Maintain | Overweight | 2026-01-30 |
| Goldman Sachs | Maintain | Neutral | 2026-01-30 |
| Morgan Stanley | Maintain | Overweight | 2026-01-30 |
| TD Cowen | Maintain | Buy | 2026-01-30 |
| Wedbush | Maintain | Outperform | 2026-01-30 |
| Mizuho | Maintain | Outperform | 2026-01-27 |
| Morgan Stanley | Maintain | Overweight | 2026-01-22 |
Quantum Computing, Inc. Grades
Below is a summary of recent grades given to Quantum Computing, Inc. by select financial firms:
| Grading Company | Action | New Grade | Date |
|---|---|---|---|
| Ascendiant Capital | Maintain | Buy | 2025-12-22 |
| Cantor Fitzgerald | Maintain | Neutral | 2025-12-18 |
| Lake Street | Maintain | Buy | 2025-11-17 |
| Ascendiant Capital | Maintain | Buy | 2025-10-03 |
| Ascendiant Capital | Maintain | Buy | 2025-06-06 |
| Ascendiant Capital | Maintain | Buy | 2025-04-28 |
| Ascendiant Capital | Maintain | Buy | 2024-11-13 |
| Ascendiant Capital | Maintain | Buy | 2023-11-24 |
Which company has the best grades?
Western Digital Corporation holds consistently strong grades with multiple “Overweight” and “Outperform” ratings from top-tier banks, reflecting confidence among institutional investors. Quantum Computing, Inc. features mostly “Buy” ratings from a single firm, Ascendiant Capital, which may limit the breadth of market consensus. Investors might interpret Western Digital’s diverse and high-grade institutional support as a sign of broader market endorsement.
Risks specific to each company
The following categories identify the critical pressure points and systemic threats facing Western Digital Corporation and Quantum Computing, Inc. in the 2026 market environment:
1. Market & Competition
Western Digital Corporation
- Established presence in data storage with strong brand recognition but faces fierce competition from SSD and cloud providers.
Quantum Computing, Inc.
- Emerging player in quantum software with volatile market demand and nascent industry adoption.
2. Capital Structure & Debt
Western Digital Corporation
- Moderate leverage with debt-to-assets at 36%, interest coverage at 4.17, reflecting manageable but notable financial risk.
Quantum Computing, Inc.
- Very low debt levels (0.77% debt-to-assets), strong liquidity, but negative interest coverage signals operational losses.
3. Stock Volatility
Western Digital Corporation
- Beta of 1.84 indicates higher volatility than the market, typical for tech hardware cyclicality.
Quantum Computing, Inc.
- Extreme beta of 3.49 shows high stock price swings, reflecting speculative investor sentiment.
4. Regulatory & Legal
Western Digital Corporation
- Subject to data security and international trade regulations given global footprint.
Quantum Computing, Inc.
- Faces emerging regulatory scrutiny as quantum technology intersects with national security and export controls.
5. Supply Chain & Operations
Western Digital Corporation
- Complex global supply chains vulnerable to semiconductor shortages and geopolitical disruptions.
Quantum Computing, Inc.
- Limited operational scale with high dependency on specialized quantum hardware suppliers.
6. ESG & Climate Transition
Western Digital Corporation
- Increasing pressure to reduce carbon footprint in manufacturing and data centers amid tech sector ESG trends.
Quantum Computing, Inc.
- Early-stage company with limited ESG disclosures but potential challenges in sustainable quantum computing development.
7. Geopolitical Exposure
Western Digital Corporation
- Significant exposure to US-China trade tensions affecting manufacturing and sales.
Quantum Computing, Inc.
- Mostly US-based with less diversified geographic footprint, but sensitive to government funding policies.
Which company shows a better risk-adjusted profile?
Western Digital’s most impactful risk is its moderate debt and supply chain vulnerabilities amid a competitive hardware market. Quantum Computing faces severe profitability issues and extreme stock volatility but benefits from a clean balance sheet. Western Digital’s stable Altman Z-Score (8.96) and solid Piotroski Score (7) indicate stronger financial health. In contrast, Quantum Computing’s weak profitability metrics and average Piotroski Score (4) reveal elevated risk. The recent market price drop and high beta for Quantum confirm its speculative risk profile. Therefore, Western Digital demonstrates a better risk-adjusted profile for cautious investors.
Final Verdict: Which stock to choose?
Western Digital Corporation boasts a superpower in its ability to generate strong returns on invested capital well above its cost of capital, signaling a durable competitive advantage. Its point of vigilance lies in a modest current ratio and some leverage, which require careful monitoring. This stock suits investors seeking aggressive growth with solid profitability.
Quantum Computing, Inc. offers a strategic moat through cutting-edge innovation in a nascent industry, supported by a fortress-like balance sheet with minimal debt. Relative to Western Digital, it presents a safer liquidity profile but struggles to translate R&D into consistent profits. It fits well in a GARP (Growth at a Reasonable Price) portfolio targeting long-term potential.
If you prioritize proven value creation and accelerating profitability, Western Digital outshines due to its strong economic moat and favorable income growth. However, if you seek exposure to disruptive technology with a conservative balance sheet, Quantum Computing offers better stability despite current profitability challenges. Both present distinct analytical scenarios for different investor profiles.
Disclaimer: Investment carries a risk of loss of initial capital. The past performance is not a reliable indicator of future results. Be sure to understand risks before making an investment decision.
Go Further
I encourage you to read the complete analyses of Western Digital Corporation and Quantum Computing, Inc. to enhance your investment decisions: