Home > Comparison > Technology > SMCI vs QUBT
The strategic rivalry between Super Micro Computer, Inc. and Quantum Computing, Inc. shapes the future of the computer hardware sector. Super Micro operates as a capital-intensive provider of high-performance server and storage solutions, while Quantum Computing specializes in software tools for quantum applications, targeting emerging technology markets. This analysis examines their contrasting growth trajectories and risk profiles to identify which offers superior risk-adjusted returns for a diversified portfolio.
Table of contents
Companies Overview
Super Micro Computer and Quantum Computing both stand as notable players in the evolving computer hardware market.
Super Micro Computer, Inc.: High-Performance Server Innovator
Super Micro Computer dominates the server and storage solutions market with modular, open architecture hardware. Its revenue stems from selling servers, storage systems, and software management tools tailored to enterprise data centers, cloud, AI, and 5G sectors. In 2026, the company focuses on expanding its application-optimized server lineup and enhancing customer support services globally.
Quantum Computing, Inc.: Quantum Software Trailblazer
Quantum Computing positions itself as a leader in quantum application acceleration software, enabling hybrid quantum-ready solutions. Revenue comes primarily from licensing its Qatalyst platform and supporting multiple quantum processing units targeting commercial and government clients. The company’s 2026 strategy revolves around advancing quantum software tools and broadening adoption in emerging quantum computing markets.
Strategic Collision: Similarities & Divergences
While both operate in computer hardware, Super Micro emphasizes open modularity and physical infrastructure, contrasting with Quantum Computing’s software-driven, quantum-ready ecosystem. Their primary battleground is the frontier of next-gen computing technologies—traditional servers versus quantum acceleration platforms. This divergence creates distinct investment profiles: a mature hardware integrator versus an early-stage quantum software innovator.
Income Statement Comparison
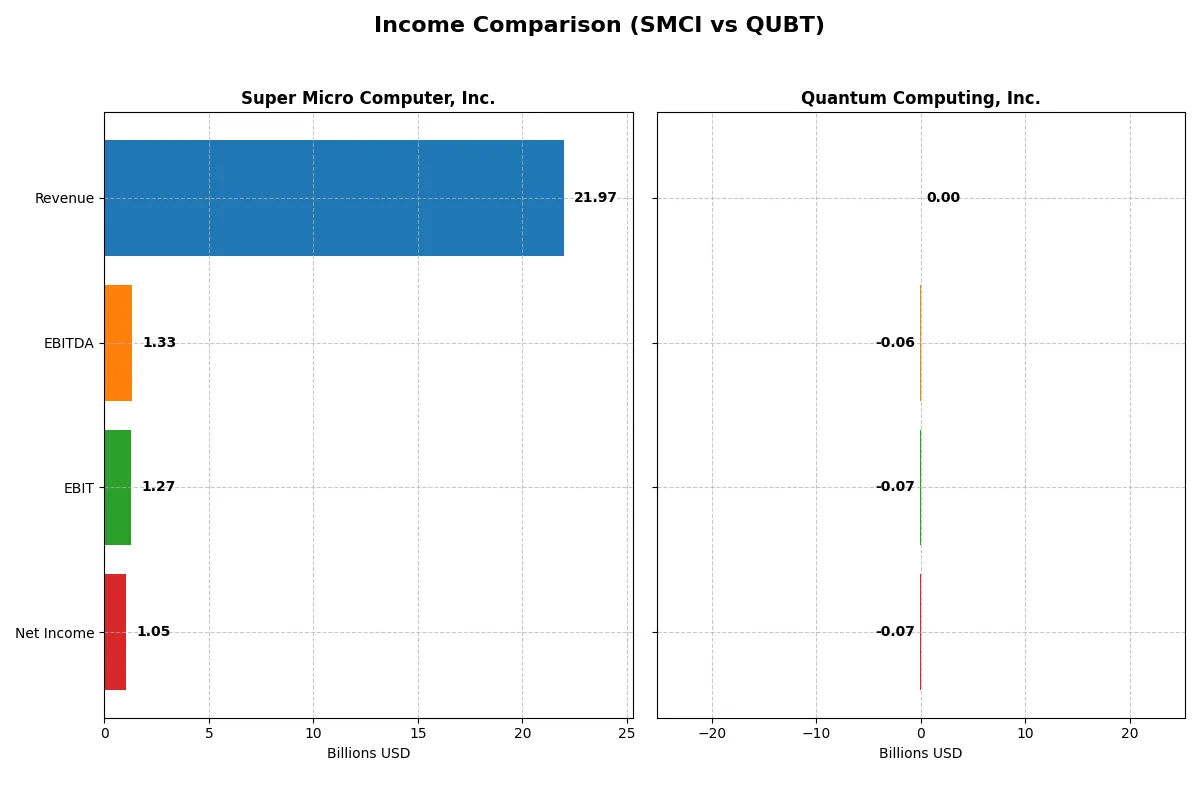
This data dissects the core profitability and scalability of both corporate engines to reveal who dominates the bottom line:
| Metric | Super Micro Computer, Inc. (SMCI) | Quantum Computing, Inc. (QUBT) |
|---|---|---|
| Revenue | 21.97B | 373K |
| Cost of Revenue | 19.54B | 4.06M |
| Operating Expenses | 1.18B | 22.25M |
| Gross Profit | 2.43B | -3.69M |
| EBITDA | 1.33B | -62.25M |
| EBIT | 1.27B | -66.05M |
| Interest Expense | 59.57M | 2.50M |
| Net Income | 1.05B | -68.54M |
| EPS | 1.77 | -0.73 |
| Fiscal Year | 2025 | 2024 |
Income Statement Analysis: The Bottom-Line Duel
The income statement comparison reveals which company runs its business more efficiently and generates sustainable profits amid market dynamics.
Super Micro Computer, Inc. Analysis
Super Micro’s revenue surged from 3.6B in 2021 to 21.9B in 2025, while net income climbed sharply to 1.05B in 2025. Gross margin hovers around 11%, and net margin remains steady near 4.8%, reflecting disciplined cost control despite rapid growth. The latest year shows strong revenue momentum but a slight net margin dip, signaling reinvestment or pricing pressures.
Quantum Computing, Inc. Analysis
Quantum Computing’s revenue stagnates below 400K, with persistent net losses peaking at -68.5M in 2024. Gross margin is deeply negative, exceeding -900%, and net margin plunges beyond -18,000%, a clear sign of operational inefficiency. The 2024 results reveal worsening profitability despite a marginal revenue increase, highlighting ongoing high R&D and administrative expenses.
Margin Stability vs. Persistent Losses
Super Micro delivers robust revenue growth with stable, positive margins, outperforming Quantum’s stagnant sales and deepening losses. Super Micro’s efficient cost structure and growing net income signal a fundamentally stronger business. Investors seeking resilience and scalability will find Super Micro’s profile more compelling than Quantum’s high-risk, loss-heavy model.
Financial Ratios Comparison
These vital ratios act as a diagnostic tool to expose the underlying fiscal health, valuation premiums, and capital efficiency of the companies compared below:
| Ratios | Super Micro Computer, Inc. (SMCI) | Quantum Computing, Inc. (QUBT) |
|---|---|---|
| ROE | 16.6% (2025) | -63.9% (2024) |
| ROIC | 9.3% (2025) | -17.4% (2024) |
| P/E | 27.7 (2025) | -22.7 (2024) |
| P/B | 4.62 (2025) | 14.5 (2024) |
| Current Ratio | 5.25 (2025) | 17.36 (2024) |
| Quick Ratio | 3.25 (2025) | 17.36 (2024) |
| D/E | 0.76 (2025) | 0.01 (2024) |
| Debt-to-Assets | 34.1% (2025) | 0.77% (2024) |
| Interest Coverage | 21.0x (2025) | -10.4x (2024) |
| Asset Turnover | 1.57 (2025) | 0.0024 (2024) |
| Fixed Asset Turnover | 27.5 (2025) | 0.038 (2024) |
| Payout ratio | 0% (2025) | -0.31% (2024) |
| Dividend yield | 0% (2025) | 0.01% (2024) |
| Fiscal Year | 2025 | 2024 |
Efficiency & Valuation Duel: The Vital Signs
Ratios serve as a company’s DNA, exposing hidden operational strengths and risks that raw numbers might obscure.
Super Micro Computer, Inc.
Super Micro Computer posts a solid 16.6% ROE, signaling effective profitability. However, its P/E of 27.7 and P/B of 4.62 mark the stock as stretched. The firm offers no dividend but reinvests heavily in R&D, aiming for sustainable growth. Its high current ratio of 5.25 flags potential inefficiency in asset use.
Quantum Computing, Inc.
Quantum Computing struggles with a deeply negative ROE of -63.9% and steep losses reflected in its unfavorable net margin. Its P/E is negative, but the high P/B of 14.48 signals an expensive valuation relative to book value. The company barely returns capital to shareholders, focusing on R&D with scant free cash flow generation.
Premium Valuation vs. Operational Safety
Super Micro Computer balances profitability with valuation risks, leaning on operational efficiency and growth reinvestment. Quantum Computing’s financials reveal high risk and operational challenges, despite heavy R&D spending. Investors prioritizing stability may prefer Super Micro’s profile; those seeking speculative growth face considerable uncertainty with Quantum.
Which one offers the Superior Shareholder Reward?
I see Super Micro Computer, Inc. (SMCI) opts for zero dividends but aggressively reinvests its strong free cash flow (2.58/share in 2025) into growth and capital expenditures, maintaining a solid balance sheet with a current ratio above 5. Quantum Computing, Inc. (QUBT) pays a minimal dividend yield (~0.01%) but suffers massive losses and negative free cash flow, undermining dividend sustainability. Both companies engage in share buybacks, but SMCI’s robust cash flow and prudent capital allocation suggest a more sustainable and attractive total return profile in 2026. I conclude SMCI offers superior shareholder reward through growth and buybacks, while QUBT’s distribution seems risky and short-lived.
Comparative Score Analysis: The Strategic Profile
The radar chart reveals the fundamental DNA and trade-offs of Super Micro Computer, Inc. and Quantum Computing, Inc., highlighting their core financial strengths and vulnerabilities:
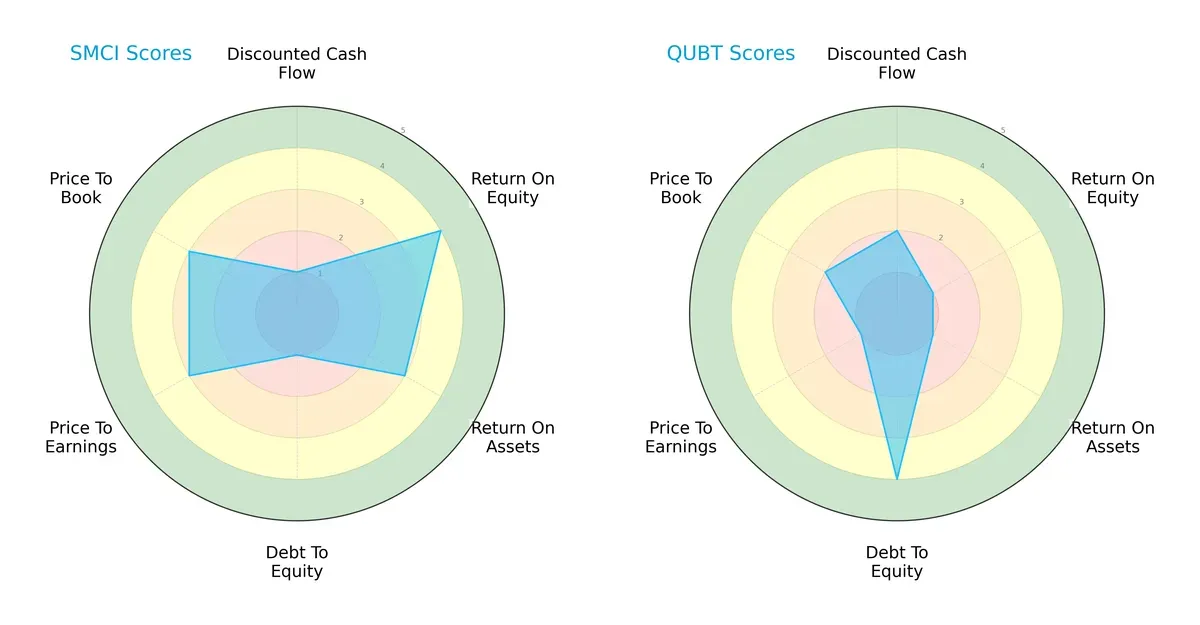
Super Micro Computer, Inc. exhibits balanced strength in return on equity (ROE 4) and return on assets (ROA 3), but a weak discounted cash flow (DCF 1) and heavy debt reliance (Debt/Equity 1). Quantum Computing, Inc. shows a strong balance sheet with low debt (Debt/Equity 4) but struggles with profitability metrics (ROE 1, ROA 1) and valuation (PE 1). SMCI relies on operational efficiency, while QUBT depends on financial stability.
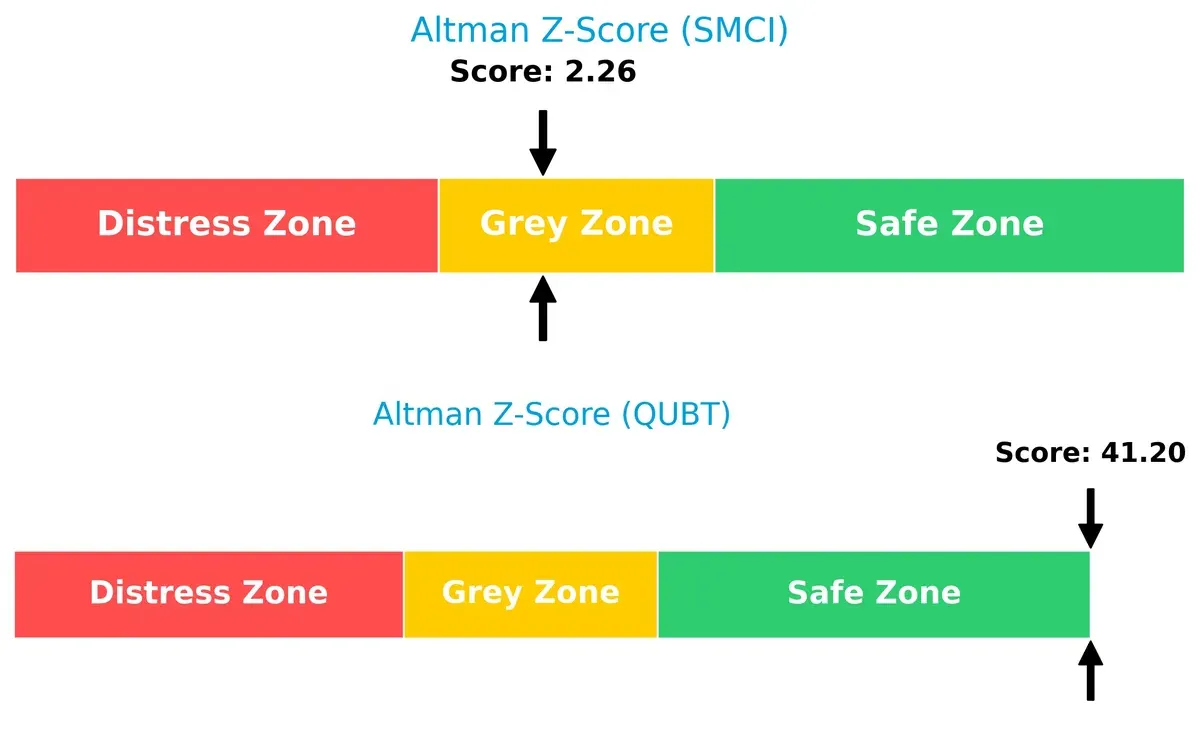
Bankruptcy Risk: Solvency Showdown
The Altman Z-Score comparison shows a stark contrast: Quantum Computing, Inc. scores a robust 41.2, signaling a safe zone, whereas Super Micro Computer, Inc. sits in the grey zone at 2.26. This implies QUBT has a far stronger buffer against bankruptcy risks in this volatile cycle:
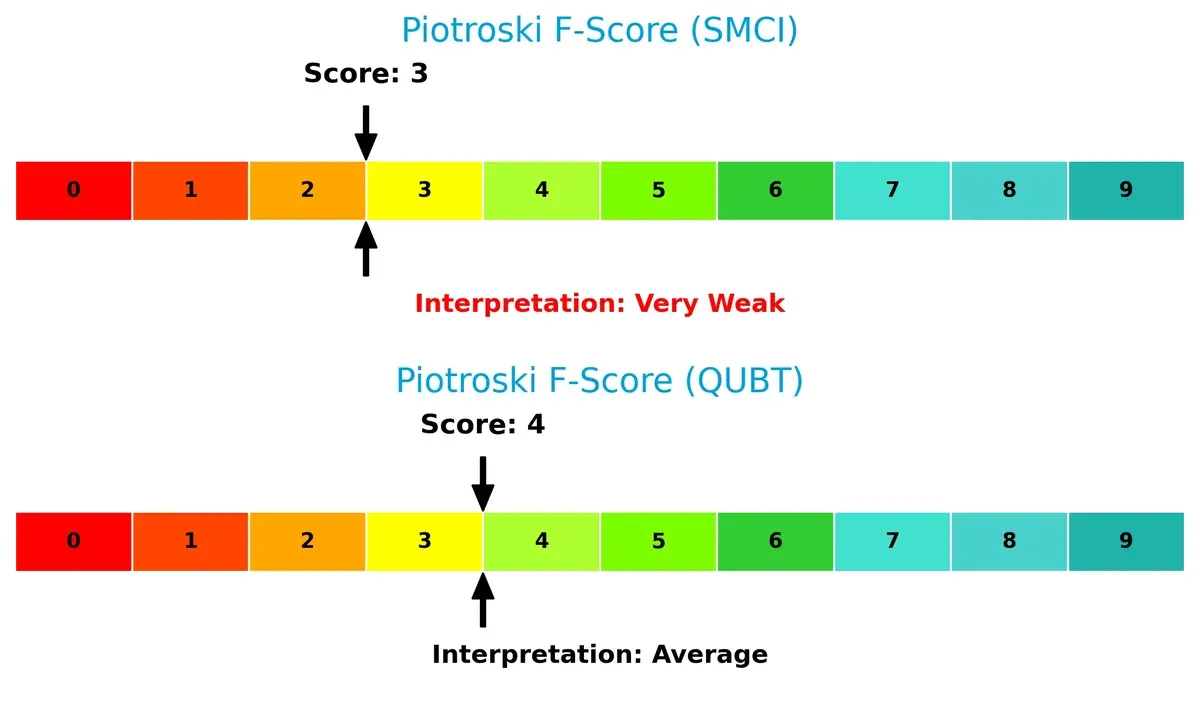
Financial Health: Quality of Operations
Piotroski F-Scores indicate both firms face challenges, but QUBT’s score of 4 outperforms SMCI’s weaker 3. Neither reaches peak financial health, but SMCI’s very weak score flags internal operational risks compared to QUBT’s average standing:
How are the two companies positioned?
This section dissects the operational DNA of SMCI and QUBT by comparing their revenue distribution by segment and internal dynamics. The goal is to confront their economic moats to identify which model offers the most resilient and sustainable competitive advantage today.
Revenue Segmentation: The Strategic Mix
The following comparison dissects how Super Micro Computer, Inc. and Quantum Computing, Inc. diversify their income streams and highlights their primary sector bets:
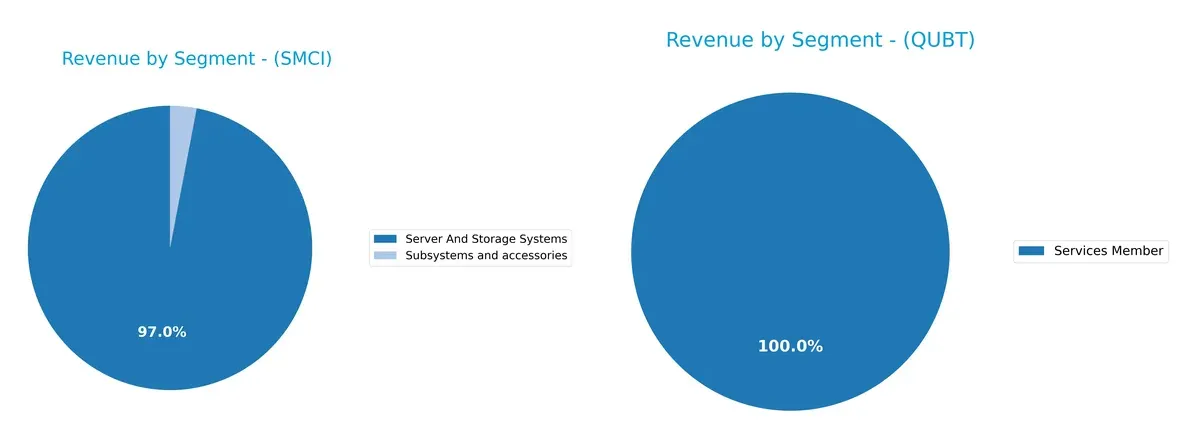
Super Micro Computer, Inc. dwarfs Quantum Computing, Inc. in revenue scale, anchored predominantly by Server And Storage Systems at $21.3B in 2025. Its smaller Subsystems and Accessories segment at $660M indicates some diversification but heavy reliance on core infrastructure. Quantum Computing, Inc. shows a narrow focus with $346K solely from Services Member, signaling concentration risk and limited ecosystem lock-in. SMCI’s broad infrastructure dominance contrasts with QUBT’s nascent revenue base.
Strengths and Weaknesses Comparison
This table compares the Strengths and Weaknesses of Super Micro Computer, Inc. (SMCI) and Quantum Computing, Inc. (QUBT):
SMCI Strengths
- Strong revenue from Server and Storage Systems (21.3B in 2025)
- Diverse geographic sales including US (13.1B) and Asia (5.5B)
- Favorable ROE at 16.6%
- High interest coverage (21.3)
- Efficient asset turnover (1.57)
QUBT Strengths
- Low debt-to-assets ratio (0.77%)
- Favorable quick ratio (17.36) indicating liquidity
- Low debt-to-equity (0.01)
- Favorable PE ratio (-22.67, reflecting market expectations)
SMCI Weaknesses
- Unfavorable net margin (4.77%)
- High PE (27.74) and PB (4.62) ratios
- Unfavorable current ratio (5.25) despite liquidity
- No dividend yield
- Neutral to unfavorable ROIC vs. WACC (9.26% vs. 9.62%)
QUBT Weaknesses
- Severely negative net margin (-18375.87%) and ROE (-63.89%)
- Negative ROIC (-17.41%) far below high WACC (20.54%)
- Negative interest coverage (-26.46)
- Minimal revenue (346K from services)
- Unfavorable asset turnover (0.0) and fixed asset turnover (0.04)
- Unfavorable PB (14.48) and dividend yield (0.01%)
Overall, SMCI demonstrates robust operational scale, geographic diversification, and solid profitability metrics, though some valuation and liquidity ratios raise concerns. QUBT shows significant financial distress and limited revenue base, despite strong liquidity and low leverage, highlighting a high-risk profile. These contrasts imply divergent strategic challenges and market positions for each firm.
The Moat Duel: Analyzing Competitive Defensibility
A structural moat is the only reliable shield protecting long-term profits from relentless competition erosion. Let’s dissect the competitive moats of two tech firms:
Super Micro Computer, Inc.: Modular Architecture with Scale Economies
Super Micro’s moat stems from cost advantage enabled by modular designs and broad geographic reach. Its steady revenue growth and improving ROIC hint at margin stability. Expansion in AI and 5G markets could deepen this moat in 2026.
Quantum Computing, Inc.: Emerging Technology with Scalability Potential
Quantum Computing relies on intangible assets—cutting-edge quantum software platforms—unlike Super Micro’s hardware focus. Despite current value destruction, rapid ROIC growth signals scaling potential. Commercial and government contracts may unlock new market disruption opportunities.
Moat Contest: Cost Efficiency vs. Technological Innovation
Super Micro boasts a wider moat with consistent revenue growth and operational scale. Quantum Computing shows promise but remains vulnerable due to negative margins and value destruction. Super Micro is better positioned to defend market share amid intensifying competition.
Which stock offers better returns?
The past year reveals starkly contrasting stock trajectories for the two companies, marked by sharp divergences in price momentum and volume patterns.
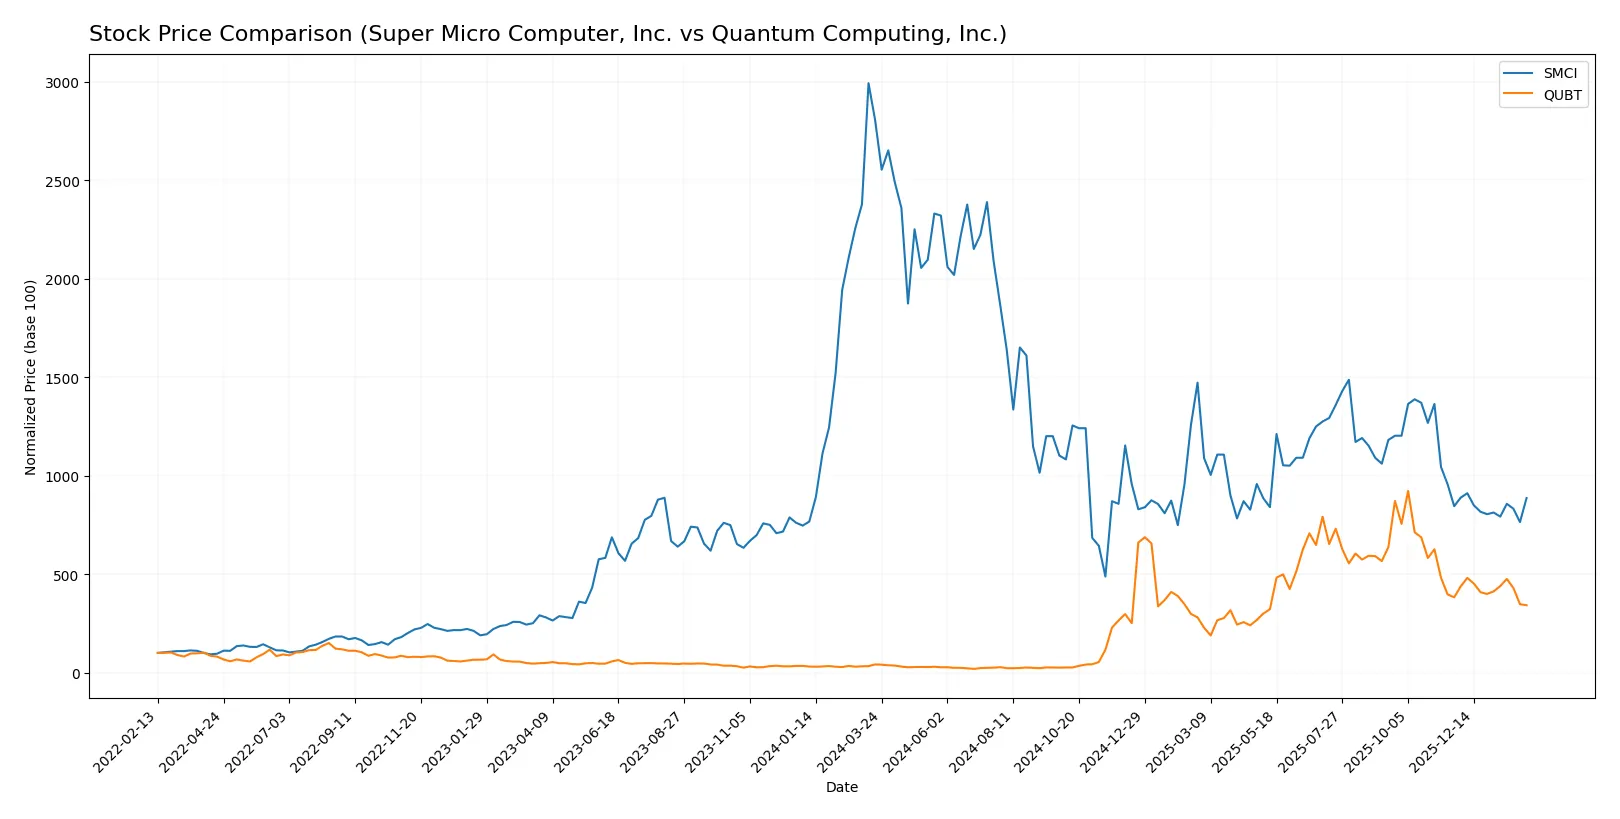
Trend Comparison
Super Micro Computer, Inc. (SMCI) exhibits a pronounced bearish trend over the last 12 months, with a -68.41% price decline and accelerating losses. The stock swung between $106.88 and $18.58, showing high volatility (20.37 std dev).
Quantum Computing, Inc. (QUBT) posts a strong bullish trend over the same period, surging 722.52%. Gains decelerate recently, with a pullback of -10.49% over the past 2.5 months. Price ranged from $0.50 to $24.62, with moderate volatility (6.8 std dev).
QUBT clearly outperformed SMCI in the last year, delivering the highest market returns despite recent short-term weakness.
Target Prices
Analysts present a mixed but optimistic target consensus for Super Micro Computer, Inc. and Quantum Computing, Inc.
| Company | Target Low | Target High | Consensus |
|---|---|---|---|
| Super Micro Computer, Inc. | 26 | 64 | 47.13 |
| Quantum Computing, Inc. | 12 | 40 | 22.67 |
Super Micro’s consensus target sits roughly 40% above its current $33.76 price, signaling strong upside potential. Quantum Computing’s consensus target is nearly 2.5x its $9.13 price, reflecting high-growth expectations despite elevated volatility.

Don’t Let Luck Decide Your Entry Point
Optimize your entry points with our advanced ProRealTime indicators. You’ll get efficient buy signals with precise price targets for maximum performance. Start outperforming now!
How do institutions grade them?
Here is a summary of recent institutional grades for both companies:
Super Micro Computer, Inc. Grades
This table shows recent rating changes from major financial institutions for SMCI.
| Grading Company | Action | New Grade | Date |
|---|---|---|---|
| Barclays | Maintain | Equal Weight | 2024-10-02 |
| Loop Capital | Maintain | Buy | 2024-09-23 |
| JP Morgan | Downgrade | Neutral | 2024-09-06 |
| Barclays | Downgrade | Equal Weight | 2024-09-04 |
| Barclays | Maintain | Overweight | 2024-08-28 |
| Wells Fargo | Maintain | Equal Weight | 2024-08-28 |
| CFRA | Downgrade | Hold | 2024-08-28 |
| Goldman Sachs | Maintain | Neutral | 2024-08-08 |
| Wells Fargo | Maintain | Equal Weight | 2024-08-07 |
| Rosenblatt | Maintain | Buy | 2024-08-07 |
Quantum Computing, Inc. Grades
Below are recent institutional ratings for QUBT by recognized grading firms.
| Grading Company | Action | New Grade | Date |
|---|---|---|---|
| Ascendiant Capital | Maintain | Buy | 2025-12-22 |
| Cantor Fitzgerald | Maintain | Neutral | 2025-12-18 |
| Lake Street | Maintain | Buy | 2025-11-17 |
| Ascendiant Capital | Maintain | Buy | 2025-10-03 |
| Ascendiant Capital | Maintain | Buy | 2025-06-06 |
| Ascendiant Capital | Maintain | Buy | 2025-04-28 |
| Ascendiant Capital | Maintain | Buy | 2024-11-13 |
| Ascendiant Capital | Maintain | Buy | 2023-11-24 |
Which company has the best grades?
Quantum Computing, Inc. consistently receives “Buy” ratings from Ascendiant Capital and others. Super Micro Computer, Inc. shows mixed grades, including downgrades to “Neutral” and “Equal Weight.” Investors may view QUBT’s steadier buy-side momentum as indicative of stronger institutional confidence.
Risks specific to each company
The following categories identify the critical pressure points and systemic threats facing both firms in the 2026 market environment:
1. Market & Competition
Super Micro Computer, Inc. (SMCI)
- Established player in high-performance server hardware with broad product range and global reach. Faces intense competition from major tech firms.
Quantum Computing, Inc. (QUBT)
- Niche focus on quantum software solutions with limited scale and visibility. Competes in an emerging, volatile market with uncertain adoption timelines.
2. Capital Structure & Debt
SMCI
- Moderate debt-to-equity ratio (0.76) signaling balanced leverage; strong interest coverage (21.34) reduces financial risk.
QUBT
- Minimal debt levels (0.01 debt-to-equity) suggest low financial leverage but poor interest coverage (-26.46) indicates inability to service debt from operations.
3. Stock Volatility
SMCI
- Beta at 1.52 implies above-market volatility but within manageable range for tech hardware.
QUBT
- Extremely high beta of 3.49 signals significant price swings and elevated market risk.
4. Regulatory & Legal
SMCI
- Operates in mature markets with standard tech hardware regulations; moderate compliance risk.
QUBT
- Quantum computing sector faces evolving regulatory frameworks, especially around export controls and government contracts.
5. Supply Chain & Operations
SMCI
- Complex global supply chain subject to semiconductor shortages and geopolitical tensions. Robust operational scale mitigates some risks.
QUBT
- Small operational footprint with reliance on third-party quantum hardware providers; vulnerable to supply disruptions.
6. ESG & Climate Transition
SMCI
- Moderate ESG risk typical of hardware manufacturing; energy consumption and e-waste are key challenges.
QUBT
- ESG footprint is limited due to software focus; however, quantum hardware partners may pose indirect risks.
7. Geopolitical Exposure
SMCI
- Significant exposure to US-China tensions affecting supply chain and market access.
QUBT
- Limited international presence reduces geopolitical risk but may constrain growth opportunities.
Which company shows a better risk-adjusted profile?
Super Micro Computer, Inc. faces manageable financial leverage and operational scale but contends with competitive and geopolitical pressures. Quantum Computing, Inc. carries higher market volatility, weak profitability, and operational dependency, raising red flags despite low debt. SMCI exhibits a stronger risk-adjusted profile grounded in stable fundamentals and scale. QUBT’s extreme beta and negative margins reflect high execution and market risks. The stark contrast in interest coverage and beta underlines my concern for QUBT’s financial sustainability amid market turbulence.
Final Verdict: Which stock to choose?
Super Micro Computer, Inc. (SMCI) stands out as a cash-efficient operator with a strong track record of revenue and net income growth. Its main point of vigilance is the stretched current ratio, which could signal liquidity management challenges. SMCI suits investors seeking aggressive growth fueled by improving profitability.
Quantum Computing, Inc. (QUBT) boasts a strategic moat in cutting-edge quantum technology with high R&D intensity and low debt risk. However, persistent losses and a negative ROIC highlight ongoing value destruction. QUBT fits risk-tolerant portfolios aiming for breakthrough innovation exposure and long-term optionality.
If you prioritize steady growth with improving returns and operational efficiency, SMCI is the compelling choice due to its improving profitability and cash flow generation. However, if you seek high-risk, high-reward innovation with potential for market disruption, QUBT offers superior exposure to quantum computing’s frontier, despite its current financial instability.
Disclaimer: Investment carries a risk of loss of initial capital. The past performance is not a reliable indicator of future results. Be sure to understand risks before making an investment decision.
Go Further
I encourage you to read the complete analyses of Super Micro Computer, Inc. and Quantum Computing, Inc. to enhance your investment decisions: