Home > Comparison > Technology > STX vs QUBT
The strategic rivalry between Seagate Technology Holdings plc and Quantum Computing, Inc. shapes the future of the technology sector. Seagate dominates as a capital-intensive leader in computer hardware, specializing in mass storage solutions. Quantum Computing, by contrast, operates as an agile software innovator, pioneering quantum application tools. This analysis explores their divergent growth trajectories to determine which offers a superior risk-adjusted return for a diversified portfolio.
Table of contents
Companies Overview
Seagate Technology Holdings plc and Quantum Computing, Inc. both shape the evolving landscape of computer hardware with distinct market approaches.
Seagate Technology Holdings plc: Data Storage Powerhouse
Seagate dominates the mass capacity storage market with enterprise HDDs and SSDs, catering to OEMs and retailers globally. Its revenue chiefly stems from high-volume hardware sales across diverse categories including video, gaming, and legacy storage solutions. In 2026, Seagate sharpens its focus on expanding the Lyve edge-to-cloud platform, targeting scalable data management for enterprise clients.
Quantum Computing, Inc.: Quantum Software Innovator
Quantum Computing, Inc. leads in quantum application acceleration, offering Qatalyst software that bridges conventional and quantum computing. Its revenue relies on licensing and supporting quantum-ready applications for commercial and government sectors. The company emphasizes advancing integration with multiple quantum processing units, enhancing developer accessibility and accelerating quantum adoption in 2026.
Strategic Collision: Similarities & Divergences
Seagate pursues a hardware-centric, scale-driven model focusing on physical data storage, while Quantum Computing embraces a software-first, cutting-edge innovation philosophy. Their competition centers on the future of computing infrastructure—traditional storage versus quantum-enabled processing. Investors face contrasting profiles: Seagate offers stability with established market clout; Quantum presents high volatility coupled with frontier technology potential.
Income Statement Comparison
This data dissects the core profitability and scalability of both corporate engines to reveal who dominates the bottom line:

| Metric | Seagate Technology Holdings plc (STX) | Quantum Computing, Inc. (QUBT) |
|---|---|---|
| Revenue | 9.1B | 373K |
| Cost of Revenue | 5.9B | 4.1M |
| Operating Expenses | 1.31B | 22.3M |
| Gross Profit | 3.2B | -3.7M |
| EBITDA | 2.1B | -62.2M |
| EBIT | 1.83B | -66.0M |
| Interest Expense | 321M | 2.5M |
| Net Income | 1.47B | -68.5M |
| EPS | 6.93 | -0.73 |
| Fiscal Year | 2025 | 2024 |
Income Statement Analysis: The Bottom-Line Duel
This income statement comparison reveals which company operates with superior efficiency and profit generation capabilities.
Seagate Technology Holdings plc Analysis
Seagate’s revenue dipped overall from 10.7B in 2021 to 9.1B in 2025 but surged 39% from 2024 to 2025. Net income recovered sharply to 1.47B in 2025 from a loss in 2023, driving a strong 16.2% net margin. Its gross and EBIT margins remain robust, signaling effective cost control and operational momentum.
Quantum Computing, Inc. Analysis
Quantum Computing’s revenue remains negligible at 373K in 2024, with persistent gross losses widening to -3.7M. The company reports deep net losses of 68.5M in 2024, reflecting severe inefficiency and negative margins exceeding -18,000%. Despite modest revenue growth, its losses and high expenses erode any profitability prospects.
Margin Power vs. Revenue Scale
Seagate dominates with a favorable income trajectory, healthy margins, and strong net income growth. Quantum Computing struggles with negative margins and escalating losses. For investors, Seagate’s proven profitability and margin resilience offer a fundamentally stronger profile than Quantum’s high-risk, unprofitable stance.
Financial Ratios Comparison
These vital ratios act as a diagnostic tool to expose the underlying fiscal health, valuation premiums, and capital efficiency of the companies compared below:
| Ratios | Seagate Technology Holdings plc (STX) | Quantum Computing, Inc. (QUBT) |
|---|---|---|
| ROE | -3.24% (2025) | -63.89% (2024) |
| ROIC | 33.76% (2025) | -17.41% (2024) |
| P/E | 20.41x (2025) | -22.67x (2024) |
| P/B | -66.19 (2025) | 14.48 (2024) |
| Current Ratio | 1.38 (2025) | 17.36 (2024) |
| Quick Ratio | 0.84 (2025) | 17.36 (2024) |
| D/E (Debt-to-Equity) | -11.86 (2025) | 0.011 (2024) |
| Debt-to-Assets | 67.0% (2025) | 0.77% (2024) |
| Interest Coverage | 5.89x (2025) | -10.39x (2024) |
| Asset Turnover | 1.13 (2025) | 0.0024 (2024) |
| Fixed Asset Turnover | 5.49 (2025) | 0.038 (2024) |
| Payout Ratio | 40.8% (2025) | -0.31% (2024) |
| Dividend Yield | 2.00% (2025) | 0.014% (2024) |
| Fiscal Year | 2025 | 2024 |
Efficiency & Valuation Duel: The Vital Signs
Financial ratios serve as a company’s DNA, unveiling hidden risks and operational strengths crucial for investment insight.
Seagate Technology Holdings plc
Seagate shows favorable net margin at 16.15% but posts a highly negative ROE of -324%, signaling shareholder returns under pressure. Its P/E of 20.41 suggests a neutral valuation, while a 2.0% dividend yield indicates steady shareholder cash returns. The firm balances efficiency with a solid ROIC of 33.76%, reflecting disciplined capital use.
Quantum Computing, Inc.
Quantum Computing suffers from deeply negative profitability metrics, including a net margin of -18,375% and ROE of -64%. The stock appears cheap with a negative P/E at -22.67 but carries unfavorable operational efficiency and liquidity concerns. Its minimal 0.01% dividend yield and weak ROIC of -17.41% highlight ongoing struggles to generate shareholder value.
Operational Strength vs. Profitability Challenges
Seagate offers a better balance of operational efficiency and shareholder returns despite mixed equity profitability. Quantum’s metrics reveal severe profitability and risk issues. Investors seeking operational stability may prefer Seagate, while those accepting high risk should note Quantum’s ongoing challenges.
Which one offers the Superior Shareholder Reward?
I see Seagate Technology Holdings plc (STX) delivers consistent dividends with a 2.0% yield and a reasonable 41% payout ratio, supported by strong free cash flow coverage (FCF/Capex + Dividend ratio >1.25). STX also actively repurchases shares, enhancing total shareholder return sustainably. Quantum Computing, Inc. (QUBT) barely pays dividends (0.01% yield) and lacks buyback activity. It burns cash with negative margins and reinvests heavily in R&D and growth, reflecting early-stage risk. I judge STX’s balanced dividend and buyback model more sustainable and rewarding for shareholders in 2026.
Comparative Score Analysis: The Strategic Profile
The radar chart reveals the fundamental DNA and trade-offs of Seagate Technology Holdings plc and Quantum Computing, Inc., highlighting their financial strengths and weaknesses:

Seagate dominates in profitability metrics, scoring 5 in ROE and ROA, while Quantum lags at 1 in both. Quantum boasts a stronger balance sheet with a debt-to-equity score of 4 versus Seagate’s weak 1. Valuation scores favor neither, both scoring low. Seagate shows a more imbalanced profile with high leverage risk; Quantum relies on financial stability rather than operational efficiency.
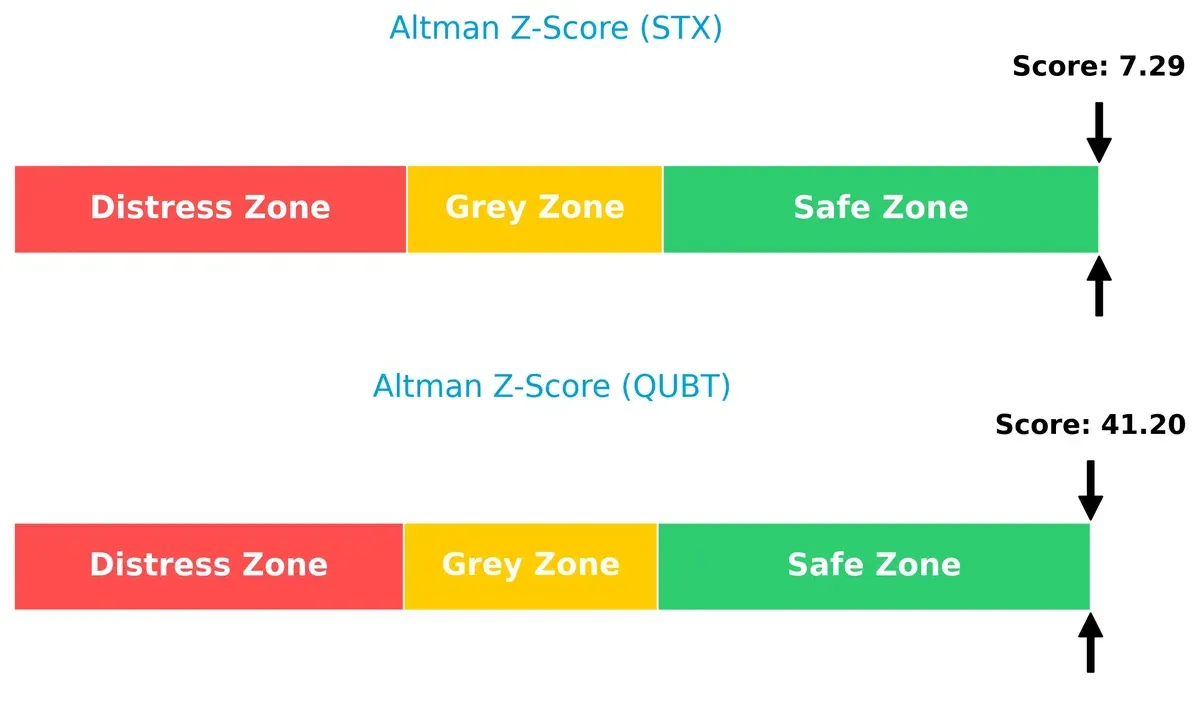
Bankruptcy Risk: Solvency Showdown
The Altman Z-Score gap strongly favors Quantum, scoring 41.2 versus Seagate’s 7.3, both safely above distress thresholds, signaling robust long-term survival prospects:
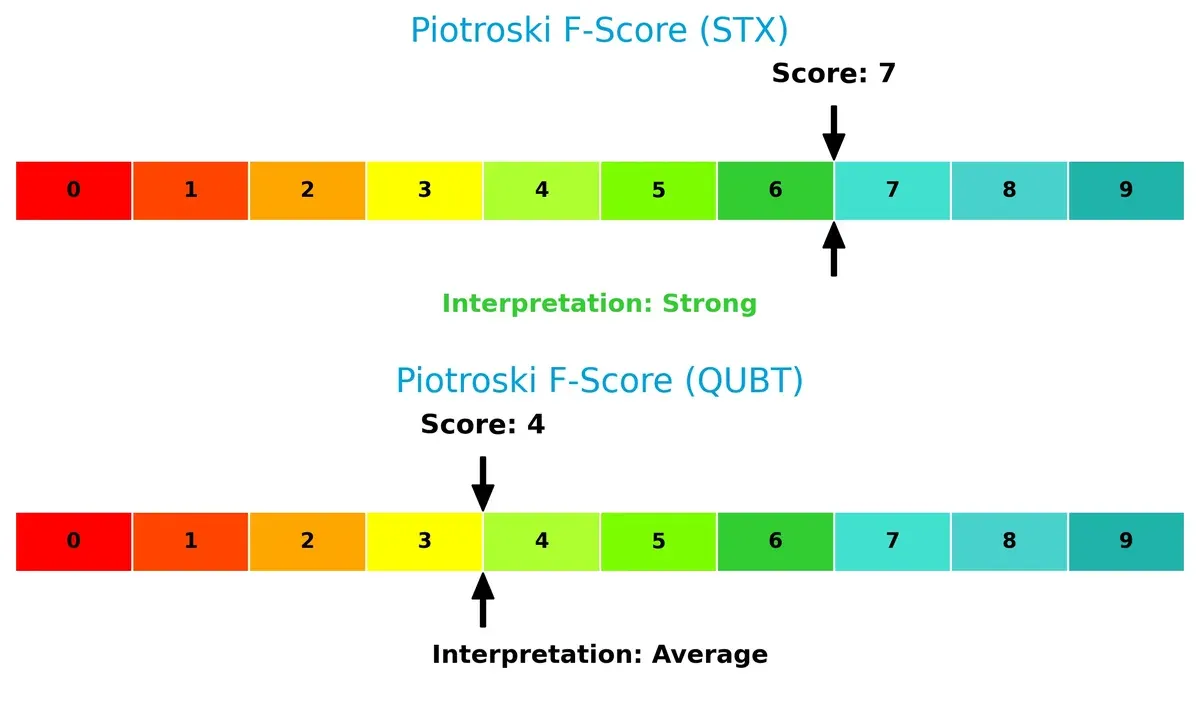
Financial Health: Quality of Operations
Seagate’s Piotroski F-Score of 7 signals strong financial health, outperforming Quantum’s average score of 4. Quantum shows internal red flags affecting operational quality:
How are the two companies positioned?
This section dissects the operational DNA of Seagate Technology Holdings plc and Quantum Computing, Inc. by comparing their revenue distribution and internal strengths and weaknesses. The goal is to confront their economic moats to identify which business model offers the most resilient, sustainable competitive advantage today.
Strengths and Weaknesses Comparison
This table compares the strengths and weaknesses of Seagate Technology Holdings plc (STX) and Quantum Computing, Inc. (QUBT):
STX Strengths
- Favorable net margin of 16.15%
- Strong ROIC at 33.76% above WACC
- High asset and fixed asset turnover
- Diverse global revenue with strong US and Singapore presence
- Positive dividend yield at 2.0%
QUBT Strengths
- Favorable quick ratio at 17.36 indicating liquidity
- Low debt-to-assets at 0.77% reducing financial risk
- Favorable debt-to-equity ratio near zero
- Positive PE status despite negative value
- Some service revenue reported
STX Weaknesses
- Negative ROE at -324.28% signals poor equity returns
- High debt-to-assets at 66.97% increases leverage risk
- WACC of 11.21% unfavorable against ROIC
- Neutral liquidity ratios suggest limited short-term flexibility
- Negative PB ratio raises valuation concerns
QUBT Weaknesses
- Severely negative net margin and ROE indicate unprofitability
- Negative ROIC and interest coverage reveal operational weakness
- Very high WACC at 20.54% raises capital costs
- Asset turnover near zero reflects poor asset utilization
- Minimal dividend yield and unfavorable PB ratio
STX exhibits robust operational efficiency and global diversification but faces capital structure and equity return challenges. QUBT struggles with profitability and asset use despite strong liquidity and low leverage, highlighting critical risks to its financial stability and growth.
The Moat Duel: Analyzing Competitive Defensibility
A structural moat is the only true shield that protects long-term profits from relentless competitive erosion. Here’s how these two firms stack up:
Seagate Technology Holdings plc: Cost Advantage and Scale Moat
Seagate’s moat centers on cost-efficient mass storage production and global supply scale. This drives strong ROIC above WACC and margin stability. In 2026, expanding Lyve edge-to-cloud platforms could deepen this advantage.
Quantum Computing, Inc.: Innovation-Dependent Moat
Quantum’s moat relies on proprietary quantum software and partnerships, contrasting Seagate’s scale. It struggles with negative ROIC, shedding value, yet rising profitability hints at future breakthrough potential in quantum-ready applications.
The Moat Verdict: Scale Efficiency vs. Innovation Potential
Seagate boasts a wider, financially proven moat with robust value creation and margin resilience. Quantum’s moat is narrower and riskier but shows early signs of growing ROIC. Seagate is better equipped today to defend its market share.
Which stock offers better returns?
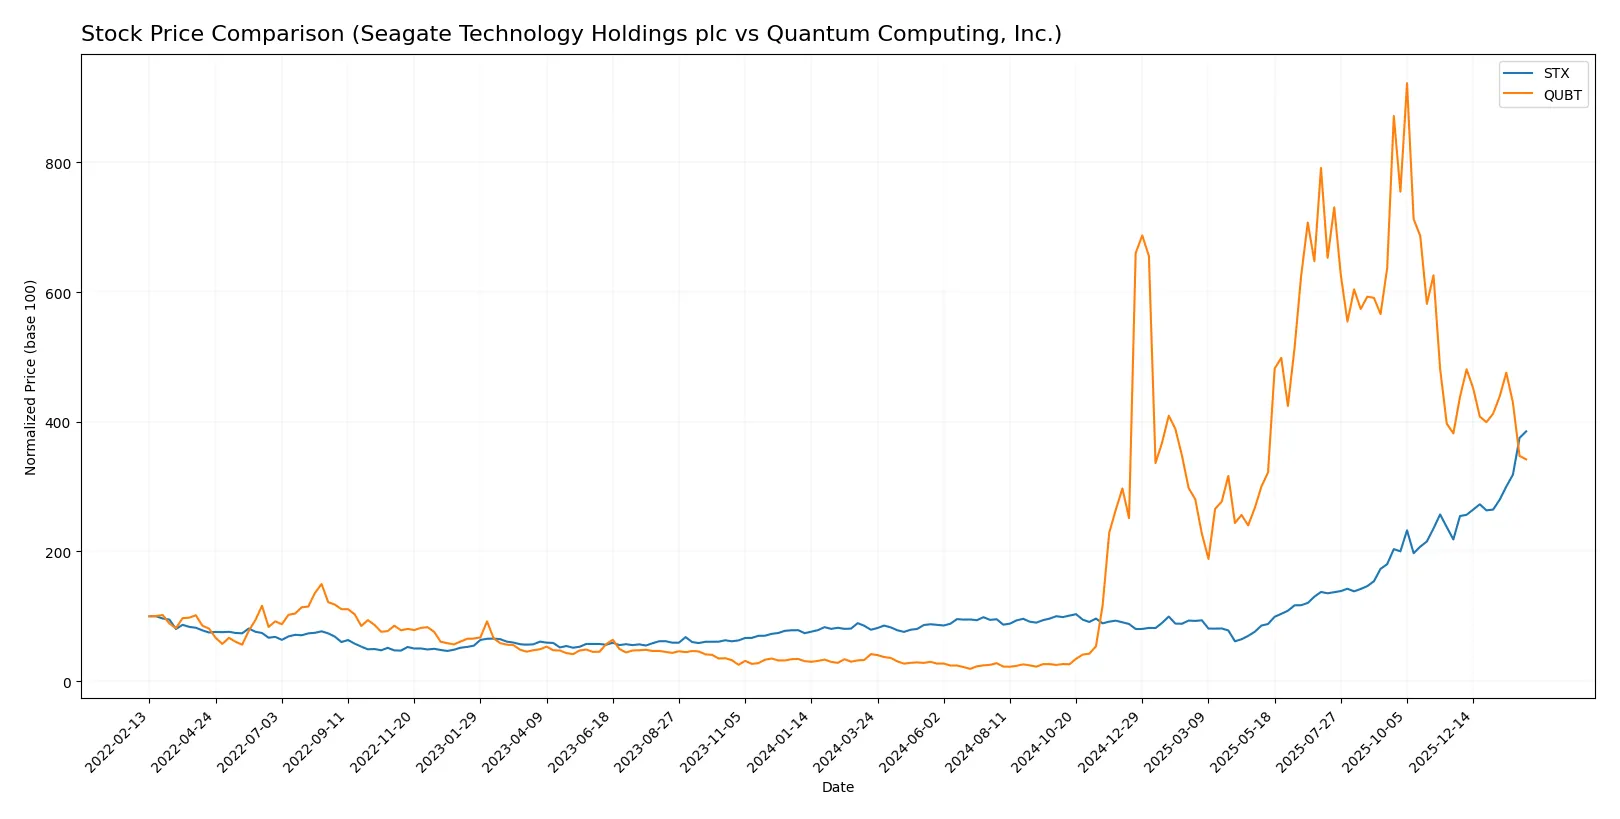
The past year shows significant price surges for both stocks, with Seagate Technology accelerating upward while Quantum Computing faces recent weakening in gains.
Trend Comparison
Seagate Technology’s stock surged 387% over the past 12 months, showing a bullish trend with accelerating momentum and a high volatility of 78.67. The price ranged from 67 to 419.
Quantum Computing’s stock rose 723% overall but with decelerating gains. Recently, it declined 10.5% over the last 2.5 months, indicating a bearish short-term trend despite low volatility of 6.8.
Seagate Technology outperformed Quantum Computing recently, showing stronger positive momentum. However, Quantum Computing delivered the highest cumulative return over the full year.
Target Prices
Analysts present a mixed but constructive target consensus for Seagate Technology Holdings plc and Quantum Computing, Inc.
| Company | Target Low | Target High | Consensus |
|---|---|---|---|
| Seagate Technology Holdings plc | 270 | 505 | 407.2 |
| Quantum Computing, Inc. | 12 | 40 | 22.67 |
Seagate’s consensus target at 407.2 sits slightly below its current price of 418.63, signaling modest downside risk. Quantum Computing’s consensus target of 22.67 suggests significant upside from its 9.13 market price, reflecting high growth expectations.
How do institutions grade them?
The institutional grades for Seagate Technology Holdings plc and Quantum Computing, Inc. are as follows:
Seagate Technology Holdings plc Grades
The following table summarizes recent grades assigned by established financial institutions:
| Grading Company | Action | New Grade | Date |
|---|---|---|---|
| Cantor Fitzgerald | Maintain | Overweight | 2026-02-04 |
| Citigroup | Maintain | Buy | 2026-01-29 |
| Baird | Maintain | Outperform | 2026-01-29 |
| Rosenblatt | Maintain | Buy | 2026-01-28 |
| UBS | Maintain | Neutral | 2026-01-28 |
| Barclays | Maintain | Equal Weight | 2026-01-28 |
| Mizuho | Maintain | Outperform | 2026-01-28 |
| Goldman Sachs | Maintain | Buy | 2026-01-28 |
| Wells Fargo | Maintain | Equal Weight | 2026-01-28 |
| Cantor Fitzgerald | Maintain | Overweight | 2026-01-28 |
Quantum Computing, Inc. Grades
The following table summarizes recent grades assigned by established financial institutions:
| Grading Company | Action | New Grade | Date |
|---|---|---|---|
| Ascendiant Capital | Maintain | Buy | 2025-12-22 |
| Cantor Fitzgerald | Maintain | Neutral | 2025-12-18 |
| Lake Street | Maintain | Buy | 2025-11-17 |
| Ascendiant Capital | Maintain | Buy | 2025-10-03 |
| Ascendiant Capital | Maintain | Buy | 2025-06-06 |
| Ascendiant Capital | Maintain | Buy | 2025-04-28 |
| Ascendiant Capital | Maintain | Buy | 2024-11-13 |
| Ascendiant Capital | Maintain | Buy | 2023-11-24 |
Which company has the best grades?
Seagate Technology holds a wider range of positive ratings, including multiple “Buy” and “Outperform” grades from top-tier firms. Quantum Computing, Inc. consistently receives “Buy” ratings but from fewer, less diversified sources. This breadth may provide investors with greater confidence in Seagate’s outlook.

Don’t Let Luck Decide Your Entry Point
Optimize your entry points with our advanced ProRealTime indicators. You’ll get efficient buy signals with precise price targets for maximum performance. Start outperforming now!
Risks specific to each company
The following categories identify the critical pressure points and systemic threats facing both firms in the 2026 market environment:
1. Market & Competition
Seagate Technology Holdings plc
- Faces intense competition in mature data storage markets with pressure on pricing and innovation cycles.
Quantum Computing, Inc.
- Operates in a nascent, highly volatile market with uncertain adoption curves and strong competition from established tech giants.
2. Capital Structure & Debt
Seagate Technology Holdings plc
- High debt-to-assets ratio at 67% signals elevated financial leverage and refinancing risks.
Quantum Computing, Inc.
- Very low debt-to-assets ratio under 1%, indicating conservative leverage but limited capital for rapid scaling.
3. Stock Volatility
Seagate Technology Holdings plc
- Beta of 1.64 suggests above-average sensitivity to market swings but within typical tech hardware range.
Quantum Computing, Inc.
- Exceptionally high beta of 3.49 points to extreme volatility and speculative trading patterns.
4. Regulatory & Legal
Seagate Technology Holdings plc
- Subject to global data storage regulations and IP litigation risks typical for hardware manufacturers.
Quantum Computing, Inc.
- Faces emerging regulatory scrutiny around quantum tech export controls and government contracts compliance.
5. Supply Chain & Operations
Seagate Technology Holdings plc
- Large global operations dependent on complex supply chains vulnerable to geopolitical disruptions.
Quantum Computing, Inc.
- Small scale and software focus reduce supply chain exposure but increase risk from talent shortages.
6. ESG & Climate Transition
Seagate Technology Holdings plc
- Pressure to improve energy efficiency in manufacturing and reduce carbon footprint in line with industry norms.
Quantum Computing, Inc.
- Still developing ESG policies; faces investor scrutiny on sustainability and ethical AI development practices.
7. Geopolitical Exposure
Seagate Technology Holdings plc
- Significant international exposure, especially in Asia, subject to trade tensions and tariffs.
Quantum Computing, Inc.
- Primarily US-based with moderate geopolitical risk but sensitive to government funding shifts and policy changes.
Which company shows a better risk-adjusted profile?
Seagate’s most impactful risk is its heavy debt load, increasing financial vulnerability despite stable operations. Quantum Computing’s greatest risk lies in extreme stock volatility and unproven market viability. Seagate’s established market position and safer Altman Z-Score signal a better risk-adjusted profile. Quantum’s high beta and unfavorable profitability ratios justify caution.
Final Verdict: Which stock to choose?
Seagate Technology Holdings plc (STX) stands out with its superpower of delivering strong and growing returns on invested capital, reflecting a robust and sustainable competitive advantage. Its key point of vigilance is the elevated debt-to-assets ratio, which warrants careful monitoring. STX fits well in portfolios targeting steady value creation and moderate growth.
Quantum Computing, Inc. (QUBT) boasts a strategic moat anchored in cutting-edge quantum technology and R&D intensity, positioning it for potential disruptive growth. Relative to STX, it carries higher operational risk and weaker profitability metrics, reflecting an early-stage profile. QUBT suits investors with a high-risk tolerance seeking speculative growth and innovation exposure.
If you prioritize consistent value creation and proven profitability, STX is the compelling choice due to its strong ROIC exceeding WACC and solid income growth. However, if you seek speculative growth with exposure to frontier technology, QUBT offers a chance to capitalize on emerging innovation despite its current financial instability. Both scenarios require prudent risk management aligned with your investment horizon.
Disclaimer: Investment carries a risk of loss of initial capital. The past performance is not a reliable indicator of future results. Be sure to understand risks before making an investment decision.
Go Further
I encourage you to read the complete analyses of Seagate Technology Holdings plc and Quantum Computing, Inc. to enhance your investment decisions: