Quantum Computing, Inc. (QUBT) and Arqit Quantum Inc. (ARQQ) represent two cutting-edge players in the rapidly evolving quantum technology sector. While QUBT focuses on quantum software tools and multi-platform quantum processing units, ARQQ pioneers quantum cybersecurity solutions leveraging satellite networks. Their innovative approaches and market overlap make them compelling candidates for investors seeking exposure to quantum advancements. In this article, I will help you identify which company offers the most promising investment opportunity.
Table of contents
Companies Overview
I will begin the comparison between Quantum Computing, Inc. and Arqit Quantum Inc. by providing an overview of these two companies and their main differences.
Quantum Computing, Inc. Overview
Quantum Computing, Inc. is a technology firm based in Virginia, specializing in software tools and applications for quantum computers. The company provides Qatalyst, a quantum application accelerator, and supports multiple quantum processing units including DWave, Rigetti, and IonQ. It targets both commercial and government sectors and had a market cap of 1.5B USD as of 2026.
Arqit Quantum Inc. Overview
Arqit Quantum Inc., headquartered in London, UK, operates in the technology sector focusing on cybersecurity through satellite and terrestrial platforms. Its main product, QuantumCloud, allows devices to create encryption keys via a lightweight software agent. The company is smaller with a market cap of 384M USD and employs 82 full-time staff.
Key similarities and differences
Both companies operate in the technology sector with a focus on quantum-related technologies, but Quantum Computing, Inc. emphasizes quantum software and hardware integration, while Arqit centers on cybersecurity solutions using quantum encryption. Quantum Computing serves government and commercial clients, whereas Arqit focuses on secure communications. Quantum Computing is larger by market cap and employs fewer staff than Arqit.
Income Statement Comparison
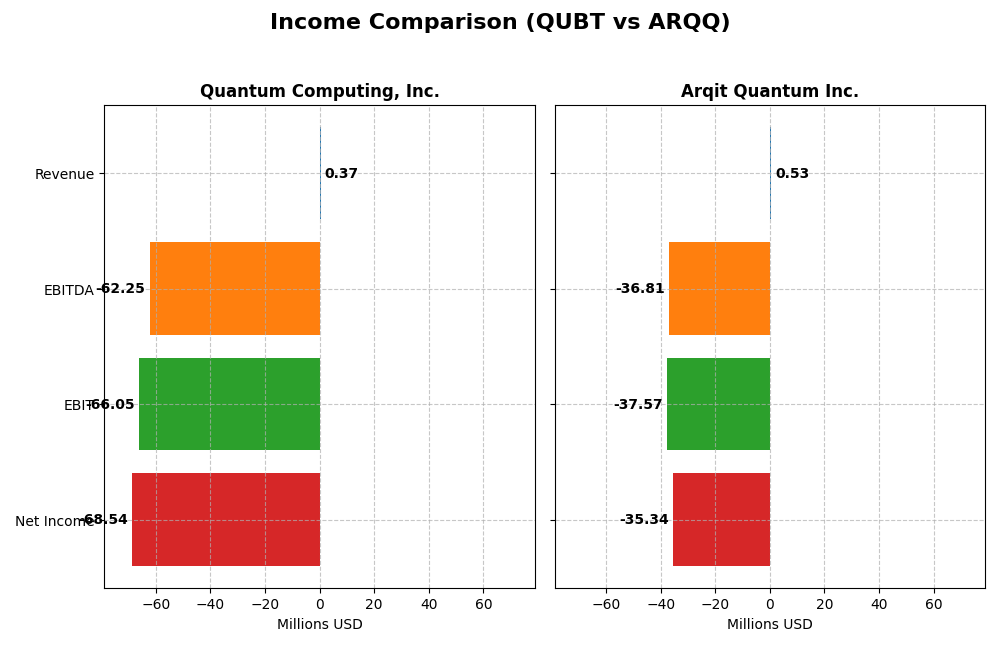
Below is the income statement comparison for Quantum Computing, Inc. and Arqit Quantum Inc. for their most recent fiscal year, highlighting key financial metrics.
| Metric | Quantum Computing, Inc. (QUBT) | Arqit Quantum Inc. (ARQQ) |
|---|---|---|
| Market Cap | 1.5B | 384M |
| Revenue | 373K | 530K |
| EBITDA | -62.2M | -36.8M |
| EBIT | -66.0M | -37.6M |
| Net Income | -68.5M | -35.3M |
| EPS | -0.73 | -2.56 |
| Fiscal Year | 2024 | 2025 |
Income Statement Interpretations
Quantum Computing, Inc.
Quantum Computing, Inc. experienced minimal revenue growth from 2020 to 2024, reaching $373K in 2024, yet net income remained deeply negative at -$68.5M in 2024. Margins have been consistently unfavorable, with gross and net margins showing significant deficits. The most recent year saw a slight revenue increase but worsening profitability and margin declines, highlighting ongoing operational challenges.
Arqit Quantum Inc.
Arqit Quantum’s revenue surged dramatically, reaching $530K in 2025, reflecting strong growth over the period. Despite a negative net income of -$35.3M in 2025, the company improved margins compared to prior years. Notably, growth in gross profit and net margin over the latest year was favorable, though EBIT margins remain deeply negative, reflecting ongoing heavy expenses and investment.
Which one has the stronger fundamentals?
Arqit Quantum demonstrates stronger fundamentals with significant revenue and net income growth and favorable margin improvements over time, despite ongoing losses. Quantum Computing shows stagnation in revenue with persistent deep losses and deteriorating margins. While both face challenges, Arqit’s overall income statement trajectory appears more positive relative to Quantum Computing’s unfavorable trends.
Financial Ratios Comparison
The table below compares key financial ratios of Quantum Computing, Inc. (QUBT) and Arqit Quantum Inc. (ARQQ) based on their most recent fiscal year data available.
| Ratios | Quantum Computing, Inc. (2024) | Arqit Quantum Inc. (2025) |
|---|---|---|
| ROE | -63.9% | -129.8% |
| ROIC | -17.4% | -127.5% |
| P/E | -22.7 | -15.1 |
| P/B | 14.5 | 19.6 |
| Current Ratio | 17.4 | 2.69 |
| Quick Ratio | 17.4 | 2.69 |
| D/E (Debt-to-Equity) | 0.011 | 0.026 |
| Debt-to-Assets | 0.008 | 0.017 |
| Interest Coverage | -10.4 | -802.9 |
| Asset Turnover | 0.0024 | 0.0124 |
| Fixed Asset Turnover | 0.038 | 0.736 |
| Payout Ratio | -0.31% | 0% |
| Dividend Yield | 0.014% | 0% |
Interpretation of the Ratios
Quantum Computing, Inc.
Quantum Computing, Inc. displays mostly unfavorable financial ratios, including negative net margin (-18375.87%) and return on equity (-63.89%), signaling operational and profitability challenges. However, the company shows favorable debt-to-equity (0.01) and quick ratio (17.36), indicating low leverage and strong liquidity. Quantum Computing does not pay dividends, likely due to negative earnings and a focus on reinvestment in R&D and growth.
Arqit Quantum Inc.
Arqit Quantum Inc. also reports predominantly unfavorable ratios, with a net margin of -6668.49% and return on equity at -129.77%, reflecting significant losses. The firm shows a healthier current ratio (2.69) and low debt-to-equity (0.03), which are favorable. Arqit does not pay dividends, suggesting it prioritizes reinvestment and development over shareholder payouts amid ongoing losses.
Which one has the best ratios?
Both companies have an overall unfavorable ratio profile, but Arqit Quantum Inc. exhibits a slightly higher proportion of favorable ratios (35.71%) compared to Quantum Computing, Inc. (28.57%). Arqit’s better liquidity and manageable leverage contrast with Quantum’s extreme valuation multiples and liquidity concerns, though both face significant profitability and operational risks.
Strategic Positioning
This section compares the strategic positioning of Quantum Computing, Inc. and Arqit Quantum Inc., including market position, key segments, and exposure to technological disruption:
Quantum Computing, Inc.
- Market position and competitive pressure
- Key segments and business drivers
- Exposure to technological disruption
Arqit Quantum Inc.
- Larger market cap ($1.5B), higher volatility (beta 3.8)
- Software tools for quantum computing; serves commercial and government sectors
- Develops quantum-ready applications and multiple quantum processing units
Quantum Computing, Inc. vs Arqit Quantum Inc. Positioning
Quantum Computing, Inc. focuses on diversified quantum software and hardware solutions targeting commercial and government clients, while Arqit concentrates on specialized cybersecurity via quantum encryption. The former has broader product scope; the latter is more niche and geographically focused.
Which has the best competitive advantage?
Both companies are currently shedding value with negative ROIC compared to WACC but exhibit growing profitability trends. Their economic moats are slightly unfavorable, indicating limited competitive advantage based on recent capital efficiency data.
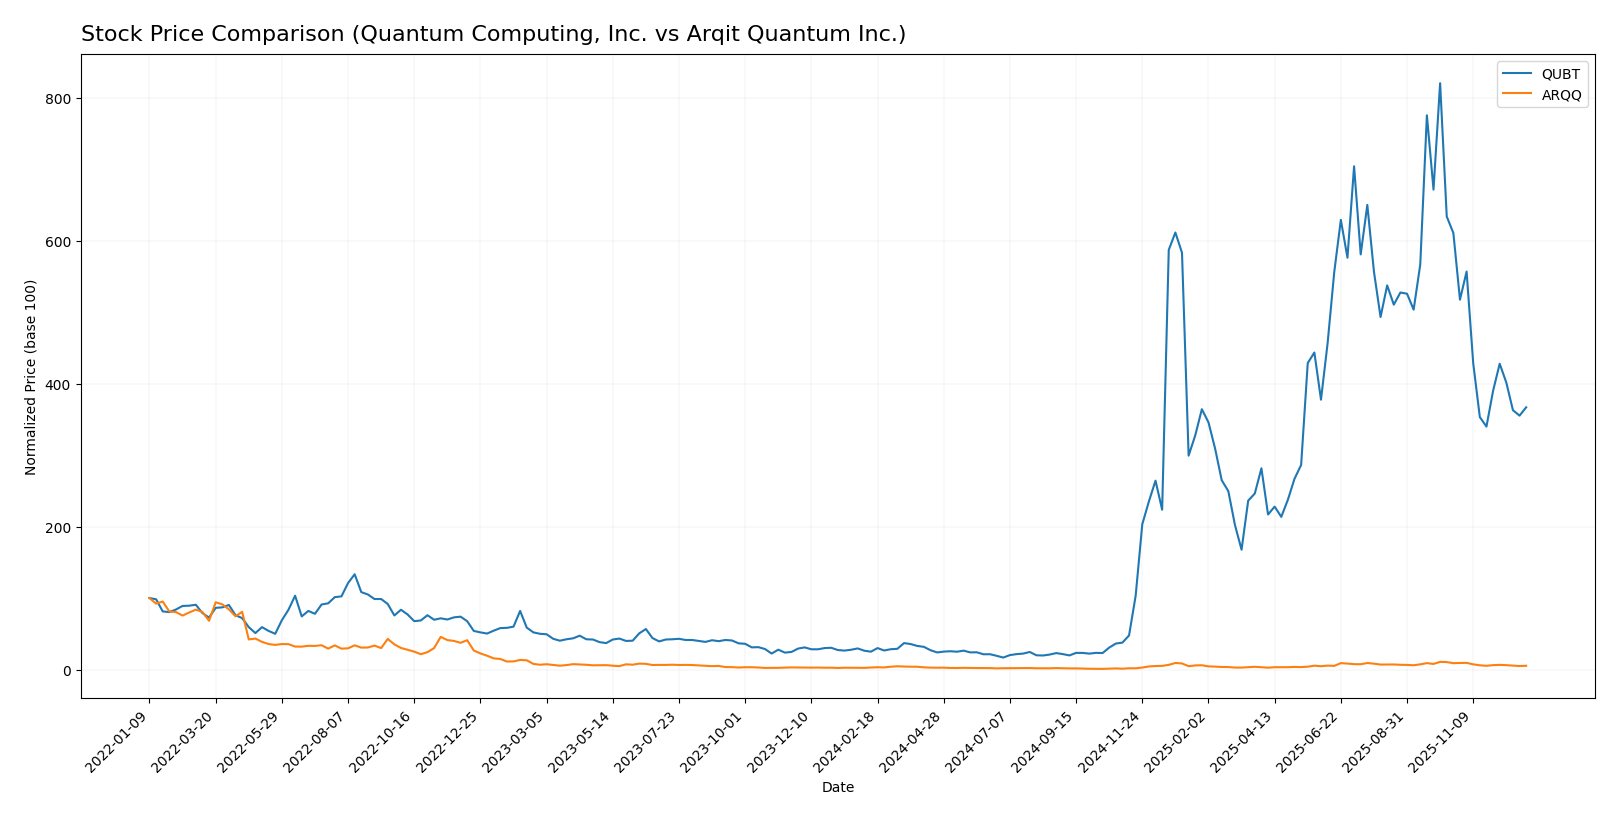
Stock Comparison
The stock price chart over the past year reveals strong bullish momentum for both Quantum Computing, Inc. (QUBT) and Arqit Quantum Inc. (ARQQ), with notable deceleration and recent downward corrections in their trading dynamics.
Trend Analysis
Quantum Computing, Inc. (QUBT) exhibited a robust bullish trend with a 1369.18% price increase over the past 12 months, although this growth showed deceleration. The stock’s recent three-month trend reversed with a 39.93% decline.
Arqit Quantum Inc. (ARQQ) also delivered a bullish trend, rising 85.21% over the past year but with deceleration. Its recent three-month performance declined by 40.85%, indicating a sharper downward slope than QUBT.
Comparing both, QUBT outperformed ARQQ significantly in overall market performance, despite both stocks facing recent bearish trends and seller dominance in volume.
Target Prices
The consensus target prices from recognized analysts present a clear range of expectations for these two technology companies.
| Company | Target High | Target Low | Consensus |
|---|---|---|---|
| Quantum Computing, Inc. | 40 | 10 | 19.5 |
| Arqit Quantum Inc. | 60 | 60 | 60 |
Analysts expect Quantum Computing, Inc.’s stock to more than double from its current $11.01, while Arqit Quantum’s target at $60 is significantly above its current $24.54 price, indicating strong bullish sentiment.
Analyst Opinions Comparison
This section compares analysts’ ratings and financial grades for Quantum Computing, Inc. and Arqit Quantum Inc.:
Rating Comparison
Quantum Computing, Inc. Rating
- Rating: C+ with a very favorable status
- Discounted Cash Flow Score: 2, moderate rating
- ROE Score: 1, very unfavorable rating
- ROA Score: 1, very unfavorable rating
- Debt To Equity Score: 5, very favorable rating
- Overall Score: 2, moderate rating
Arqit Quantum Inc. Rating
- Rating: C with a very favorable status
- Discounted Cash Flow Score: 2, moderate rating
- ROE Score: 1, very unfavorable rating
- ROA Score: 1, very unfavorable rating
- Debt To Equity Score: 4, favorable rating
- Overall Score: 2, moderate rating
Which one is the best rated?
Quantum Computing, Inc. and Arqit Quantum Inc. share identical overall and DCF scores, both moderate. Quantum Computing has a better debt to equity score, while both have very unfavorable ROE and ROA scores. Quantum Computing’s rating is slightly higher (C+ vs. C).
Scores Comparison
Here is a comparison of the Altman Z-Score and Piotroski Score for Quantum Computing, Inc. and Arqit Quantum Inc.:
Quantum Computing, Inc. Scores
- Altman Z-Score: 50.17, indicating a safe zone.
- Piotroski Score: 4, indicating average financial strength.
Arqit Quantum Inc. Scores
- Altman Z-Score: -1.46, indicating distress zone.
- Piotroski Score: 2, indicating very weak financial strength.
Which company has the best scores?
Quantum Computing, Inc. shows a significantly higher Altman Z-Score, signaling strong financial stability, and a better Piotroski Score compared to Arqit Quantum Inc., which falls into financial distress with weaker scores.
Grades Comparison
The following presents a comparison of recent grades for Quantum Computing, Inc. and Arqit Quantum Inc.:
Quantum Computing, Inc. Grades
This table summarizes the latest grades assigned to Quantum Computing, Inc. by reputable grading firms.
| Grading Company | Action | New Grade | Date |
|---|---|---|---|
| Ascendiant Capital | Maintain | Buy | 2025-12-22 |
| Cantor Fitzgerald | Maintain | Neutral | 2025-12-18 |
| Lake Street | Maintain | Buy | 2025-11-17 |
| Ascendiant Capital | Maintain | Buy | 2025-10-03 |
| Ascendiant Capital | Maintain | Buy | 2025-06-06 |
| Ascendiant Capital | Maintain | Buy | 2025-04-28 |
| Ascendiant Capital | Maintain | Buy | 2024-11-13 |
| Ascendiant Capital | Maintain | Buy | 2023-11-24 |
Overall, Quantum Computing, Inc. maintains a predominantly Buy rating with one Neutral, showing consistent positive sentiment.
Arqit Quantum Inc. Grades
This table details the continuous Buy ratings assigned to Arqit Quantum Inc. by a recognized grading company.
| Grading Company | Action | New Grade | Date |
|---|---|---|---|
| HC Wainwright & Co. | Maintain | Buy | 2025-10-13 |
| HC Wainwright & Co. | Maintain | Buy | 2025-09-18 |
| HC Wainwright & Co. | Maintain | Buy | 2024-12-31 |
| HC Wainwright & Co. | Maintain | Buy | 2024-12-06 |
| HC Wainwright & Co. | Maintain | Buy | 2024-07-11 |
| HC Wainwright & Co. | Maintain | Buy | 2024-05-29 |
| HC Wainwright & Co. | Maintain | Buy | 2024-05-15 |
| HC Wainwright & Co. | Maintain | Buy | 2023-11-22 |
| HC Wainwright & Co. | Maintain | Buy | 2023-09-27 |
| HC Wainwright & Co. | Maintain | Buy | 2023-09-26 |
Arqit Quantum Inc. enjoys uninterrupted Buy ratings from HC Wainwright & Co., reflecting strong and stable analyst confidence.
Which company has the best grades?
Both companies have received predominantly Buy ratings; however, Arqit Quantum Inc. shows uninterrupted Buy grades, while Quantum Computing, Inc. includes a Neutral rating. This consistency may influence investor perceptions of stability and confidence.
Strengths and Weaknesses
The table below compares key strengths and weaknesses of Quantum Computing, Inc. (QUBT) and Arqit Quantum Inc. (ARQQ) based on the most recent financial and operational data.
| Criterion | Quantum Computing, Inc. (QUBT) | Arqit Quantum Inc. (ARQQ) |
|---|---|---|
| Diversification | Limited product range, mainly services segment (346K USD in 2024) | Narrow focus, no reported revenue diversification |
| Profitability | Negative net margin (-18,376%), ROIC -17.41%, but improving ROIC trend | Negative net margin (-6,668%), ROIC -127.45%, improving ROIC trend |
| Innovation | Moderate innovation potential with growing ROIC trend | Moderate innovation potential with growing ROIC trend |
| Global presence | Presence in emerging quantum computing market with potential for expansion | Limited data on global footprint; early stage development |
| Market Share | Small market share, value destroying but improving efficiency | Small market share, significant value destruction but improving |
Key takeaways: Both companies are currently value destroyers with negative profitability metrics but show improving ROIC trends, indicating potential for future growth. However, their limited diversification and small market shares suggest higher risk, requiring cautious position sizing for investors.
Risk Analysis
Below is a comparative overview of key risks facing Quantum Computing, Inc. (QUBT) and Arqit Quantum Inc. (ARQQ) as of the most recent fiscal years.
| Metric | Quantum Computing, Inc. (QUBT) | Arqit Quantum Inc. (ARQQ) |
|---|---|---|
| Market Risk | High beta (3.8) indicates strong volatility and sensitivity to market swings. | Moderate beta (2.4) suggests notable but lower volatility than QUBT. |
| Debt Level | Very low debt-to-equity (0.01), minimal leverage risk. | Low debt-to-equity (0.03), manageable financial risk. |
| Regulatory Risk | US-based, subject to evolving tech and export regulations. | UK-based, exposed to EU/UK regulatory changes in cybersecurity. |
| Operational Risk | Small team (41 employees), scalability and execution challenges. | Larger workforce (82 employees), but still early-stage operational risks. |
| Environmental Risk | Limited direct exposure; technology sector generally low impact. | Similar low environmental footprint. |
| Geopolitical Risk | US location shields from some geopolitical uncertainties but exposed to US-China tech tensions. | UK location involves Brexit-related trade and data sovereignty uncertainties. |
In synthesis, both companies face significant market risk driven by high volatility and negative profitability metrics. QUBT’s extremely high beta and very unfavorable return on equity amplify its risk profile despite low debt. ARQQ’s distress-level Altman Z-score and weak Piotroski score suggest financial instability, making its bankruptcy risk more pronounced. Investors should be cautious, prioritizing robust risk management given the nascent and volatile nature of the quantum technology sector.
Which Stock to Choose?
Quantum Computing, Inc. (QUBT) shows a slight revenue growth of 4.19% in 2024 but suffers from largely unfavorable profitability with a net margin of -18375.87% and negative returns on equity and invested capital. Its debt levels are low with a debt-to-equity ratio of 0.01, and it holds a very favorable credit rating of C+. However, the overall financial ratios and income statement evaluations remain unfavorable, indicating value destruction despite improving ROIC trends.
Arqit Quantum Inc. (ARQQ) experienced significant revenue growth of 80.89% in 2025 and mostly favorable income statement growth metrics, yet it faces deeply negative profitability ratios including a net margin of -6668.49%. Its debt-to-equity ratio stands at a low 0.03, with a credit rating of C, also very favorable. Despite this, financial ratios largely remain unfavorable, and the company is considered to be shedding value, although its ROIC trend is improving.
For investors, the choice might depend on risk tolerance and investment goals: those seeking exposure to rapid revenue growth with improving profitability trends may find ARQQ more aligned with growth strategies, whereas investors prioritizing lower debt burden and a slightly more stable financial profile might see QUBT as a potential option. Both companies currently display unfavorable profitability and financial ratios, suggesting cautious and thorough analysis is warranted.
Disclaimer: Investment carries a risk of loss of initial capital. The past performance is not a reliable indicator of future results. Be sure to understand risks before making an investment decision.
Go Further
I encourage you to read the complete analyses of Quantum Computing, Inc. and Arqit Quantum Inc. to enhance your investment decisions: