In the rapidly evolving semiconductor industry, two key players stand out: Qnity Electronics, Inc. (Q) and Tower Semiconductor Ltd. (TSEM). Both companies specialize in semiconductor manufacturing but differ in scale and innovation approaches, with Qnity focusing on advanced electronic materials and Tower on diverse customizable process technologies. This comparison aims to help investors identify which company offers the most compelling opportunity in this competitive sector. Let’s explore which stock deserves a spot in your portfolio.
Table of contents
Companies Overview
I will begin the comparison between Qnity Electronics, Inc. and Tower Semiconductor Ltd. by providing an overview of these two companies and their main differences.
Qnity Electronics, Inc. Overview
Qnity Electronics, Inc. specializes in electronic solutions and materials for semiconductor chip manufacturing and advanced electronic materials. The company, based in Wilmington, Delaware, was formerly known as Novus SpinCo 1, Inc. and rebranded in April 2025. It is a relatively new public entity listed on the NYSE, positioning itself within the semiconductor industry.
Tower Semiconductor Ltd. Overview
Tower Semiconductor Ltd. operates as an independent semiconductor foundry offering analog intensive mixed-signal devices and customizable process technologies. Headquartered in Migdal Haemek, Israel, it serves diverse markets including automotive, aerospace, and medical devices. Public since 1994, Tower trades on the NASDAQ Global Select and employs over 5,600 people worldwide.
Key similarities and differences
Both companies operate in the semiconductor industry, focusing on chip manufacturing and related technologies. Qnity emphasizes electronic solutions and materials, while Tower provides foundry services and design enablement platforms with a broader market reach. Tower is a more established firm with a larger workforce and longer public history, contrasting with Qnity’s recent IPO and smaller scale.
Income Statement Comparison
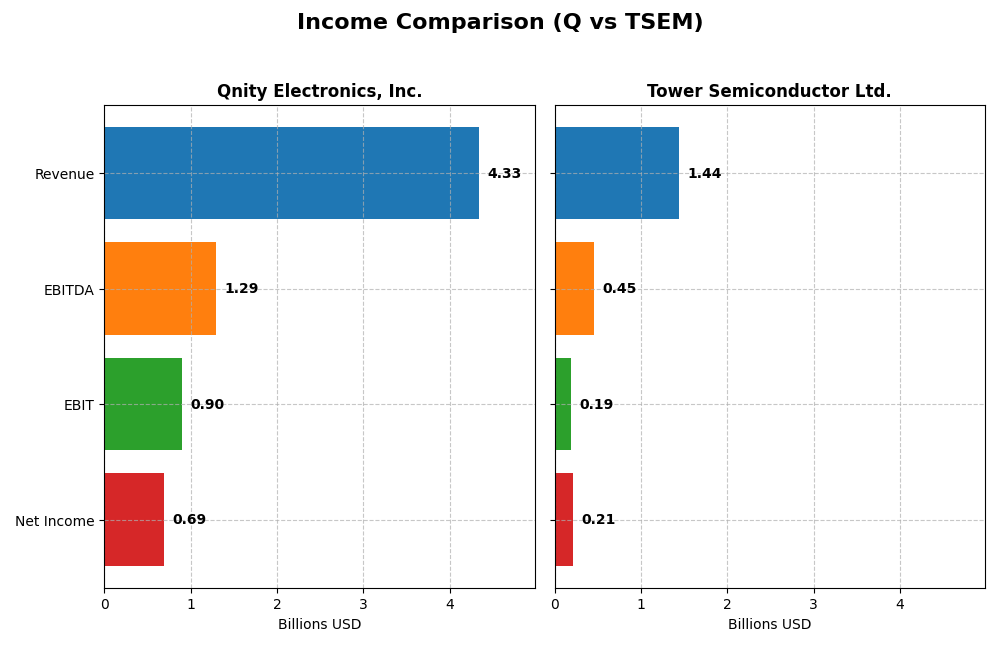
This table compares the key income statement metrics of Qnity Electronics, Inc. and Tower Semiconductor Ltd. for the fiscal year 2024.
| Metric | Qnity Electronics, Inc. | Tower Semiconductor Ltd. |
|---|---|---|
| Market Cap | 19.5B | 13.9B |
| Revenue | 4.34B | 1.44B |
| EBITDA | 1.29B | 451M |
| EBIT | 898M | 185M |
| Net Income | 693M | 208M |
| EPS | 3.31 | 1.87 |
| Fiscal Year | 2024 | 2024 |
Income Statement Interpretations
Qnity Electronics, Inc.
Qnity Electronics experienced a revenue decline from 4.76B in 2022 to 4.34B in 2024, with net income also decreasing from 774M to 693M. Margins showed some contraction overall, though the most recent year saw gross margin stabilize at 46.11% and net margin improve to 15.99%. In 2024, operating efficiency improved alongside a 7.43% revenue growth, signaling a moderate recovery.
Tower Semiconductor Ltd.
Tower Semiconductor’s revenue grew from 1.27B in 2020 to 1.44B in 2024, with net income increasing substantially from 82M to 208M over the same period. Margins improved notably, with gross margin at 23.64% and net margin at 14.47% in 2024. However, the latest year showed a slowdown in revenue growth (0.94%) and a sharp decline in EBIT and net margin growth, indicating some recent operational challenges.
Which one has the stronger fundamentals?
Qnity Electronics shows robust margins and recent margin improvements despite an overall revenue decline, maintaining solid profitability. Tower Semiconductor exhibits consistent revenue and net income growth over several years, though recent margin contractions and slower growth raise concerns. Both companies have favorable income statement evaluations, but with contrasting recent performance trends and margin stability.
Financial Ratios Comparison
The table below compares key financial ratios for Qnity Electronics, Inc. and Tower Semiconductor Ltd. based on their most recent fiscal year data from 2024.
| Ratios | Qnity Electronics, Inc. (Q) | Tower Semiconductor Ltd. (TSEM) |
|---|---|---|
| ROE | 6.51% | 7.83% |
| ROIC | 5.92% | 6.41% |
| P/E | 28.8 | 27.54 |
| P/B | 1.88 | 2.16 |
| Current Ratio | 1.77 | 6.18 |
| Quick Ratio | 1.06 | 5.23 |
| D/E | 0.018 | 0.068 |
| Debt-to-Assets | 1.56% | 5.87% |
| Interest Coverage | 3.03 | 32.64 |
| Asset Turnover | 0.35 | 0.47 |
| Fixed Asset Turnover | 2.59 | 1.11 |
| Payout ratio | 0 | 0 |
| Dividend yield | 0 | 0 |
Interpretation of the Ratios
Qnity Electronics, Inc.
Qnity Electronics shows a mixed ratio profile with strengths in net margin (15.99%) and low debt levels, but weaker returns on equity (6.51%) and asset turnover. The company maintains a solid current ratio of 1.77, indicating good short-term liquidity. It pays a small dividend of $0.06 per share, but the dividend yield is effectively zero, suggesting limited shareholder returns from dividends currently.
Tower Semiconductor Ltd.
Tower Semiconductor presents favorable net margin (14.47%) and excellent interest coverage (31.57), with moderate returns on equity (7.83%) and neutral price-to-book ratio. The current ratio is high at 6.18 but rated unfavorable, possibly indicating excess liquidity. It does not pay dividends, likely prioritizing reinvestment and R&D as indicated by its 1.44% R&D to revenue ratio and no dividend yield.
Which one has the best ratios?
Both companies have a slightly favorable overall ratio evaluation with 42.86% favorable ratios each. Qnity Electronics benefits from strong liquidity and low leverage, while Tower Semiconductor excels in interest coverage and operational returns but carries more unfavorable ratios. The choice depends on specific investor priorities toward liquidity, returns, or reinvestment strategies.
Strategic Positioning
This section compares the strategic positioning of Qnity Electronics, Inc. and Tower Semiconductor Ltd., including Market position, Key segments, and Exposure to technological disruption:
Qnity Electronics, Inc.
- Emerging player with $19.5B market cap; faces general semiconductor industry pressure
- Focuses on electronic solutions and materials for semiconductor chip manufacturing
- No explicit mention of technological disruption exposure
Tower Semiconductor Ltd.
- Established foundry with $13.9B market cap; competitive analog mixed-signal segment
- Serves diverse markets including automotive, aerospace, and medical devices
- Provides advanced customizable process technologies, enabling adaptation
Qnity Electronics, Inc. vs Tower Semiconductor Ltd. Positioning
Qnity is a newer, focused player in electronic materials, while Tower operates a diversified foundry business across multiple industries. Tower’s broader customer base contrasts with Qnity’s specialized semiconductor manufacturing focus, reflecting differing strategic scopes.
Which has the best competitive advantage?
Both companies are currently shedding value, but Qnity maintains stable profitability, whereas Tower shows improving returns. Neither demonstrates a strong economic moat, though Tower’s growing ROIC trend suggests potential future advantage.
Stock Comparison
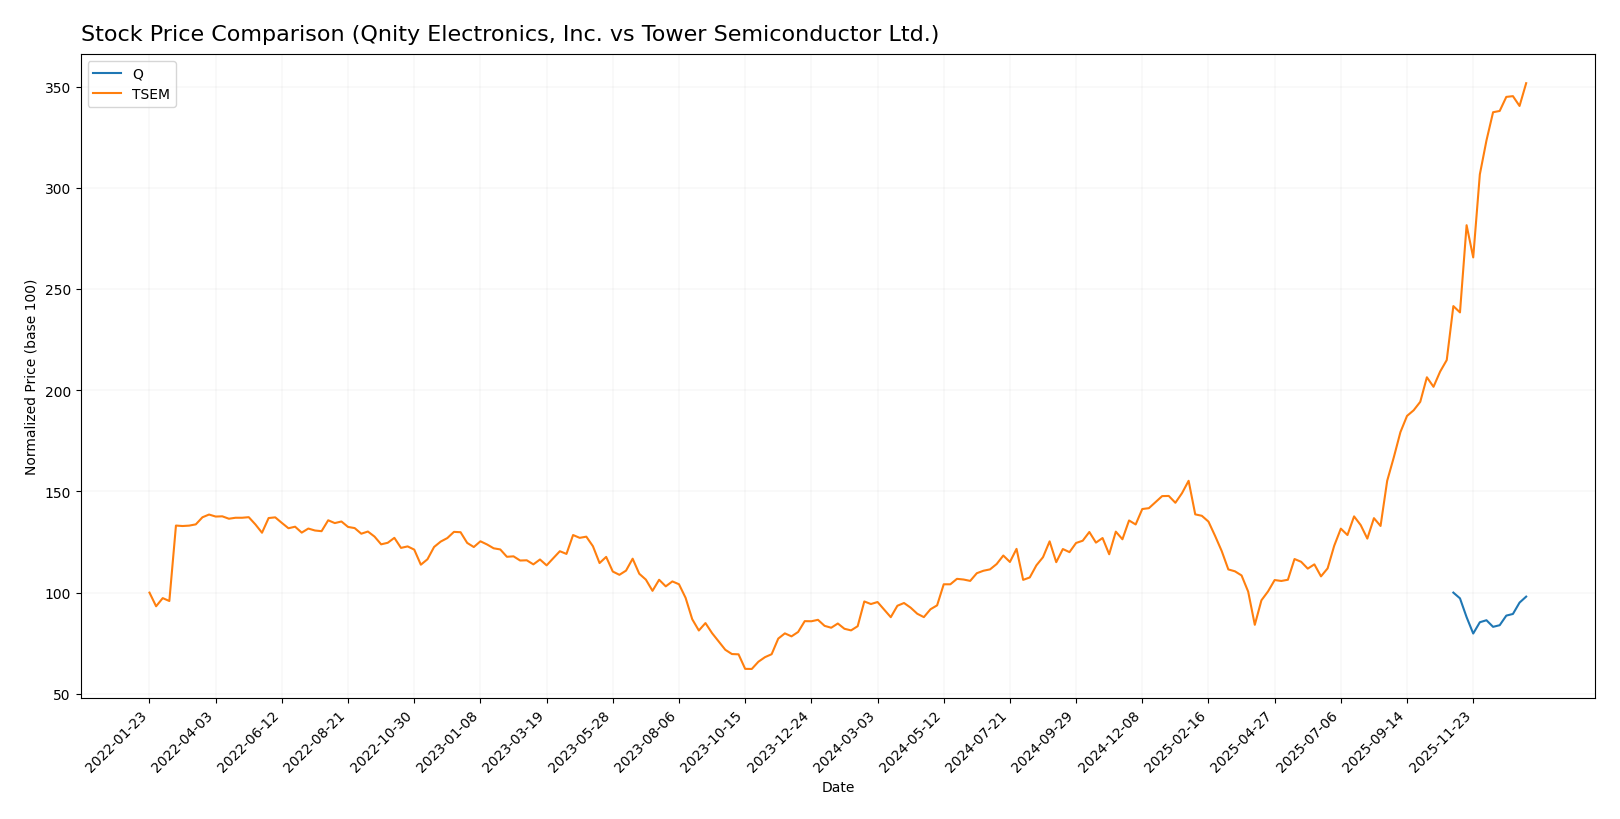
The stock price movements over the past 12 months reveal contrasting trajectories, with Qnity Electronics, Inc. showing a slight decline and Tower Semiconductor Ltd. experiencing a marked upward acceleration in price.
Trend Analysis
Qnity Electronics, Inc. recorded a -1.98% price change over the past year, indicating a neutral trend with stable acceleration and moderate volatility. The stock traded between 75.8 and 95.0 during this period.
Tower Semiconductor Ltd. posted a strong bullish trend with a 272.71% price increase over the last 12 months, showing clear acceleration and elevated volatility. Prices ranged from 29.65 to 124.0.
Comparing both, Tower Semiconductor Ltd. delivered the highest market performance with a significant price surge, while Qnity Electronics, Inc. remained largely flat with a slight downward drift.
Target Prices
Analysts present a clear consensus on target prices for Qnity Electronics, Inc. and Tower Semiconductor Ltd.
| Company | Target High | Target Low | Consensus |
|---|---|---|---|
| Qnity Electronics, Inc. | 117 | 92 | 105.89 |
| Tower Semiconductor Ltd. | 125 | 66 | 96 |
For Qnity Electronics, the consensus target price of 105.89 suggests moderate upside from the current 93.12 USD. Tower Semiconductor’s consensus target of 96 is slightly below its current price of 124 USD, indicating mixed analyst expectations.
Analyst Opinions Comparison
This section compares analysts’ ratings and grades for Qnity Electronics, Inc. (Q) and Tower Semiconductor Ltd. (TSEM):
Rating Comparison
Q Rating
- Rating: B+, classified as Very Favorable by analysts.
- Discounted Cash Flow Score: 4, indicating a Favorable valuation based on future cash flows.
- ROE Score: 3, reflecting Moderate efficiency in generating profit from equity.
- ROA Score: 4, favorable use of assets to generate earnings.
- Debt To Equity Score: 3, Moderate financial risk level.
- Overall Score: 3, a Moderate overall financial standing.
TSEM Rating
- Rating: B+, classified as Very Favorable by analysts.
- Discounted Cash Flow Score: 3, showing a Moderate valuation.
- ROE Score: 3, also Moderate in profitability from equity.
- ROA Score: 4, similarly favorable asset utilization.
- Debt To Equity Score: 4, indicating Favorable lower financial risk.
- Overall Score: 3, equally Moderate overall rating.
Which one is the best rated?
Both Q and TSEM share the same overall rating of B+ and an identical overall score of 3. Q holds a more favorable discounted cash flow score, while TSEM has a better debt-to-equity score, balancing their relative strengths.
Scores Comparison
Here is a comparison of the Altman Z-Score and Piotroski Score for Qnity Electronics, Inc. and Tower Semiconductor Ltd.:
Q Scores
- No Altman Z-Score data available.
- No Piotroski Score data available.
TSEM Scores
- Altman Z-Score of 21.06, indicating a safe financial zone.
- Piotroski Score of 7, indicating strong financial health.
Which company has the best scores?
Based strictly on the provided data, Tower Semiconductor Ltd. has clear scores indicating strong financial health and safety from bankruptcy. Qnity Electronics, Inc. lacks score data for comparison.
Grades Comparison
The following section outlines the recent grades for Qnity Electronics, Inc. and Tower Semiconductor Ltd.:
Qnity Electronics, Inc. Grades
This table summarizes the latest grades assigned by well-known grading companies for Qnity Electronics, Inc.
| Grading Company | Action | New Grade | Date |
|---|---|---|---|
| RBC Capital | maintain | Outperform | 2025-11-25 |
| Mizuho | maintain | Outperform | 2025-11-20 |
Overall, Qnity Electronics has consistently maintained an “Outperform” rating, indicating a stable positive outlook from these analysts.
Tower Semiconductor Ltd. Grades
Here are the most recent grades given by reputable grading firms for Tower Semiconductor Ltd.
| Grading Company | Action | New Grade | Date |
|---|---|---|---|
| Benchmark | maintain | Buy | 2026-01-09 |
| Wedbush | downgrade | Neutral | 2025-12-31 |
| Benchmark | maintain | Buy | 2025-11-11 |
| Susquehanna | maintain | Positive | 2025-11-11 |
| Wedbush | maintain | Outperform | 2025-11-11 |
| Barclays | maintain | Equal Weight | 2025-11-11 |
| Benchmark | maintain | Buy | 2025-09-08 |
| Susquehanna | maintain | Positive | 2025-08-05 |
| Benchmark | maintain | Buy | 2025-08-05 |
| Benchmark | maintain | Buy | 2025-08-04 |
Tower Semiconductor’s ratings show a mix of “Buy,” “Positive,” and “Neutral” grades, with a recent downgrade to “Neutral” by Wedbush, suggesting some cautiousness among analysts.
Which company has the best grades?
Qnity Electronics holds consistently strong “Outperform” ratings, while Tower Semiconductor’s grades vary between “Buy,” “Positive,” and “Neutral.” Investors may interpret Qnity’s steadier outlook as a clearer signal of confidence compared to Tower Semiconductor’s mixed assessments.
Strengths and Weaknesses
Below is a comparison of key strengths and weaknesses for Qnity Electronics, Inc. (Q) and Tower Semiconductor Ltd. (TSEM) based on recent financial and operational data.
| Criterion | Qnity Electronics, Inc. (Q) | Tower Semiconductor Ltd. (TSEM) |
|---|---|---|
| Diversification | Limited product segmentation; focus not specified | Limited product segmentation; focus not specified |
| Profitability | Net margin 16%, stable ROIC near WACC, slightly shedding value | Net margin 14.5%, ROIC growing but below WACC, value destruction ongoing |
| Innovation | Neutral ROIC trend suggests modest innovation impact | Growing ROIC trend indicates improving innovation and efficiency |
| Global presence | Established but no clear competitive advantage | Global operations with improving profitability |
| Market Share | Stable but no distinct competitive moat | Slightly unfavorable moat, but improving |
Key takeaways: Qnity Electronics maintains stable profitability with a neutral competitive position but shows signs of value erosion. Tower Semiconductor is currently shedding value overall but benefits from a strong upward trend in profitability, signaling potential for future growth. Both companies exhibit slight favorability in financial ratios, though neither presents a strong economic moat at this time.
Risk Analysis
Below is a comparison of key risks for Qnity Electronics, Inc. (Q) and Tower Semiconductor Ltd. (TSEM) as of 2026:
| Metric | Qnity Electronics, Inc. (Q) | Tower Semiconductor Ltd. (TSEM) |
|---|---|---|
| Market Risk | Moderate due to new IPO (2025) and semiconductor cyclicality | Moderate, beta 0.876 indicates some market sensitivity |
| Debt level | Very low debt (D/E 0.02), minimal financial leverage | Low debt (D/E 0.07), manageable financial risk |
| Regulatory Risk | US-based, subject to US tech regulations, moderate risk | Global exposure including Israel, higher regulatory complexity |
| Operational Risk | Early stage post-IPO, potential scaling challenges | Established with 5.6K employees, operational risks spread globally |
| Environmental Risk | Moderate, semiconductor materials usage | Moderate, wafer fabrication energy consumption notable |
| Geopolitical Risk | Low, US-centric operations | Elevated due to geopolitical tensions in Middle East region |
The most impactful risk for Q is operational scaling as it transitions from IPO status, while Tower Semiconductor faces heightened geopolitical risk given its Israeli base and global supply chain. Both companies maintain low debt levels, which mitigates financial distress risk. Investors should monitor market cycles affecting semiconductors and regulatory developments closely.
Which Stock to Choose?
Qnity Electronics, Inc. (Q) shows a favorable income statement with strong gross and EBIT margins, and improved net margin growth over one year, despite an overall revenue decline. Its financial ratios are slightly favorable, with very low debt and a stable but moderate profitability profile. The company’s rating is very favorable (B+), supported by moderate overall scores and a neutral economic moat, indicating stable profitability without a clear competitive advantage.
Tower Semiconductor Ltd. (TSEM) also presents a favorable income statement overall, with solid net margin and significant long-term growth in net income and EPS, though recent yearly income metrics have weakened. Its financial ratios are slightly favorable but carry more unfavorable aspects, especially in liquidity ratios. TSEM’s rating matches Q’s (B+) with moderate scores and a slightly unfavorable economic moat due to value destruction, though profitability is on an improving trend.
Investors focused on stable profitability with controlled debt might find Q’s consistent margins and low leverage appealing, while those with a tolerance for more risk and seeking growth may interpret TSEM’s accelerating profitability and strong long-term income growth as more favorable. The choice could depend on whether an investor prioritizes stability or potential growth dynamics.
Disclaimer: Investment carries a risk of loss of initial capital. The past performance is not a reliable indicator of future results. Be sure to understand risks before making an investment decision.
Go Further
I encourage you to read the complete analyses of Qnity Electronics, Inc. and Tower Semiconductor Ltd. to enhance your investment decisions: