Home > Comparison > Technology > TXN vs Q
The strategic rivalry between Texas Instruments Incorporated and Qnity Electronics, Inc. shapes the semiconductor sector’s evolution. Texas Instruments, a diversified semiconductor giant with broad analog and embedded processing capabilities, contrasts sharply with Qnity’s focused role in advanced electronic materials for chip manufacturing. This face-off highlights a competition between established market leadership and emerging specialization. This analysis aims to identify which company’s trajectory delivers the superior risk-adjusted return for a diversified portfolio in today’s dynamic technology landscape.
Table of contents
Companies Overview
Texas Instruments and Qnity Electronics shape critical segments within the semiconductor industry in 2026.
Texas Instruments Incorporated: Semiconductor Powerhouse
Texas Instruments dominates the semiconductor sector with a focus on analog and embedded processing chips. It generates revenue by selling power management products and microcontrollers to industrial, automotive, and consumer electronics markets. In 2026, TI sharpened its strategic focus on enhancing energy-efficient semiconductor solutions to meet growing demand for sustainable technology.
Qnity Electronics, Inc.: Advanced Materials Innovator
Qnity Electronics specializes in providing electronic solutions and materials essential for semiconductor chip manufacturing. Its core revenue stems from supplying advanced electronic materials to chip producers. Since its rebranding in 2025, Qnity has concentrated on expanding its footprint in the emerging high-tech materials market to support next-generation semiconductor fabrication.
Strategic Collision: Similarities & Divergences
Both companies operate within semiconductor ecosystems but pursue distinct philosophies: Texas Instruments emphasizes integrated chip design and power solutions, while Qnity targets upstream materials innovation. Their primary battleground lies in addressing the semiconductor supply chain’s evolving technological needs. These differences create contrasting investment profiles—TI offers mature, diversified semiconductor exposure, whereas Qnity represents a niche play on advanced materials innovation.
Income Statement Comparison
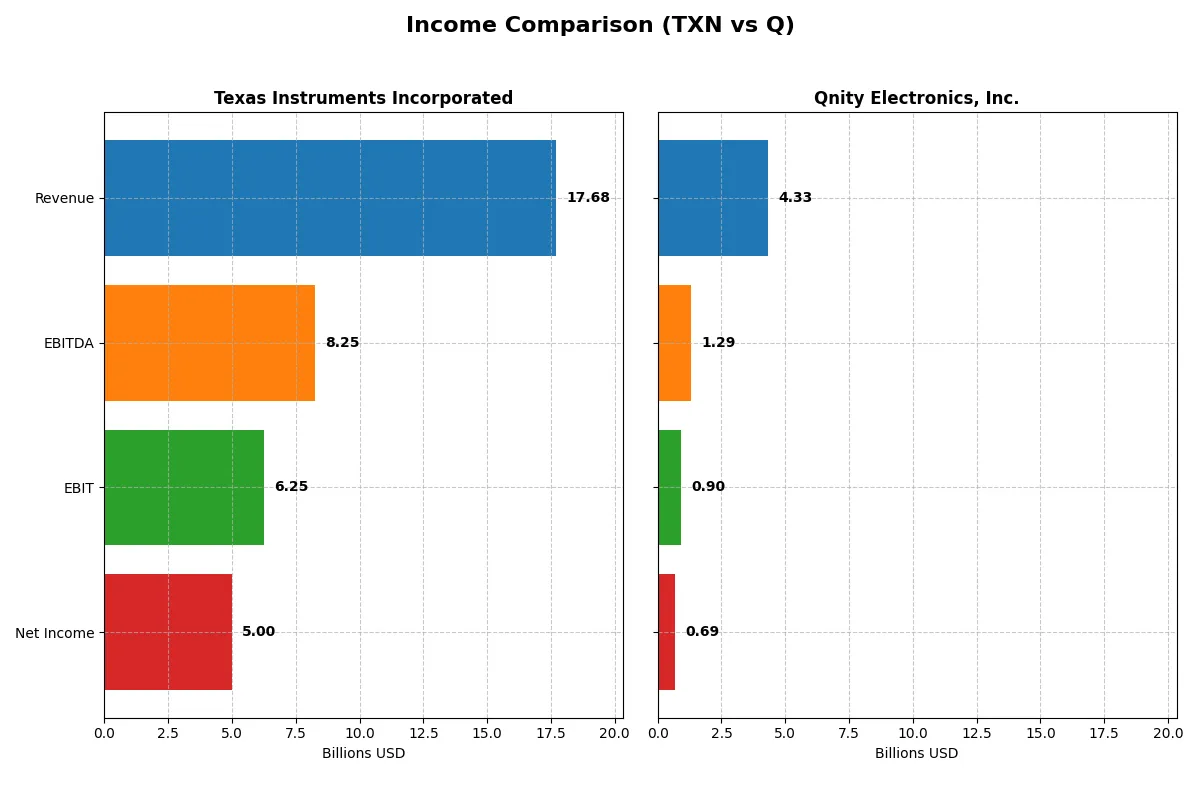
This data dissects the core profitability and scalability of both corporate engines to reveal who dominates the bottom line:
| Metric | Texas Instruments Incorporated (TXN) | Qnity Electronics, Inc. (Q) |
|---|---|---|
| Revenue | 17.7B | 4.3B |
| Cost of Revenue | 7.6B | 2.3B |
| Operating Expenses | 4.1B | 1.2B |
| Gross Profit | 10.1B | 2.0B |
| EBITDA | 8.3B | 1.3B |
| EBIT | 6.3B | 898M |
| Interest Expense | 543M | 280M |
| Net Income | 5.0B | 693M |
| EPS | 5.45 | 3.31 |
| Fiscal Year | 2025 | 2024 |
Income Statement Analysis: The Bottom-Line Duel
This income statement comparison reveals which company operates with greater efficiency and profitability in their core business engines.
Texas Instruments Incorporated Analysis
Texas Instruments shows a mixed revenue trajectory, peaking at $20B in 2022 before declining to $17.7B in 2025. Net income fell significantly from $8.7B in 2022 to $5B in 2025, reflecting pressure on margins. Despite this, its gross margin remains robust at 57%, and the 2025 net margin of 28% signals healthy profitability. The slight EBIT growth and EPS improvement in 2025 suggest operational resilience amid top-line challenges.
Qnity Electronics, Inc. Analysis
Qnity Electronics’ revenue dipped from $4.76B in 2022 to $4.34B in 2024, showing modest contraction. Net income dropped from $774M to $693M in the same period, but margin trends are encouraging with a 46% gross margin and a 16% net margin in 2024. Notably, Qnity posted strong EBIT and EPS growth of over 36% year-over-year, indicating improving operational efficiency and momentum despite revenue softness.
Margin Dominance vs. Growth Momentum
Texas Instruments commands superior margins, nearly doubling Qnity’s net margin, driven by scale and cost control. However, Qnity outpaces Texas Instruments in recent EBIT and EPS growth, reflecting faster operational improvement. For investors, Texas Instruments offers strong margin power and stability, while Qnity presents a compelling growth momentum profile with improving profitability.
Financial Ratios Comparison
These vital ratios act as a diagnostic tool to expose the underlying fiscal health, valuation premiums, and capital efficiency of the companies:
| Ratios | Texas Instruments (TXN) | Qnity Electronics (Q) |
|---|---|---|
| ROE | 30.7% | 6.5% |
| ROIC | 16.5% | 5.9% |
| P/E | 31.5 | 28.8 |
| P/B | 9.7 | 1.9 |
| Current Ratio | 4.35 | 1.77 |
| Quick Ratio | 2.83 | 1.06 |
| D/E | 0.86 | 0.02 |
| Debt-to-Assets | 40.6% | 1.6% |
| Interest Coverage | 11.1 | 3.0 |
| Asset Turnover | 0.51 | 0.35 |
| Fixed Asset Turnover | 1.44 | 2.59 |
| Payout Ratio | 100.0% | 0.0% |
| Dividend Yield | 3.17% | 0.0% |
| Fiscal Year | 2025 | 2024 |
Efficiency & Valuation Duel: The Vital Signs
Financial ratios serve as a company’s DNA, uncovering hidden risks and operational excellence essential for sound investment decisions.
Texas Instruments Incorporated
Texas Instruments demonstrates robust profitability with a 30.7% ROE and a strong 28.3% net margin, reflecting operational efficiency. However, its valuation appears stretched, with a P/E of 31.5 and a P/B near 9.7, indicating an expensive stock. The company sustains shareholder returns through a favorable 3.17% dividend yield, balancing profitability and income distribution.
Qnity Electronics, Inc.
Qnity Electronics shows moderate profitability with a 6.5% ROE and a 16.0% net margin, signaling less efficiency than its peer. Its valuation is somewhat high at a 28.8 P/E, but the P/B of 1.88 remains reasonable. The absence of dividends points to reinvestment in growth, focusing on R&D at 7.2% of revenue, aiming to build future value.
Premium Valuation vs. Growth Efficiency
Texas Instruments commands a premium valuation supported by superior profitability and dividend payouts, while Qnity offers a more modest valuation with a reinvestment growth profile. Investors seeking stable income and strong returns may prefer Texas Instruments, whereas those favoring growth and lower valuation multiples might consider Qnity.
Which one offers the Superior Shareholder Reward?
I compare Texas Instruments (TXN) and Qnity Electronics (Q) on dividend yield, payout ratios, and buybacks. TXN yields 3.17% with nearly 100% payout, supported by strong free cash flow coverage (~75%). It combines dividends with moderate buybacks, sustaining long-term value. Q pays no dividend but reinvests heavily, boasting 81% free cash flow buyback efficiency and low debt, signaling growth focus. TXN’s distribution is more balanced and sustainable in 2026, offering a superior total return profile for income-focused investors. Q suits growth seekers but carries higher execution risk.
Comparative Score Analysis: The Strategic Profile
The radar chart reveals the fundamental DNA and trade-offs of Texas Instruments and Qnity Electronics, highlighting their core financial strengths and vulnerabilities:
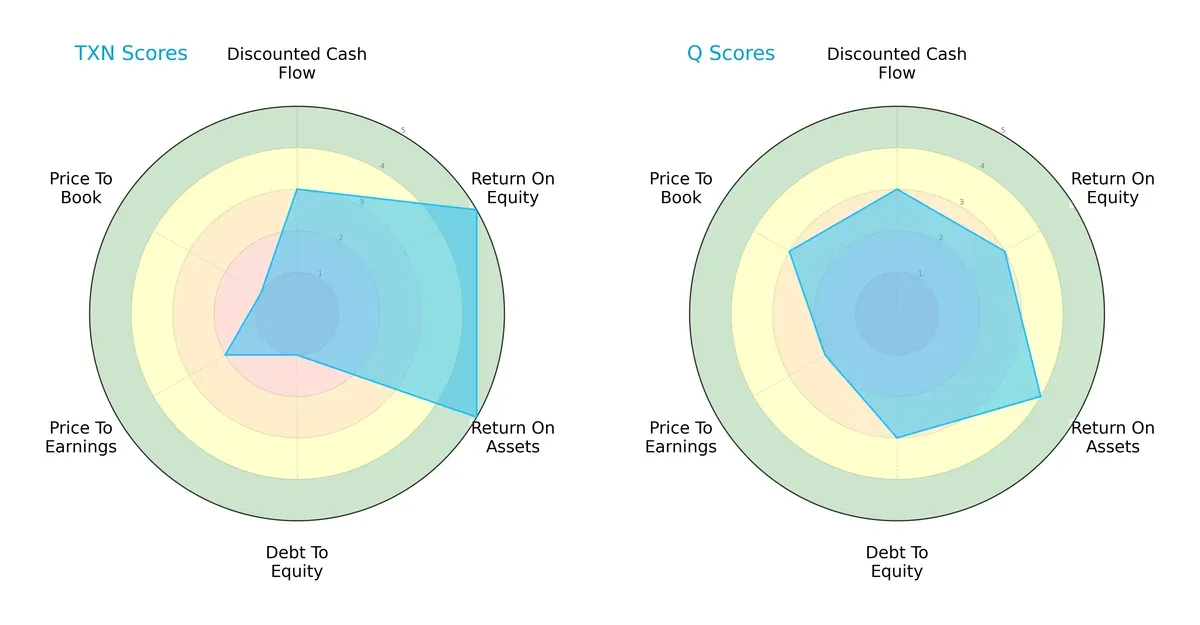
Texas Instruments excels in profitability with top ROE and ROA scores of 5 each, but its balance sheet is stretched, reflected by a very unfavorable debt-to-equity score of 1. Qnity Electronics presents a more balanced profile, with moderate profitability scores (ROE 3, ROA 4) and a healthier debt-to-equity score of 3. Valuation metrics favor Qnity, showing moderate scores across P/E and P/B ratios compared to Texas Instruments’ weaker valuation standing. Overall, Texas Instruments relies on operational efficiency, while Qnity offers steadier financial stability.
Bankruptcy Risk: Solvency Showdown
Texas Instruments’ Altman Z-Score of 10.3 positions it firmly in the safe zone, signaling robust long-term survival potential in volatile markets:

Financial Health: Quality of Operations
Texas Instruments scores a strong 7 on the Piotroski F-Score, indicating solid financial health with no immediate red flags:

How are the two companies positioned?
This section dissects the operational DNA of Texas Instruments and Qnity Electronics by comparing their revenue distribution and internal dynamics. The goal is to confront their economic moats and reveal which model offers the most resilient competitive advantage today.
Revenue Segmentation: The Strategic Mix
This visual comparison dissects how Texas Instruments and Qnity Electronics diversify income streams and reveals their primary sector bets:
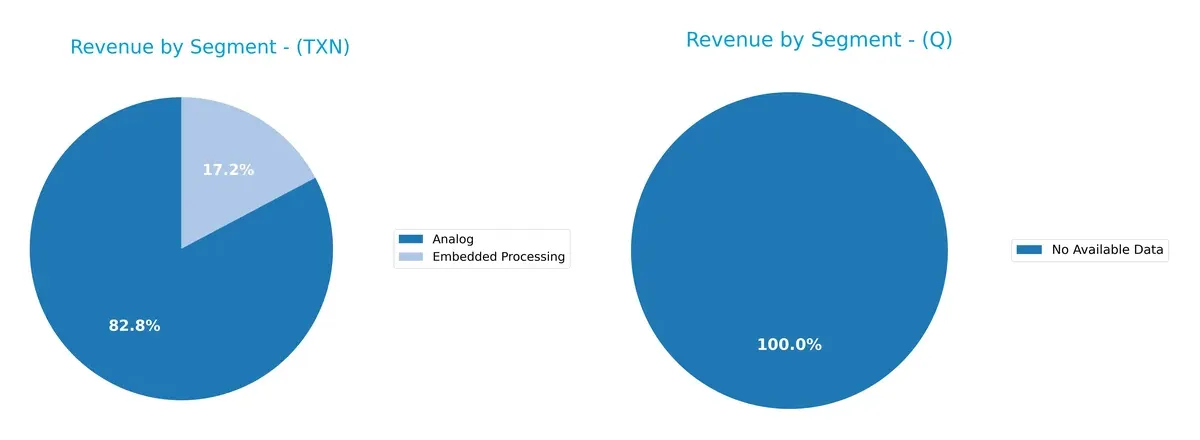
Texas Instruments anchors revenue heavily in Analog, generating $12.2B in 2024, dwarfing its Embedded Processing at $2.5B. This concentration signals a stronghold in analog semiconductor infrastructure. Qnity Electronics lacks available data, preventing segmentation analysis. TI’s focused dominance offers ecosystem lock-in but carries concentration risk if Analog markets contract. Its smaller Embedded Processing segment hints at selective diversification within semiconductors, balancing innovation and stability.
Strengths and Weaknesses Comparison
This table compares the strengths and weaknesses of Texas Instruments and Qnity Electronics based on diversification, profitability, financials, innovation, global presence, and market share:
Texas Instruments Strengths
- High net margin (28.28%) and ROE (30.73%) signal strong profitability
- Favorable quick ratio (2.83) and interest coverage (11.52) support financial stability
- Diverse revenue streams with Analog, Embedded Processing, and other segments
- Broad global presence including US, China, EMEA, Japan, and Asia
- Dividend yield of 3.17% appeals to income investors
Qnity Electronics Strengths
- Positive net margin (15.99%) and favorable WACC (5.83%) suggest efficient capital use
- Strong current (1.77) and quick ratios (1.06) indicate liquidity
- Extremely low debt-to-assets (1.56%) and debt-to-equity (0.02) reduce financial risk
- Higher fixed asset turnover (2.59) points to efficient asset use
Texas Instruments Weaknesses
- Unfavorable P/E (31.53) and P/B (9.69) ratios imply possible overvaluation
- Very high current ratio (4.35) may indicate inefficient asset use
- Neutral debt levels (40.62% debt-to-assets) could limit flexibility
- Moderate asset turnover (0.51) suggests room for operational improvement
- Concentration in Analog segment risks exposure to market shifts
Qnity Electronics Weaknesses
- Low ROE (6.51%) raises concerns on shareholder returns
- Unfavorable P/E (28.8) and zero dividend yield limit investor appeal
- Unfavorable asset turnover (0.35) points to low operational efficiency
- Neutral interest coverage (3.21) may constrain debt servicing ability
- Lack of product and geographic diversification reduces resilience
Overall, Texas Instruments shows robust profitability, diversified revenue, and strong global reach but faces valuation and efficiency concerns. Qnity Electronics benefits from strong liquidity and low debt but struggles with profitability and diversification, highlighting strategic areas for improvement.
The Moat Duel: Analyzing Competitive Defensibility
A structural moat shields long-term profits from relentless competition and market saturation pressures. Here’s how Texas Instruments and Qnity Electronics compare:
Texas Instruments Incorporated: Cost Advantage with Broad Analog Dominance
Texas Instruments leverages a cost advantage moat rooted in efficient analog semiconductor manufacturing. This delivers a strong 35% EBIT margin and stable high ROIC, though its ROIC shows a declining trend in 2026. New industrial and automotive applications could reinforce its moat, but intensifying global supply chain challenges pose risks.
Qnity Electronics, Inc.: Emerging Intangible Assets in Chip Materials
Qnity Electronics relies on intangible assets from proprietary electronic materials for chip manufacturing, contrasting Texas Instruments’ cost moat. Its EBIT margin is lower at 21%, and ROIC roughly matches WACC, indicating no clear moat yet. However, rapid EBIT and net margin growth in 2025 signal potential moat development through innovation and market expansion.
Moat Strength Showdown: Cost Efficiency vs. Innovation Potential
Texas Instruments possesses a wider moat with proven value creation and scale advantages, despite a declining ROIC trend. Qnity Electronics shows promise but lacks a durable moat currently. Texas Instruments remains better equipped to defend its market share in 2026’s competitive semiconductor landscape.
Which stock offers better returns?
The past 12 months reveal distinct price dynamics: Texas Instruments surged over 29%, showing accelerating strength, while Qnity Electronics barely moved with a slight 0.5% gain.
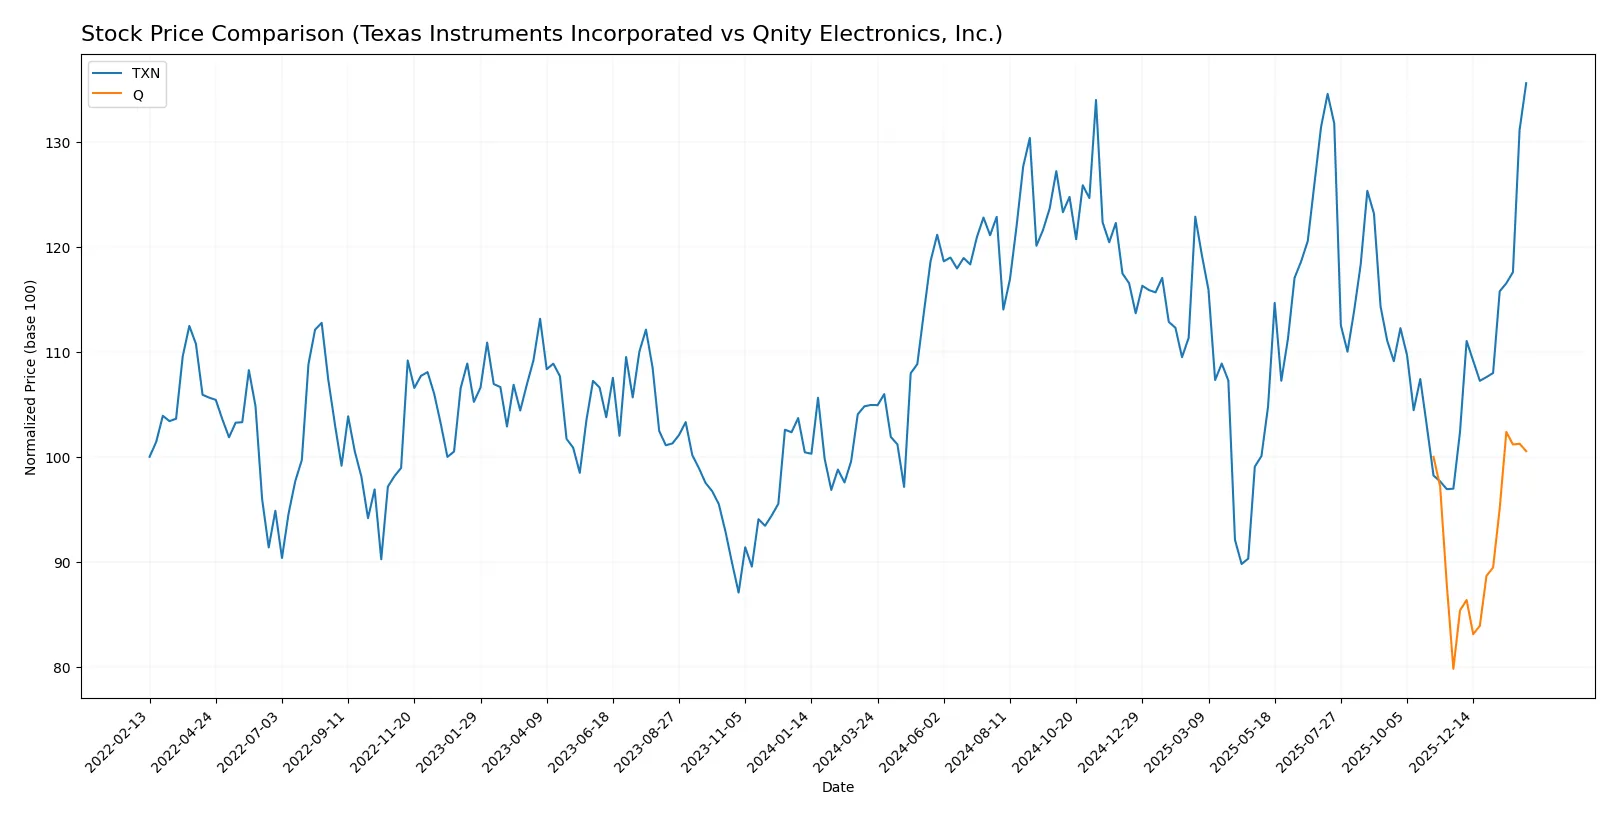
Trend Comparison
Texas Instruments’ stock rose 29.21% over the past year, marking a bullish trend with accelerating momentum and a high volatility level of 16.23%. It hit a peak of 222.92 and a low of 147.6.
Qnity Electronics showed a marginal 0.54% increase, indicating a neutral to mild bullish trend with lower volatility at 7.17%. The price ranged between 75.8 and 97.25, also accelerating recently.
Texas Instruments outperformed Qnity Electronics, delivering the highest market return and demonstrating stronger price appreciation and volume dynamics.
Target Prices
Analysts present a mixed but generally positive target consensus for Texas Instruments and Qnity Electronics.
| Company | Target Low | Target High | Consensus |
|---|---|---|---|
| Texas Instruments Incorporated | 160 | 260 | 204.64 |
| Qnity Electronics, Inc. | 92 | 118 | 106.78 |
Texas Instruments’ consensus target of 204.64 sits below its current price of 222.92, suggesting limited upside or possible consolidation. Qnity’s consensus at 106.78 exceeds its 95.51 share price, indicating analyst optimism for growth potential.

Don’t Let Luck Decide Your Entry Point
Optimize your entry points with our advanced ProRealTime indicators. You’ll get efficient buy signals with precise price targets for maximum performance. Start outperforming now!
How do institutions grade them?
Here is a comparison of the latest institutional grades for Texas Instruments Incorporated and Qnity Electronics, Inc.:
Texas Instruments Incorporated Grades
The following table shows recent grades assigned by major investment banks:
| Grading Company | Action | New Grade | Date |
|---|---|---|---|
| Jefferies | Maintain | Hold | 2026-01-28 |
| Cantor Fitzgerald | Maintain | Neutral | 2026-01-28 |
| Goldman Sachs | Maintain | Sell | 2026-01-28 |
| Truist Securities | Maintain | Hold | 2026-01-28 |
| Deutsche Bank | Maintain | Hold | 2026-01-28 |
| Stifel | Maintain | Hold | 2026-01-28 |
| UBS | Maintain | Buy | 2026-01-28 |
| B of A Securities | Upgrade | Neutral | 2026-01-28 |
| Wells Fargo | Maintain | Equal Weight | 2026-01-28 |
| JP Morgan | Maintain | Overweight | 2026-01-28 |
Qnity Electronics, Inc. Grades
Below are the latest grades issued by recognized financial firms:
| Grading Company | Action | New Grade | Date |
|---|---|---|---|
| RBC Capital | Maintain | Outperform | 2025-11-25 |
| Mizuho | Maintain | Outperform | 2025-11-20 |
Which company has the best grades?
Qnity Electronics consistently receives “Outperform” ratings, indicating stronger institutional confidence compared to Texas Instruments. Texas Instruments shows a mix of Hold, Neutral, and a few Buy grades, reflecting cautious optimism. Investors might interpret Qnity’s higher grades as a signal of better growth expectations.
Risks specific to each company
The following categories identify the critical pressure points and systemic threats facing both firms in the 2026 market environment:
1. Market & Competition
Texas Instruments Incorporated
- Dominates with strong analog and embedded processing segments but faces saturation risk in mature markets.
Qnity Electronics, Inc.
- Newer player with growth potential but limited market share and brand recognition against established rivals.
2. Capital Structure & Debt
Texas Instruments Incorporated
- Moderate debt levels with a D/E of 0.86; interest coverage is healthy at 11.5x, indicating manageable financial risk.
Qnity Electronics, Inc.
- Very low debt, D/E of 0.02, minimizing financial risk but possibly limiting leverage for expansion.
3. Stock Volatility
Texas Instruments Incorporated
- Beta near 1 (0.995) suggests stock moves in line with market, moderate volatility.
Qnity Electronics, Inc.
- Beta unavailable (0), likely due to IPO recency or low trading history, indicating uncertain volatility profile.
4. Regulatory & Legal
Texas Instruments Incorporated
- Established compliance frameworks but exposed to semiconductor export controls and IP litigation risks.
Qnity Electronics, Inc.
- Emerging compliance systems; risks stem from evolving regulatory scrutiny in semiconductor materials and supply chain.
5. Supply Chain & Operations
Texas Instruments Incorporated
- Global operations with diverse suppliers; vulnerable to geopolitical tensions but benefits from scale and integration.
Qnity Electronics, Inc.
- Smaller scale supply chain more vulnerable to disruptions; limited operational history heightens risk exposure.
6. ESG & Climate Transition
Texas Instruments Incorporated
- Established ESG policies and sustainability reporting; faces pressure to reduce carbon footprint amid industry trends.
Qnity Electronics, Inc.
- ESG frameworks likely nascent; must accelerate adaptation to climate regulations to avoid reputational and regulatory risks.
7. Geopolitical Exposure
Texas Instruments Incorporated
- Significant exposure to US-China tech tensions; diversification mitigates some risk but remains material.
Qnity Electronics, Inc.
- Limited geographic footprint currently; geopolitical risks may rise with expansion plans into global markets.
Which company shows a better risk-adjusted profile?
Texas Instruments faces its greatest risk from geopolitical tensions impacting supply chains and market access. Qnity Electronics’ biggest risk lies in its operational and market infancy, raising uncertainty in execution and volatility. Despite higher leverage, TI’s scale, diversified operations, and strong liquidity offer a more balanced risk profile. Qnity’s low debt is a strength, but limited history and volatility pose higher risk. Recent data show TI’s strong interest coverage contrasts with Qnity’s unproven financial resilience, justifying caution for the latter.
Final Verdict: Which stock to choose?
Texas Instruments Incorporated’s superpower lies in its robust capital efficiency and consistent value creation, demonstrated by a ROIC well above its cost of capital. Its point of vigilance remains a high valuation multiple, which could pressure returns if growth slows. It suits portfolios aiming for steady, long-term growth with a tolerance for premium pricing.
Qnity Electronics, Inc. leverages a strategic moat through its exceptionally low debt and conservative capital structure, providing a safer financial profile than Texas Instruments. Although its profitability and returns lag behind, its disciplined balance sheet makes it attractive for investors favoring risk-managed growth or income stability.
If you prioritize capital efficiency and proven value creation, Texas Instruments outshines with stronger profitability metrics and market leadership. However, if you seek a lower-risk profile with steadier balance sheet management, Qnity Electronics offers better stability and financial prudence, albeit with moderated growth prospects.
Disclaimer: Investment carries a risk of loss of initial capital. The past performance is not a reliable indicator of future results. Be sure to understand risks before making an investment decision.
Go Further
I encourage you to read the complete analyses of Texas Instruments Incorporated and Qnity Electronics, Inc. to enhance your investment decisions: