Home > Comparison > Technology > TER vs Q
The strategic rivalry between Teradyne, Inc. and Qnity Electronics, Inc. shapes the semiconductor technology landscape. Teradyne operates as a capital-intensive test equipment manufacturer with diverse industrial automation segments. In contrast, Qnity focuses on advanced electronic solutions and materials for chip manufacturing. This analysis contrasts mature operational breadth against emerging specialization to determine which trajectory offers superior risk-adjusted returns for a balanced portfolio in this dynamic sector.
Table of contents
Companies Overview
Teradyne, Inc. and Qnity Electronics, Inc. are pivotal players shaping the semiconductor industry’s evolving landscape.
Teradyne, Inc.: Leader in Automated Test Solutions
Teradyne dominates as a global provider of automatic test equipment essential for semiconductor and wireless device manufacturing. Its revenue stems from diversified segments including Semiconductor Test, System Test, Industrial Automation, and Wireless Test. In 2026, Teradyne focuses on expanding its advanced robotics and 5G wireless testing capabilities, reinforcing its position in high-tech, volume-driven markets.
Qnity Electronics, Inc.: Emerging Advanced Materials Specialist
Qnity Electronics specializes in delivering electronic solutions and materials critical for semiconductor chip fabrication. Its core revenue originates from supplying advanced materials to chip manufacturers. Having rebranded in 2025, Qnity’s strategic emphasis in 2026 lies in scaling its manufacturing footprint and enhancing product innovation to meet growing demand for cutting-edge semiconductor components.
Strategic Collision: Similarities & Divergences
Teradyne and Qnity both operate within the semiconductor ecosystem but pursue contrasting approaches. Teradyne invests heavily in comprehensive testing and automation systems, while Qnity focuses narrowly on supplying materials for chip production. Their battleground centers on integrating supply chain efficiencies versus advancing end-product performance. This divergence defines distinct investment profiles: Teradyne offers broad industrial exposure, whereas Qnity presents a specialized growth play.
Income Statement Comparison
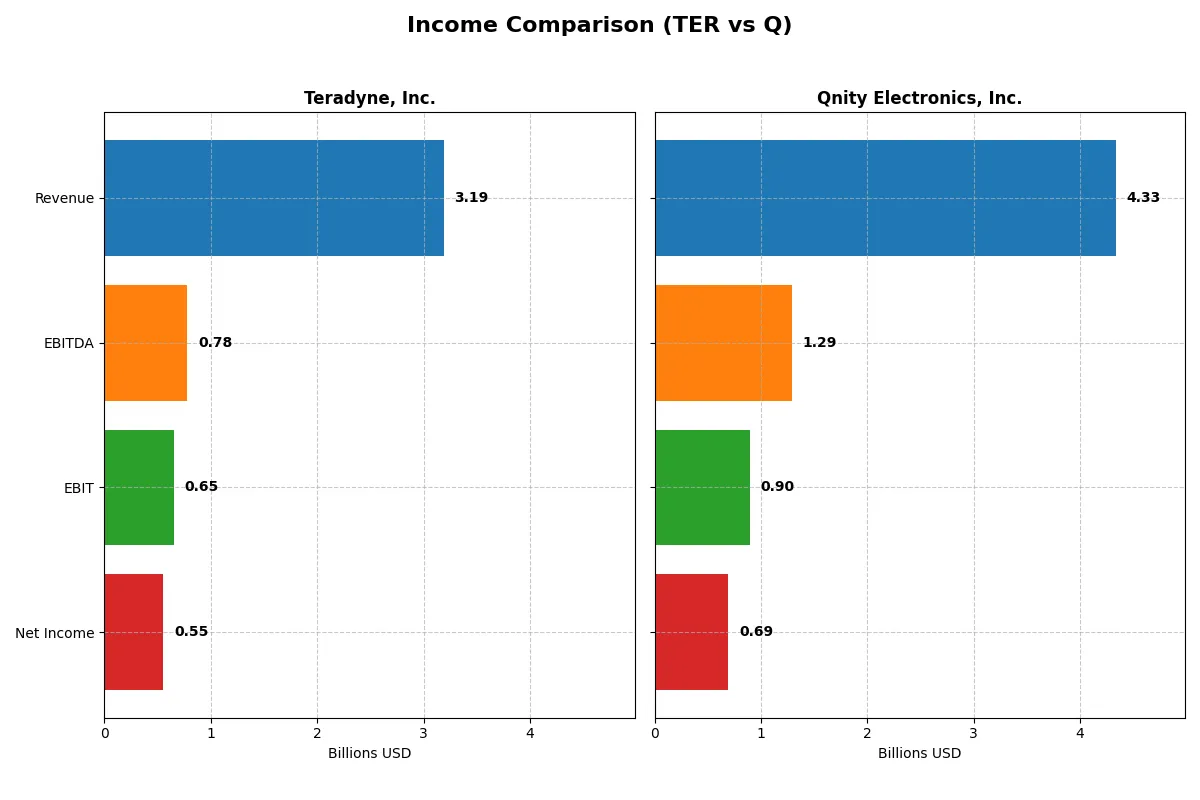
This data dissects the core profitability and scalability of both corporate engines to reveal who dominates the bottom line:
| Metric | Teradyne, Inc. (TER) | Qnity Electronics, Inc. (Q) |
|---|---|---|
| Revenue | 3.19B | 4.34B |
| Cost of Revenue | 1.32B | 2.34B |
| Operating Expenses | 1.17B | 1.16B |
| Gross Profit | 1.87B | 2.00B |
| EBITDA | 780M | 1.29B |
| EBIT | 653M | 898M |
| Interest Expense | 8.02M | 280M |
| Net Income | 554M | 693M |
| EPS | 3.49 | 3.31 |
| Fiscal Year | 2025 | 2024 |
Income Statement Analysis: The Bottom-Line Duel
This income statement comparison uncovers the true operational efficiency and profitability of two competitive corporate engines.
Teradyne, Inc. Analysis
Teradyne’s revenue rose from $2.68B in 2023 to $3.19B in 2025, showing a positive momentum. Gross margins remain robust at 58.55%, while net margins held favorably at 17.37%. Despite a slight net margin decline over the year, Teradyne sustains strong operating efficiency, evidenced by consistent EBIT margin growth and solid EPS gains.
Qnity Electronics, Inc. Analysis
Qnity’s revenue climbed steadily from $4.04B in 2023 to $4.34B in 2024. Gross margin sits at a healthy 46.11%, with EBIT margin slightly higher than Teradyne at 20.72%. Net margin improved markedly by 27.23% year-over-year, reflecting enhanced profitability and operational leverage, supported by a significant EPS growth of 36.69%.
Margin Dominance vs. Growth Momentum
Teradyne commands superior gross and net margins, reflecting operational efficiency and cost control. Qnity, meanwhile, excels in net margin growth and EPS momentum but operates with thinner gross margins and higher interest costs. Teradyne’s profile appeals to investors favoring margin strength, while Qnity suits those seeking accelerated profitability gains.
Financial Ratios Comparison
These vital ratios act as a diagnostic tool to expose the underlying fiscal health, valuation premiums, and capital efficiency of the companies analyzed:
| Ratios | Teradyne, Inc. (TER) | Qnity Electronics, Inc. (Q) |
|---|---|---|
| ROE | 19.8% | 6.5% |
| ROIC | 18.4% | 5.9% |
| P/E | 54.6 | 28.8 |
| P/B | 10.8 | 1.88 |
| Current Ratio | 1.76 | 1.77 |
| Quick Ratio | 1.41 | 1.06 |
| D/E | 0.12 | 0.018 |
| Debt-to-Assets | 8.3% | 1.6% |
| Interest Coverage | 86.4 | 3.03 |
| Asset Turnover | 0.76 | 0.35 |
| Fixed Asset Turnover | 4.99 | 2.59 |
| Payout ratio | 13.8% | 0% |
| Dividend yield | 0.25% | 0% |
| Fiscal Year | 2025 | 2024 |
Efficiency & Valuation Duel: The Vital Signs
Financial ratios act as a company’s DNA, revealing hidden risks and operational excellence behind headline numbers.
Teradyne, Inc.
Teradyne delivers strong profitability with a 19.8% ROE and healthy 17.4% net margin, signaling robust operational efficiency. The stock trades at a stretched 54.6 P/E and elevated 10.8 P/B, reflecting high market expectations. Shareholders receive a modest 0.25% dividend, while aggressive R&D spending (16% revenue) fuels future growth.
Qnity Electronics, Inc.
Qnity shows moderate profitability with a 6.5% ROE and 16.0% net margin, indicating less efficiency than peers. Its valuation is more reasonable at 28.8 P/E and 1.9 P/B, suggesting less market premium. The company pays no dividends, reinvesting capital primarily into R&D (7.2% of revenue) to support innovation and expansion.
Premium Valuation vs. Operational Safety
Teradyne’s superior returns justify its premium valuation but carry risk from high multiples. Qnity offers a safer valuation with less profitability and slower growth. Investors seeking growth may lean toward Teradyne; those prioritizing valuation discipline might prefer Qnity’s profile.
Which one offers the Superior Shareholder Reward?
Teradyne, Inc. (TER) pays a modest dividend yield around 0.38% with a sustainable payout ratio near 14%, supported by strong free cash flow coverage (2.25x). It complements dividends with steady buybacks, enhancing total returns. Qnity Electronics, Inc. (Q) pays no dividends, instead reinvesting cash flow into growth and acquisitions, reflected by a higher free cash flow yield and robust operating margins. While Q’s reinvestment strategy supports long-term expansion, TER’s balanced distribution through dividends and buybacks offers a more reliable shareholder reward in 2026. I conclude TER delivers the superior total return profile, blending income with capital appreciation more prudently.
Comparative Score Analysis: The Strategic Profile
The radar chart reveals the fundamental DNA and trade-offs of both Teradyne, Inc. and Qnity Electronics, Inc. across key financial dimensions:
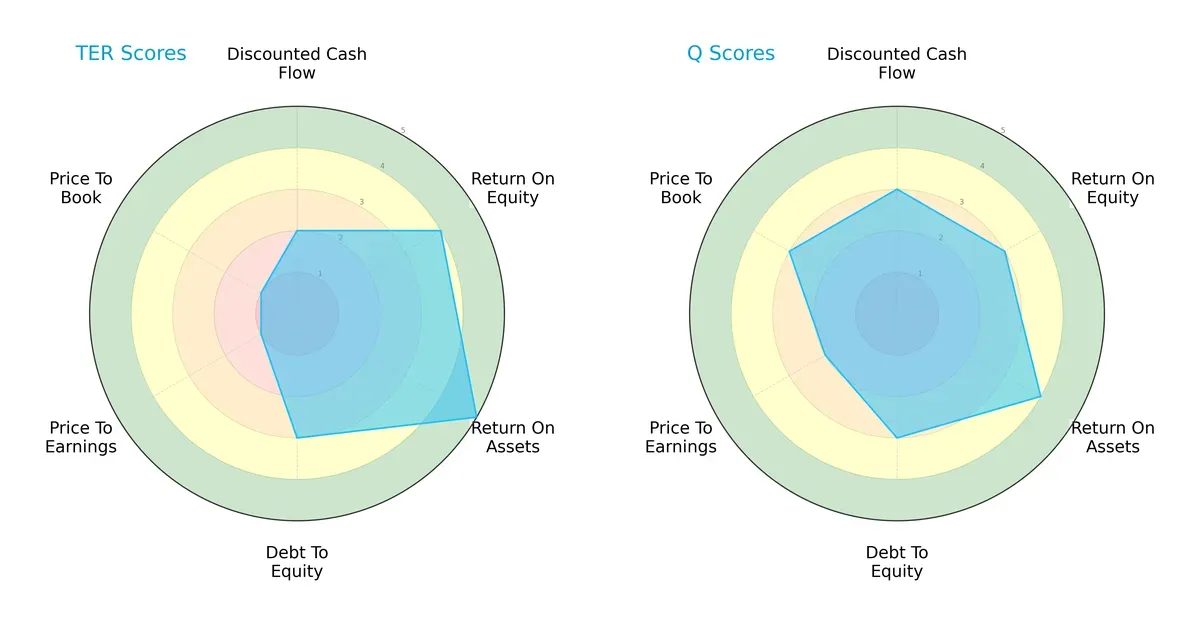
Teradyne excels in ROE (4 vs. 3) and ROA (5 vs. 4), signaling superior profitability and asset efficiency. Qnity holds a moderate advantage in DCF (3 vs. 2) and valuation metrics (P/E 2 vs. 1, P/B 3 vs. 1), implying better market pricing. Both share moderate debt-to-equity scores. Teradyne’s profile is profit-centric but undervalued, while Qnity offers a more balanced valuation and cash flow outlook.
Bankruptcy Risk: Solvency Showdown
Teradyne’s Altman Z-Score at 20.26 places it deep in the safe zone, indicating negligible bankruptcy risk in this cycle:

Financial Health: Quality of Operations
Teradyne’s Piotroski F-Score of 6 reflects average financial health, suggesting solid but improvable internal operations:

How are the two companies positioned?
This section dissects the operational DNA of Teradyne and Qnity by comparing their revenue distribution and internal dynamics. The goal is to confront their economic moats and identify which model offers the most resilient competitive advantage today.
Revenue Segmentation: The Strategic Mix
The following visual comparison dissects how Teradyne, Inc. and Qnity Electronics, Inc. diversify their income streams and where their primary sector bets lie:
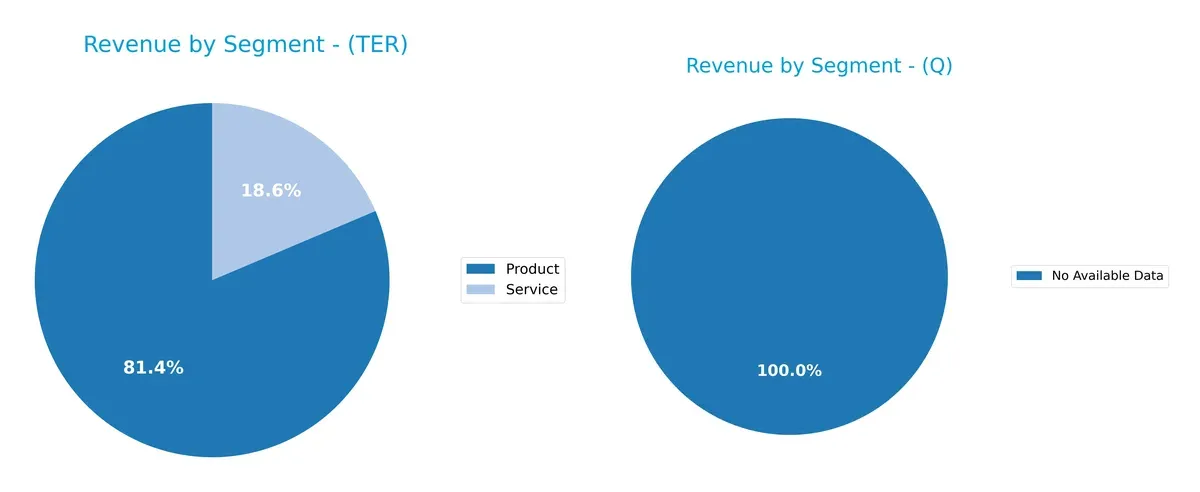
Teradyne relies heavily on its Product segment, generating $2.3B in 2024, which dwarfs its Service revenue of $525M. This concentration anchors Teradyne’s dominance in hardware, exposing it to product cycle risks but reinforcing infrastructure leadership. Qnity Electronics lacks available data, preventing segmentation assessment. Teradyne’s narrower focus contrasts with a more diversified model investors might prefer for risk mitigation.
Strengths and Weaknesses Comparison
This table compares the Strengths and Weaknesses of Teradyne, Inc. and Qnity Electronics, Inc.:
Teradyne, Inc. Strengths
- High net margin at 17.37%
- Strong ROE of 19.82%
- ROIC well above WACC at 18.45%
- Low debt levels with 0.12 D/E ratio
- Solid liquidity with 1.76 current ratio
- Diverse global revenue streams across Asia, US, and EMEA
Qnity Electronics, Inc. Strengths
- Favorable net margin at 15.99%
- Low debt-to-assets at 1.56%
- Current ratio at 1.77 supports liquidity
- WACC low at 5.83% indicating cheap capital
- Moderate P/B ratio at 1.88
- Presence of favorable quick ratio supports short-term solvency
Teradyne, Inc. Weaknesses
- High P/E of 54.64 suggests overvaluation risk
- Elevated P/B at 10.83 indicates market premium
- WACC at 12.35% is relatively high
- Dividend yield very low at 0.25%
- Asset turnover only neutral at 0.76
- Heavy reliance on semiconductor product sales may limit diversification
Qnity Electronics, Inc. Weaknesses
- Low ROE at 6.51% signals weak profitability
- ROIC only neutral at 5.92%
- Unfavorable asset turnover at 0.35 reflects inefficient asset use
- Interest coverage weak at 3.21, indicating risk in debt servicing
- Zero dividend yield may deter income investors
- P/E still high at 28.8 despite lower profitability
Teradyne excels in profitability and global diversification but faces valuation concerns and moderate asset use efficiency. Qnity shows solid liquidity and capital cost advantages but struggles with profitability and asset efficiency. These contrasts highlight differing strategic challenges and opportunities for each company.
The Moat Duel: Analyzing Competitive Defensibility
A structural moat protects long-term profits from relentless competition erosion. Only true moats ensure sustainable value creation:
Teradyne, Inc.: Diversified Technological Moat
Teradyne’s moat stems from intangible assets and advanced test platforms, reflected in a solid 6.1% ROIC premium over WACC. Despite declining ROIC trends, its innovation in semiconductor and industrial automation deepens competitive barriers in 2026.
Qnity Electronics, Inc.: Emerging Materials Innovation Moat
Qnity relies on specialized electronic materials, a distinct asset moat contrasting Teradyne’s platform dominance. With near-zero ROIC premium and stable profitability, Qnity’s moat remains unproven but shows potential as it expands semiconductor materials in a nascent market.
Moat Depth Battle: Established Platform vs. Nascent Materials Innovation
Teradyne boasts a wider moat with clear value creation and diversified tech assets. Qnity’s moat is narrower, lacking economic profits so far. Teradyne is better positioned to defend market share amid intensifying semiconductor competition.
Which stock offers better returns?
Teradyne, Inc. and Qnity Electronics, Inc. showed contrasting price movements over the past year, with Teradyne accelerating sharply while Qnity experienced modest gains under lower volatility.
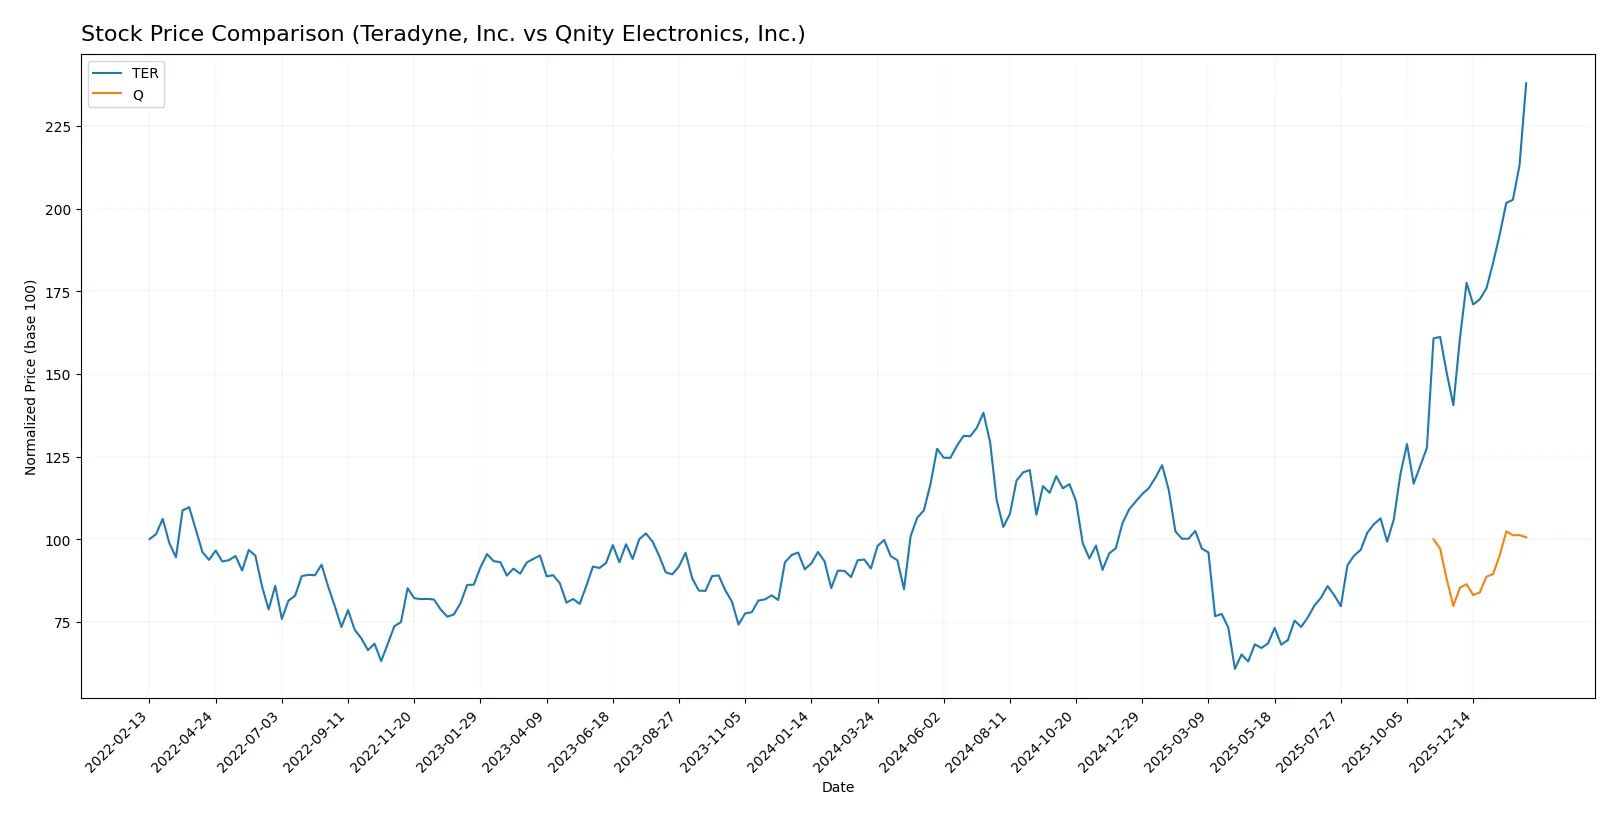
Trend Comparison
Teradyne’s stock surged 161.08% over the past year, indicating a strong bullish trend with accelerating momentum and a high volatility level (std. dev. 39.2). It reached a peak price of 269.07 and a low of 68.72, reflecting significant upward price swings.
Qnity Electronics’ stock increased by 0.54% over the same period, showing a neutral to mildly bullish trend with steady acceleration but lower volatility (std. dev. 7.17). Its price fluctuated between 75.8 and 97.25, demonstrating relative price stability.
Teradyne’s stock outperformed Qnity Electronics by a wide margin, delivering substantially higher returns and exhibiting stronger price acceleration in the past year.
Target Prices
Analysts present a confident consensus on target prices for Teradyne, Inc. and Qnity Electronics, Inc.
| Company | Target Low | Target High | Consensus |
|---|---|---|---|
| Teradyne, Inc. | 175 | 335 | 276.08 |
| Qnity Electronics, Inc. | 92 | 118 | 106.78 |
Teradyne’s target consensus at 276.08 slightly exceeds its current price of 269.07, indicating moderate upside potential. Qnity Electronics’ consensus target of 106.78 surpasses its 95.51 market price, suggesting positive analyst expectations.

Don’t Let Luck Decide Your Entry Point
Optimize your entry points with our advanced ProRealTime indicators. You’ll get efficient buy signals with precise price targets for maximum performance. Start outperforming now!
How do institutions grade them?
The following tables summarize recent institutional grades for Teradyne, Inc. and Qnity Electronics, Inc.:
Teradyne, Inc. Grades
Here are the latest grades from well-known financial institutions for Teradyne, Inc.:
| Grading Company | Action | New Grade | Date |
|---|---|---|---|
| Stifel | Maintain | Buy | 2026-02-04 |
| Goldman Sachs | Maintain | Buy | 2026-02-04 |
| Citigroup | Maintain | Buy | 2026-02-04 |
| Cantor Fitzgerald | Maintain | Overweight | 2026-02-04 |
| Evercore ISI Group | Maintain | Outperform | 2026-02-04 |
| Evercore ISI Group | Maintain | Outperform | 2026-02-03 |
| Cantor Fitzgerald | Maintain | Overweight | 2026-02-02 |
| Stifel | Maintain | Buy | 2026-01-30 |
| UBS | Maintain | Buy | 2026-01-26 |
| B of A Securities | Maintain | Buy | 2026-01-22 |
Qnity Electronics, Inc. Grades
Below are the recent grades from recognized institutions for Qnity Electronics, Inc.:
| Grading Company | Action | New Grade | Date |
|---|---|---|---|
| RBC Capital | Maintain | Outperform | 2025-11-25 |
| Mizuho | Maintain | Outperform | 2025-11-20 |
Which company has the best grades?
Teradyne, Inc. holds consistently strong Buy and Outperform ratings from major firms, reflecting broad institutional confidence. Qnity Electronics, Inc. also shows positive Outperform grades but from fewer institutions and older dates. This suggests Teradyne currently enjoys broader and more recent institutional endorsement, which may influence investor perception and liquidity.
Risks specific to each company
In the challenging 2026 market environment, these categories reveal critical pressure points and systemic threats facing Teradyne, Inc. and Qnity Electronics, Inc.:
1. Market & Competition
Teradyne, Inc.
- Faces intense competition in semiconductor test equipment with established product lines and diversified segments.
Qnity Electronics, Inc.
- As a new player in electronic solutions, risks stem from limited market presence and evolving competitive dynamics.
2. Capital Structure & Debt
Teradyne, Inc.
- Maintains low debt-to-equity (0.12) and strong interest coverage (81.43), indicating solid financial stability.
Qnity Electronics, Inc.
- Exhibits very low debt-to-equity (0.02) but much weaker interest coverage (3.21), signaling vulnerability if earnings falter.
3. Stock Volatility
Teradyne, Inc.
- High beta (1.82) suggests pronounced stock price swings relative to the market.
Qnity Electronics, Inc.
- Beta is zero, likely due to limited trading history, but recent price range is narrower, implying lower volatility.
4. Regulatory & Legal
Teradyne, Inc.
- Subject to global trade regulations impacting semiconductor supply chains and export controls.
Qnity Electronics, Inc.
- Faces regulatory scrutiny as a newly public company adjusting to compliance and reporting standards.
5. Supply Chain & Operations
Teradyne, Inc.
- Benefits from diversified supply chain but exposed to semiconductor industry cyclicality and component shortages.
Qnity Electronics, Inc.
- Supply chain risks amplified by early-stage operational scale and dependence on specialized materials.
6. ESG & Climate Transition
Teradyne, Inc.
- Increasing ESG initiatives in automation and energy-efficient products bolster long-term resilience.
Qnity Electronics, Inc.
- ESG profile unclear; as a recent IPO, it may face pressure to establish robust climate transition strategies.
7. Geopolitical Exposure
Teradyne, Inc.
- Global footprint exposes it to geopolitical tensions affecting semiconductor manufacturing hubs.
Qnity Electronics, Inc.
- Primarily US-based but vulnerable to supply-chain disruptions from international trade conflicts.
Which company shows a better risk-adjusted profile?
Teradyne’s key risk is its high stock volatility, a reflection of market sensitivity despite strong financial health. Qnity’s primary concern is its untested operational scale and weaker interest coverage, raising financial risk. Teradyne’s diversified segments and robust capital structure grant it a superior risk-adjusted profile. Notably, Teradyne’s Altman Z-Score of 20.26 confirms financial safety, while Qnity’s limited financial history leaves uncertainties unresolved.
Final Verdict: Which stock to choose?
Teradyne, Inc. (TER) stands out as a cash-efficient powerhouse with a proven ability to generate returns well above its cost of capital. Its superpower lies in disciplined capital allocation and operational leverage. A point of vigilance is its declining ROIC trend, signaling potential pressure on profitability. TER suits aggressive growth portfolios willing to tolerate valuation premiums.
Qnity Electronics, Inc. (Q) offers a strategic moat rooted in intangible assets and stable profitability. Its strength is a conservative financial structure with low debt, providing better safety than TER. While its returns trail TER’s, Q fits well with GARP investors seeking growth balanced with reasonable risk and valuation.
If you prioritize high return on invested capital and are comfortable with valuation risk, TER is the compelling choice due to its superior value creation and operational efficiency. However, if you seek better stability and a more conservative balance sheet, Q offers a more moderate growth path with less volatility. Both present analytical scenarios tailored to distinct investor profiles.
Disclaimer: Investment carries a risk of loss of initial capital. The past performance is not a reliable indicator of future results. Be sure to understand risks before making an investment decision.
Go Further
I encourage you to read the complete analyses of Teradyne, Inc. and Qnity Electronics, Inc. to enhance your investment decisions: