In the rapidly evolving semiconductor industry, Taiwan Semiconductor Manufacturing Company Limited (TSM) and Qnity Electronics, Inc. (Q) stand out as key players shaping the future of technology. TSM is a global leader in advanced chip fabrication, while Qnity focuses on innovative electronic materials essential for chip manufacturing. This comparison highlights their market roles and innovation strategies to help you identify which company aligns better with your investment goals. Let’s explore which is the smarter choice for your portfolio.
Table of contents
Companies Overview
I will begin the comparison between Taiwan Semiconductor Manufacturing Company Limited and Qnity Electronics, Inc. by providing an overview of these two companies and their main differences.
Taiwan Semiconductor Manufacturing Company Limited Overview
Taiwan Semiconductor Manufacturing Company Limited (TSM) operates globally as a leading semiconductor manufacturer, offering wafer fabrication processes for integrated circuits and semiconductor devices. Founded in 1987 and headquartered in Hsinchu City, Taiwan, TSMC supports high-performance computing, smartphones, IoT, automotive, and digital electronics markets, employing over 65K people and commanding a market cap of approximately 1.7T USD.
Qnity Electronics, Inc. Overview
Qnity Electronics, Inc. is a newer player in the semiconductor industry, focusing on electronic solutions and materials used in semiconductor chip manufacturing and advanced electronic materials. Based in Wilmington, Delaware, and renamed in 2025, Qnity operates in the technology sector with a market cap near 19B USD. The company emphasizes material provision rather than integrated circuit fabrication.
Key similarities and differences
Both TSM and Qnity operate within the semiconductor industry and technology sector, listed on the NYSE. However, TSM is a well-established, large-scale manufacturer specializing in wafer fabrication and integrated circuits, while Qnity concentrates on supplying electronic materials for chip manufacturing. TSM’s global footprint contrasts with Qnity’s more focused operational scope, reflecting differences in scale, market presence, and business model orientation.
Income Statement Comparison
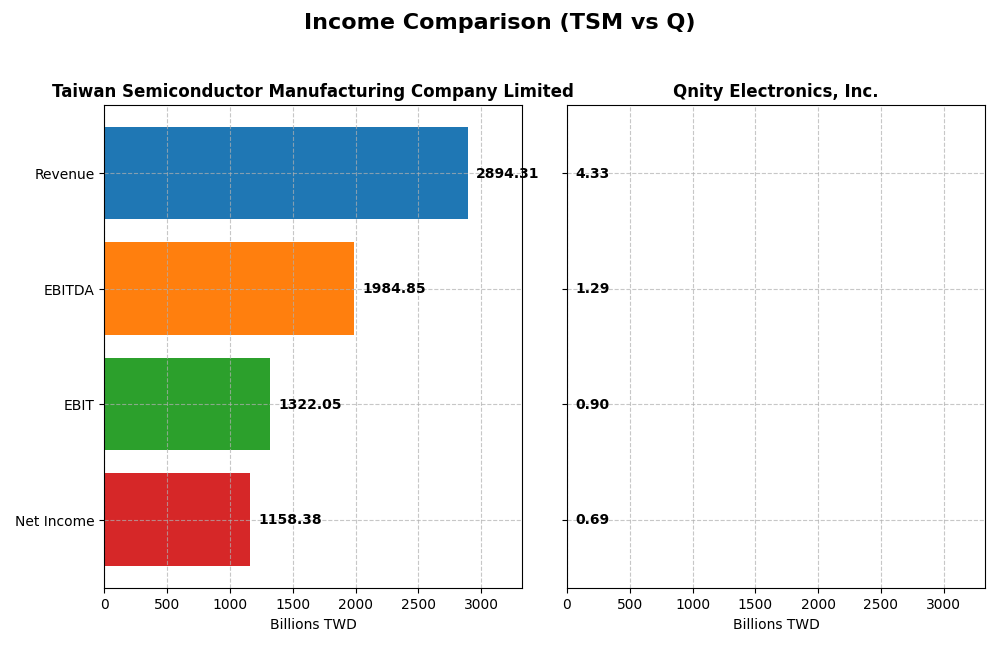
This table provides a side-by-side comparison of the 2024 fiscal year income statement metrics for Taiwan Semiconductor Manufacturing Company Limited (TSM) and Qnity Electronics, Inc. (Q).
| Metric | Taiwan Semiconductor Manufacturing Company Limited (TSM) | Qnity Electronics, Inc. (Q) |
|---|---|---|
| Market Cap | 1.70T TWD | 18.8B USD |
| Revenue | 2.89T TWD | 4.34B USD |
| EBITDA | 1.98T TWD | 1.29B USD |
| EBIT | 1.32T TWD | 898M USD |
| Net Income | 1.16T TWD | 693M USD |
| EPS | 223.4 TWD | 3.31 USD |
| Fiscal Year | 2024 | 2024 |
Income Statement Interpretations
Taiwan Semiconductor Manufacturing Company Limited
Taiwan Semiconductor Manufacturing Company Limited (TSM) showed a strong upward trend in revenue and net income from 2020 to 2024, with revenue more than doubling and net income increasing by 126.8%. Margins remained robust, with a gross margin of 56.12% and net margin at 40.02% in 2024. The latest year saw a 33.89% revenue growth and a slight net margin improvement, signaling stable profitability.
Qnity Electronics, Inc.
Qnity Electronics, Inc. (Q) experienced mixed trends between 2022 and 2024, with revenue declining overall by 8.83% despite a 7.43% increase in the last year. Net income also decreased by 10.47% over the period but grew 36.69% in 2024. Margins improved modestly, with a favorable net margin of 15.99% and EBIT margin of 20.72% in 2024, reflecting recent operational gains.
Which one has the stronger fundamentals?
TSM presents stronger fundamentals with consistent revenue and net income growth, high and stable margins, and mostly favorable income statement evaluations. Q shows some recent improvement but faces an overall negative growth trend and less favorable margin expansion. While both companies have favorable outlooks, TSM’s scale and margin strength stand out more clearly.
Financial Ratios Comparison
The table below provides a side-by-side comparison of key financial ratios for Taiwan Semiconductor Manufacturing Company Limited (TSM) and Qnity Electronics, Inc. (Q) for the fiscal year 2024.
| Ratios | Taiwan Semiconductor Manufacturing Company Limited (TSM) | Qnity Electronics, Inc. (Q) |
|---|---|---|
| ROE | 27.29% | 6.51% |
| ROIC | 19.99% | 5.92% |
| P/E | 29.04 | 28.80 |
| P/B | 7.92 | 1.88 |
| Current Ratio | 2.36 | 1.77 |
| Quick Ratio | 2.14 | 1.06 |
| D/E | 0.25 | 0.02 |
| Debt-to-Assets | 15.65% | 1.56% |
| Interest Coverage | 126.0 | 3.03 |
| Asset Turnover | 0.43 | 0.35 |
| Fixed Asset Turnover | 0.88 | 2.59 |
| Payout ratio | 31.34% | 0% |
| Dividend yield | 1.08% | 0% |
Interpretation of the Ratios
Taiwan Semiconductor Manufacturing Company Limited
Taiwan Semiconductor Manufacturing Company Limited presents mostly strong financial ratios, including a favorable net margin of 40.02% and a return on equity of 27.29%, indicating efficient profitability and shareholder value creation. Some unfavorable ratios include a high price-to-book ratio of 7.92 and lower asset turnover, which may signal valuation concerns and operational efficiency challenges. The company offers a dividend yield of 1.08%, with stable payouts supported by solid free cash flow, suggesting sustainable returns without excessive repurchases.
Qnity Electronics, Inc.
Qnity Electronics, Inc. shows mixed ratios with a favorable net margin of 15.99% but a weak return on equity of 6.51%, reflecting moderate profitability but limited shareholder return. The company maintains a low debt-to-assets ratio and reasonable liquidity, although its price-to-earnings ratio is high at 28.8, which may imply valuation risks. Qnity does not pay dividends, likely prioritizing reinvestment or growth strategies, consistent with its recent IPO and focus on advanced materials and R&D.
Which one has the best ratios?
Taiwan Semiconductor Manufacturing Company Limited exhibits a more favorable overall ratio profile, with stronger profitability, liquidity, and coverage ratios despite some valuation concerns. Qnity Electronics, Inc. shows slightly favorable ratios but weaker returns for shareholders and no dividend yield, reflecting its early growth stage and reinvestment focus. Thus, Taiwan Semiconductor Manufacturing Company Limited holds the more robust financial ratio set.
Strategic Positioning
This section compares the strategic positioning of Taiwan Semiconductor Manufacturing Company Limited (TSM) and Qnity Electronics, Inc. (Q) based on market position, key segments, and exposure to technological disruption:
TSM
- Leading global semiconductor manufacturer with significant competitive pressure from peers.
- Key segments include wafer fabrication and other semiconductor products driving revenue growth.
- Invests in technology startups and engineering support, adapting to semiconductor industry shifts.
Q
- Smaller player focused on electronic solutions and materials in semiconductor manufacturing.
- Concentrated on advanced electronic materials and solutions without disclosed revenue segmentation.
- Limited information on technological disruption exposure; focuses on semiconductor materials.
TSM vs Q Positioning
TSM exhibits a diversified business model with broad wafer fabrication and additional products, supporting global scale. Q maintains a concentrated focus on semiconductor materials, with less disclosed diversification and shorter market presence.
Which has the best competitive advantage?
TSM shows a slightly favorable moat with value creation despite declining ROIC, indicating some competitive advantage. Q’s neutral moat with stable but no value creation suggests limited competitive advantage currently.
Stock Comparison
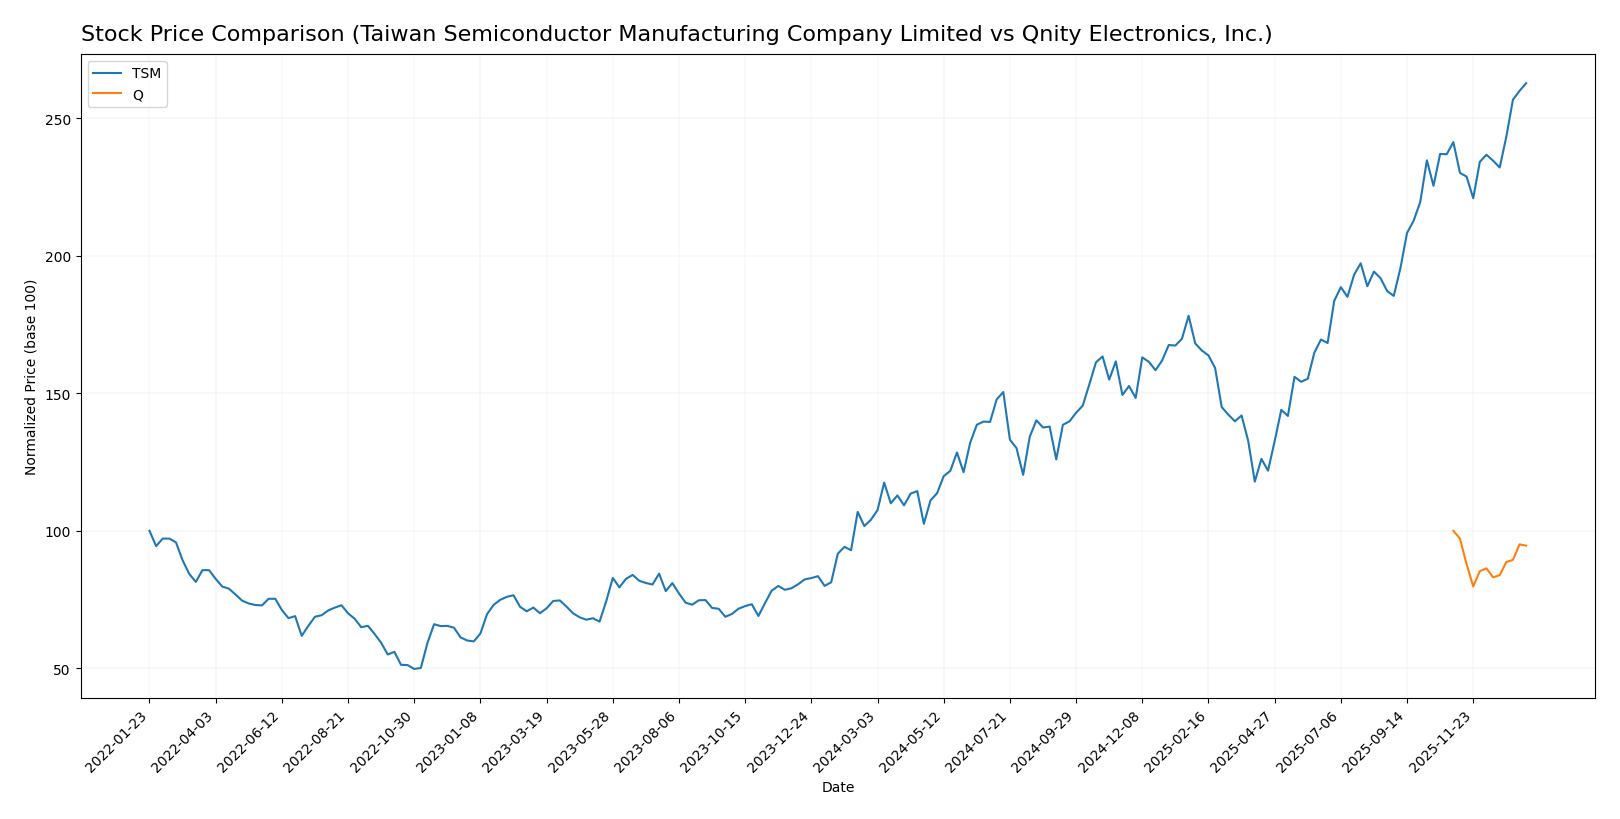
The past year showed marked divergence in stock price performance, with Taiwan Semiconductor Manufacturing Company Limited exhibiting strong gains and accelerating momentum, while Qnity Electronics, Inc. faced a declining trend under stable conditions.
Trend Analysis
Taiwan Semiconductor Manufacturing Company Limited’s stock surged 152.54% over the last 12 months, demonstrating a bullish trend with accelerating momentum and significant price volatility, ranging between 127.7 and 327.11. Recent months show continued positive growth with an 8.88% increase.
Qnity Electronics, Inc. recorded a 5.39% decline over the same period, indicating a bearish trend marked by stable acceleration and lower volatility, with prices fluctuating between 75.8 and 95.0. The recent trend remains negative with a slight downward slope.
Comparing both, Taiwan Semiconductor Manufacturing Company Limited delivered the highest market performance with a substantial price increase and strong upward momentum, while Qnity Electronics, Inc. experienced a moderate decline.
Target Prices
Analysts present a positive target consensus for both Taiwan Semiconductor Manufacturing Company Limited and Qnity Electronics, Inc.
| Company | Target High | Target Low | Consensus |
|---|---|---|---|
| Taiwan Semiconductor Manufacturing Company Limited | 400 | 330 | 361.25 |
| Qnity Electronics, Inc. | 117 | 92 | 105.89 |
The consensus target prices for TSM and Q are above their current market prices of 327.11 and 89.88, indicating analyst expectations of potential upside for both stocks.
Analyst Opinions Comparison
This section compares analysts’ ratings and grades for Taiwan Semiconductor Manufacturing Company Limited (TSM) and Qnity Electronics, Inc. (Q):
Rating Comparison
TSM Rating
- Rating: A-, classified as Very Favorable by analysts.
- Discounted Cash Flow Score: 5, indicating a Very Favorable valuation based on future cash flow.
- ROE Score: 5, reflecting very efficient profit generation from shareholders’ equity.
- ROA Score: 5, demonstrating very effective use of assets to generate earnings.
- Debt To Equity Score: 3, considered Moderate financial risk.
- Overall Score: 4, evaluated as Favorable financial standing.
Q Rating
- Rating: B+, also rated Very Favorable, but lower than TSM’s rating.
- Discounted Cash Flow Score: 4, showing a Favorable valuation but below TSM’s score.
- ROE Score: 3, suggesting moderate efficiency in generating profits from equity.
- ROA Score: 4, indicating favorable asset utilization, though less than TSM’s score.
- Debt To Equity Score: 3, also Moderate, showing similar financial risk level to TSM.
- Overall Score: 3, considered Moderate, lower than TSM’s overall assessment.
Which one is the best rated?
Based strictly on the provided data, TSM holds a superior rating with an A- grade and higher scores across key metrics like discounted cash flow, ROE, ROA, and overall score compared to Q’s B+ rating and moderate scores.
Scores Comparison
Here is the comparison of the financial scores for Taiwan Semiconductor Manufacturing Company Limited and Qnity Electronics, Inc.:
TSM Scores
- Altman Z-Score of 2.94 places TSM in the grey zone, indicating moderate bankruptcy risk.
- Piotroski Score of 8 shows TSM has very strong financial strength based on profitability and efficiency.
Q Scores
- No Altman Z-Score data available.
- No Piotroski Score data available.
Which company has the best scores?
Based on the available data, TSM has a moderate Altman Z-Score and a very strong Piotroski Score, while Qnity Electronics lacks any provided scores for comparison. Therefore, TSM has the best scores strictly according to the given information.
Grades Comparison
Here is a comparison of the recent grades assigned to Taiwan Semiconductor Manufacturing Company Limited and Qnity Electronics, Inc.:
Taiwan Semiconductor Manufacturing Company Limited Grades
The following table summarizes recent grades from reliable financial institutions for TSM:
| Grading Company | Action | New Grade | Date |
|---|---|---|---|
| Bernstein | Maintain | Outperform | 2025-12-08 |
| Needham | Maintain | Buy | 2025-10-27 |
| Barclays | Maintain | Overweight | 2025-10-17 |
| Needham | Maintain | Buy | 2025-10-16 |
| Susquehanna | Maintain | Positive | 2025-10-10 |
| Barclays | Maintain | Overweight | 2025-10-09 |
| Barclays | Maintain | Overweight | 2025-09-16 |
| Needham | Maintain | Buy | 2025-07-17 |
| Susquehanna | Maintain | Positive | 2025-07-14 |
| Needham | Maintain | Buy | 2025-07-01 |
TSM’s grades consistently show a positive outlook with repeated “Buy,” “Outperform,” and “Overweight” ratings maintained by major firms.
Qnity Electronics, Inc. Grades
The following table summarizes recent grades from reliable financial institutions for Q:
| Grading Company | Action | New Grade | Date |
|---|---|---|---|
| RBC Capital | Maintain | Outperform | 2025-11-25 |
| Mizuho | Maintain | Outperform | 2025-11-20 |
Q has received fewer ratings, both “Outperform,” indicating a favorable but less broadly covered outlook compared to TSM.
Which company has the best grades?
TSM has a broader and more frequent set of positive grades, including multiple “Buy” and “Outperform” ratings from several respected firms, while Q has fewer but consistently positive “Outperform” ratings. This suggests TSM benefits from more extensive analyst coverage, which may provide investors with greater confidence and insight into its prospects.
Strengths and Weaknesses
Here is a comparative overview of the key strengths and weaknesses of Taiwan Semiconductor Manufacturing Company Limited (TSM) and Qnity Electronics, Inc. (Q) based on the latest available data.
| Criterion | Taiwan Semiconductor Manufacturing Company Limited (TSM) | Qnity Electronics, Inc. (Q) |
|---|---|---|
| Diversification | Moderate; primarily focused on wafer production with some other products (~380B TWD in 2024) | Limited information; appears less diversified |
| Profitability | High profitability: net margin 40.02%, ROIC 20%, ROE 27.29% (favorable) | Moderate profitability: net margin 15.99% (favorable), ROIC 5.92% (neutral), ROE 6.51% (unfavorable) |
| Innovation | Strong R&D focus as industry leader, though ROIC trend is declining | Innovation level unclear, no strong moat or competitive advantage shown |
| Global presence | Extensive global footprint, leader in semiconductor foundry market | Smaller scale, more regional or niche presence |
| Market Share | Dominates semiconductor wafer foundry market | Market share and scale significantly smaller |
Key takeaways: TSM demonstrates strong profitability, global presence, and market dominance but faces a declining ROIC trend, signaling caution on future efficiency. Q shows stable but limited profitability and lacks a clear competitive moat, indicating higher risk and uncertainty for investors.
Risk Analysis
Below is a comparative table highlighting key risks for Taiwan Semiconductor Manufacturing Company Limited (TSM) and Qnity Electronics, Inc. (Q) as of 2026.
| Metric | Taiwan Semiconductor Manufacturing Company Limited (TSM) | Qnity Electronics, Inc. (Q) |
|---|---|---|
| Market Risk | Moderate (Beta 1.27, sensitive to tech sector cycles) | Low (Beta 0, limited trading history) |
| Debt level | Low (Debt-to-Equity 0.25, favorable) | Very Low (Debt-to-Equity 0.02) |
| Regulatory Risk | Elevated (Geopolitical tensions in Taiwan and China) | Moderate (U.S. regulations on semiconductors) |
| Operational Risk | Moderate (Complex global supply chain) | Moderate (New company, operational scaling) |
| Environmental Risk | Moderate (High energy usage in semiconductor manufacturing) | Low to Moderate (Less data, newer operations) |
| Geopolitical Risk | High (Taiwan-China relations impacting production) | Low to Moderate (U.S.-centric operations) |
TSM faces the most significant risks from geopolitical tensions affecting Taiwan and regulatory scrutiny. Its moderate market sensitivity and operational complexity add to the risk profile. Q, as a newer U.S.-based company, shows lower debt and market risks but carries operational risks due to its recent IPO and scaling phase. Investors should weigh TSM’s geopolitical exposure carefully, while Q’s limited operating history suggests higher uncertainty.
Which Stock to Choose?
Taiwan Semiconductor Manufacturing Company Limited (TSM) shows strong income growth with a 33.89% revenue increase in 2024 and favorable profitability metrics, including a 40.02% net margin. Its financial ratios are mostly favorable, reflecting solid liquidity and moderate debt, supported by a very favorable A- rating. However, its ROIC is declining despite exceeding WACC, indicating value creation but some weakening profitability.
Qnity Electronics, Inc. (Q) presents moderate income growth with a 7.43% revenue increase in 2024 and a 15.99% net margin. Financial ratios are slightly favorable with low debt and acceptable liquidity, earning a very favorable B+ rating. Its ROIC roughly equals WACC, suggesting no clear economic moat, and stable but limited profitability.
Investors prioritizing strong historical income growth and a robust economic moat might find TSM more aligned with growth and quality investing profiles, whereas those seeking stability with lower leverage could interpret Q as slightly favorable for moderate growth strategies. Ultimately, stock favorability may depend on the investor’s appetite for growth versus stability.
Disclaimer: Investment carries a risk of loss of initial capital. The past performance is not a reliable indicator of future results. Be sure to understand risks before making an investment decision.
Go Further
I encourage you to read the complete analyses of Taiwan Semiconductor Manufacturing Company Limited and Qnity Electronics, Inc. to enhance your investment decisions: