Home > Comparison > Technology > STM vs Q
The strategic rivalry between STMicroelectronics N.V. and Qnity Electronics, Inc. shapes the semiconductor sector’s evolution. STMicroelectronics operates as a diversified semiconductor manufacturer with integrated automotive and industrial solutions. In contrast, Qnity Electronics specializes in advanced electronic materials and manufacturing inputs, carving a niche in chip production support. This analysis explores their contrasting operational models to identify which offers a superior risk-adjusted return for a diversified portfolio in today’s dynamic technology landscape.
Table of contents
Companies Overview
STMicroelectronics and Qnity Electronics stand as key players shaping the semiconductor landscape in 2026.
STMicroelectronics: Global Semiconductor Innovator
STMicroelectronics dominates as a semiconductor designer and manufacturer with a diverse portfolio spanning automotive ICs, sensors, and microcontrollers. Its revenue primarily flows from three segments: Automotive and Discrete, Analog and MEMS sensors, and Microcontrollers. In 2026, the company strategically focuses on integrating advanced power transistor tech and wireless solutions, reinforcing its position across automotive and industrial markets.
Qnity Electronics: Advanced Materials Specialist
Qnity Electronics carves a niche supplying specialized electronic materials essential to semiconductor chip manufacturing. Since rebranding in 2025, it generates revenue by providing advanced materials critical for cutting-edge semiconductor production. Its 2026 strategy emphasizes expanding its role in the semiconductor supply chain, leveraging innovative materials to support next-generation chip fabrication processes.
Strategic Collision: Similarities & Divergences
Both companies operate within the semiconductor sector, yet their philosophies diverge sharply. STMicroelectronics drives value through integrated hardware solutions spanning end markets, while Qnity Electronics focuses on upstream materials innovation. Their primary battleground centers on enabling semiconductor advancements—ST with finished components, Qnity with foundational materials. This contrast defines their distinct investment profiles: one grounded in diversified hardware leadership, the other in specialized supply chain innovation.
Income Statement Comparison
This data dissects the core profitability and scalability of both corporate engines to reveal who dominates the bottom line:
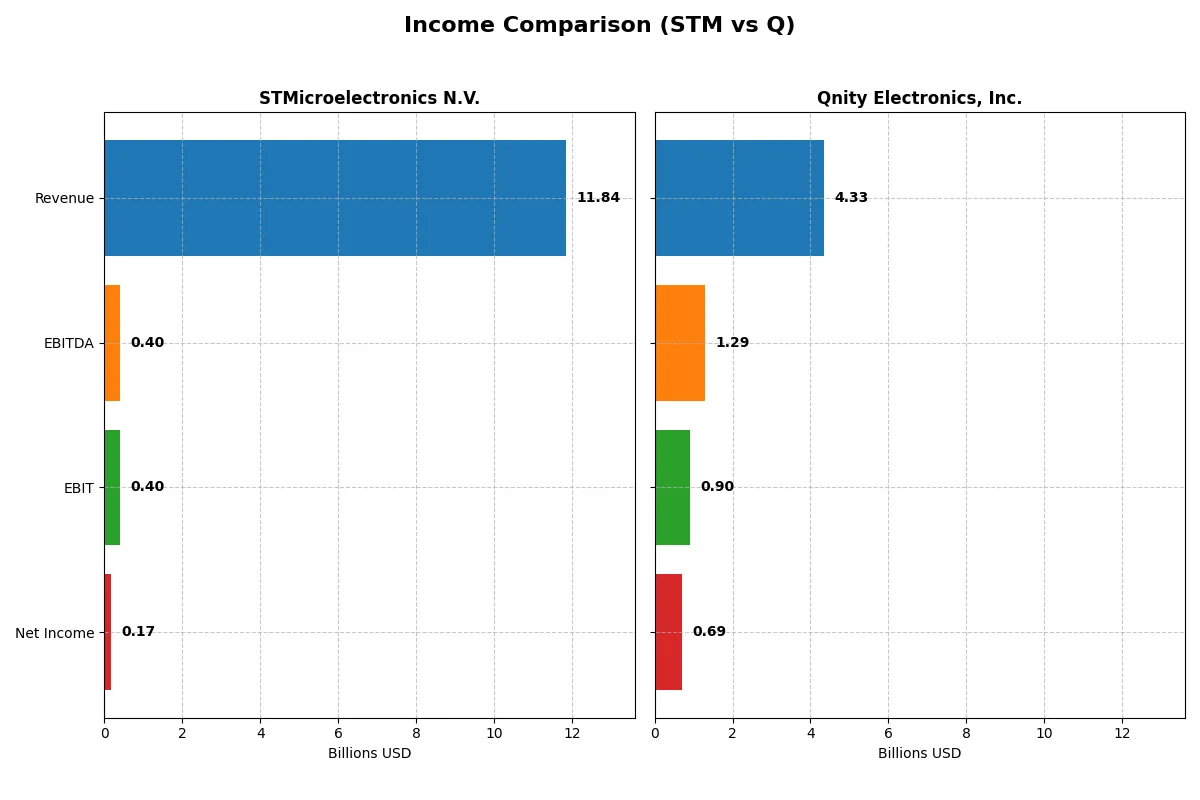
| Metric | STMicroelectronics N.V. (STM) | Qnity Electronics, Inc. (Q) |
|---|---|---|
| Revenue | 11.8B | 4.3B |
| Cost of Revenue | 7.8B | 2.3B |
| Operating Expenses | 3.7B | 1.2B |
| Gross Profit | 4.0B | 2.0B |
| EBITDA | 401M | 1.3B |
| EBIT | 401M | 898M |
| Interest Expense | 0 | 280M |
| Net Income | 167M | 693M |
| EPS | 0.19 | 3.31 |
| Fiscal Year | 2025 | 2024 |
Income Statement Analysis: The Bottom-Line Duel
This income statement comparison reveals which company’s financial engine runs more efficiently through their revenue and profit dynamics.
STMicroelectronics N.V. Analysis
STMicroelectronics’ revenue declined from 17.3B in 2023 to 11.8B in 2025, dragging net income sharply down from 4.2B to 167M. Its gross margin contracted substantially to 33.9%, while net margin slipped to a weak 1.4%. The latest year shows unfavorable momentum with steep drops in EBIT and EPS, suggesting operational challenges.
Qnity Electronics, Inc. Analysis
Qnity Electronics grew revenue modestly from 4.0B in 2023 to 4.3B in 2024, with net income rising from 507M to 693M. Gross margin expanded robustly to 46.1%, and net margin reached a healthy 16.0%. EBIT surged 37% year-over-year, signaling strong profit efficiency and improving operational leverage in the most recent fiscal year.
Margin Strength vs. Revenue Decline
Qnity Electronics clearly outperforms STMicroelectronics on margin quality and recent profit growth. While STM’s larger scale is evident, its steep revenue and earnings decline weigh heavily. Qnity’s profile offers superior margin expansion and earnings momentum, appealing more to investors prioritizing profitability over sheer size.
Financial Ratios Comparison
These vital ratios act as a diagnostic tool to expose the underlying fiscal health, valuation premiums, and capital efficiency of each company:
| Ratios | STMicroelectronics N.V. (STM) | Qnity Electronics, Inc. (Q) |
|---|---|---|
| ROE | 0.0892 | 0.0651 |
| ROIC | 0.0634 | 0.0592 |
| P/E | 14.43 | 28.80 |
| P/B | 1.29 | 1.88 |
| Current Ratio | 3.11 | 1.77 |
| Quick Ratio | 2.37 | 1.06 |
| D/E (Debt to Equity) | 0.18 | 0.02 |
| Debt-to-Assets | 0.13 | 0.02 |
| Interest Coverage | 19.72 | 3.03 |
| Asset Turnover | 0.54 | 0.35 |
| Fixed Asset Turnover | 1.22 | 2.59 |
| Payout ratio | 0.18 | 0 |
| Dividend yield | 0.013 | 0 |
| Fiscal Year | 2025 | 2024 |
Efficiency & Valuation Duel: The Vital Signs
Financial ratios act as a company’s DNA, exposing hidden risks and revealing operational efficiency crucial for investment decisions.
STMicroelectronics N.V.
STM shows weak profitability with ROE at 0.93% and net margin at 1.41%, signaling operational challenges. Its valuation metrics like P/E and P/B are favorable, suggesting the stock is not stretched. STM does not pay dividends, instead allocating resources heavily to R&D, investing 15.65% of revenue to fuel future growth.
Qnity Electronics, Inc.
Q boasts a strong net margin of 15.99%, highlighting efficient operations, yet its ROE at 6.51% remains moderate. The stock appears expensive with a P/E of 28.8, reflecting growth expectations. Q also skips dividends, focusing on steady capital reinvestment and maintaining a low debt load to support innovation and expansion.
Valuation Discipline vs. Profitability Efficiency
STM offers a more conservative valuation but struggles with low profitability metrics, while Q delivers higher margins at a premium price. Investors prioritizing value may find STM’s profile more suitable, whereas those seeking operational efficiency at a cost may lean toward Q. Risk tolerance will dictate the preferred balance.
Which one offers the Superior Shareholder Reward?
I compare STMicroelectronics (STM) and Qnity Electronics (Q) on their shareholder return strategies. STM pays a modest dividend yield of 1.28% with a conservative 18.5% payout ratio, but its free cash flow turned negative in 2025, signaling pressure on dividend sustainability. STM’s buybacks are not disclosed, limiting buyback impact analysis. Conversely, Q pays no dividend but delivers robust free cash flow yield (FCF coverage ~81%) and channels capital aggressively into buybacks, enhancing shareholder value through capital return and growth reinvestment. I see Q’s zero-dividend, high-buyback model as more sustainable and potent for capital appreciation in 2026. Therefore, Q offers a superior total return profile for investors seeking growth and shareholder reward this year.
Comparative Score Analysis: The Strategic Profile
The radar chart reveals the fundamental DNA and trade-offs of STMicroelectronics N.V. and Qnity Electronics, Inc., highlighting their core financial strengths and vulnerabilities:
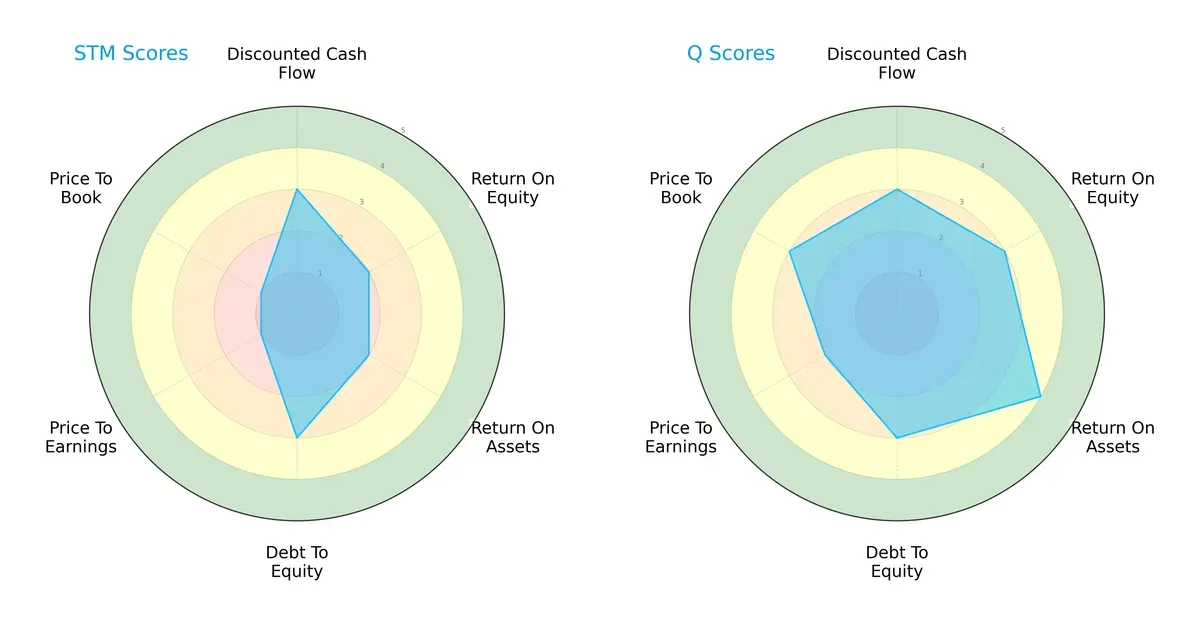
Qnity Electronics leads with a more balanced financial profile, scoring higher in ROE (3 vs. 2), ROA (4 vs. 2), and valuation metrics (P/E 2 vs. 1, P/B 3 vs. 1). Both firms share moderate DCF and debt-to-equity scores (3 each), but STMicroelectronics relies heavily on debt management while struggling with undervaluation. Qnity’s stronger asset efficiency and fairer market valuation position it as the more robust candidate for growth investors.
Bankruptcy Risk: Solvency Showdown
STMicroelectronics’ Altman Z-Score of 3.91 places it firmly in the safe zone, suggesting strong long-term survival prospects amid economic cycles compared to Qnity Electronics, Inc., which lacks a comparable score:

Financial Health: Quality of Operations
STMicroelectronics scores an impressive 8 on the Piotroski F-Score scale, signaling very strong financial health and operational quality. Qnity Electronics has no available data for comparison:

How are the two companies positioned?
This section dissects STM and Q’s operational DNA by comparing their revenue distribution and internal strengths and weaknesses. The goal is to confront their economic moats and identify which model delivers the most resilient, sustainable competitive advantage today.
Revenue Segmentation: The Strategic Mix
The following visual comparison dissects how STMicroelectronics N.V. and Qnity Electronics, Inc. diversify their income streams and where their primary sector bets lie:
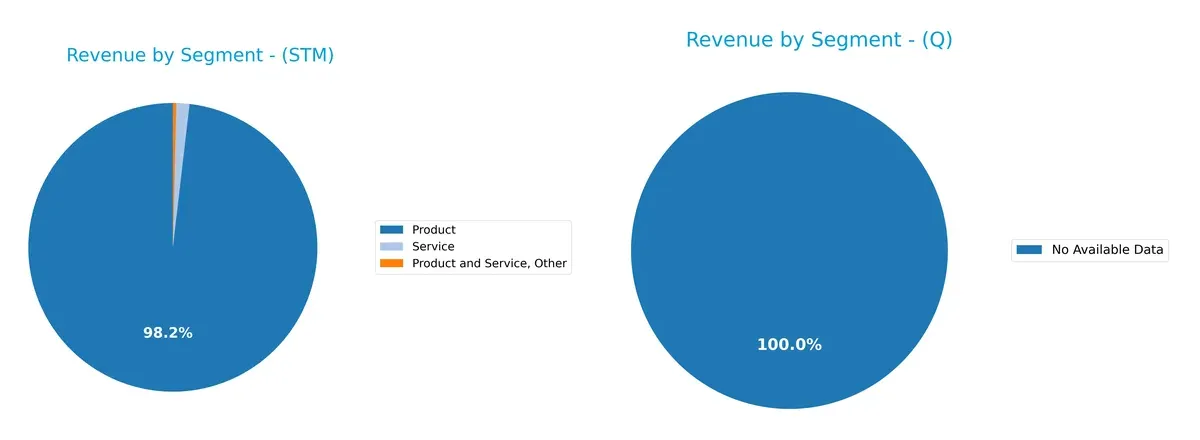
STMicroelectronics N.V. anchors its revenue with a dominant Product segment at $13.2B in 2024, complemented by modest Service and Other revenues. Qnity Electronics, Inc. lacks available data, preventing segmentation analysis. STM’s focus on product sales signals infrastructure dominance but carries concentration risk without broader diversification. This strategy may leverage scale but exposes STM to market shifts in core product demand.
Strengths and Weaknesses Comparison
This table compares the Strengths and Weaknesses of STMicroelectronics (STM) and Qnity Electronics (Q):
STM Strengths
- Diverse product portfolio with significant revenue in products and services
- Strong global presence with major sales in Asia Pacific and Americas
- Low debt-to-assets ratio and favorable debt equity
Q Strengths
- High net margin indicating strong profitability
- Favorable weighted average cost of capital (WACC)
- Solid current and quick ratios reflect good liquidity
- Very low debt levels
STM Weaknesses
- Low profitability ratios: net margin, ROE, and ROIC all unfavorable
- High current ratio indicating potential inefficiency in asset management
- Asset turnover below industry benchmarks
- Zero dividend yield limits income appeal
Q Weaknesses
- Moderate ROE and neutral ROIC suggest room for efficiency gains
- Unfavorable price-to-earnings ratio may indicate overvaluation
- Asset turnover below average
- Zero dividend yield limits shareholder income
Both companies show a balanced mix of strengths and weaknesses. STM’s global reach and low leverage contrast with weaker profitability, while Q’s strong profitability and liquidity come with valuation and efficiency concerns. These factors shape each company’s strategic priorities in capital allocation and operational performance.
The Moat Duel: Analyzing Competitive Defensibility
A structural moat is the only reliable barrier protecting long-term profits from relentless competition erosion. Let’s dissect the competitive defenses of two semiconductor players:
STMicroelectronics N.V. (STM): Legacy Cost Advantage Under Pressure
STM’s moat hinges on cost advantage through diversified semiconductor product lines and geographic reach. However, declining ROIC and shrinking margins reveal weakening profitability. New automotive and sensor markets could either revive or further strain this cost edge in 2026.
Qnity Electronics, Inc. (Q): Emerging Niche with Stable Profitability
Q’s moat rests on specialized electronic materials for chip manufacturing, marked by higher gross and net margins than STM. While ROIC shows no growth, stable profitability and recent revenue gains suggest potential for market niche expansion or disruption in 2026.
Cost Efficiency vs. Specialized Materials: Which Moat Holds Stronger?
STM’s eroding cost advantage contrasts with Q’s stable, albeit unproven, niche moat. I see Q’s focused profitability as a wider moat today. Q is better positioned to defend and grow market share amid semiconductor sector volatility.
Which stock offers better returns?
The past year shows contrasting dynamics: STMicroelectronics N.V. suffers a steep decline with recent recovery, while Qnity Electronics, Inc. maintains modest gains accelerating into 2026.
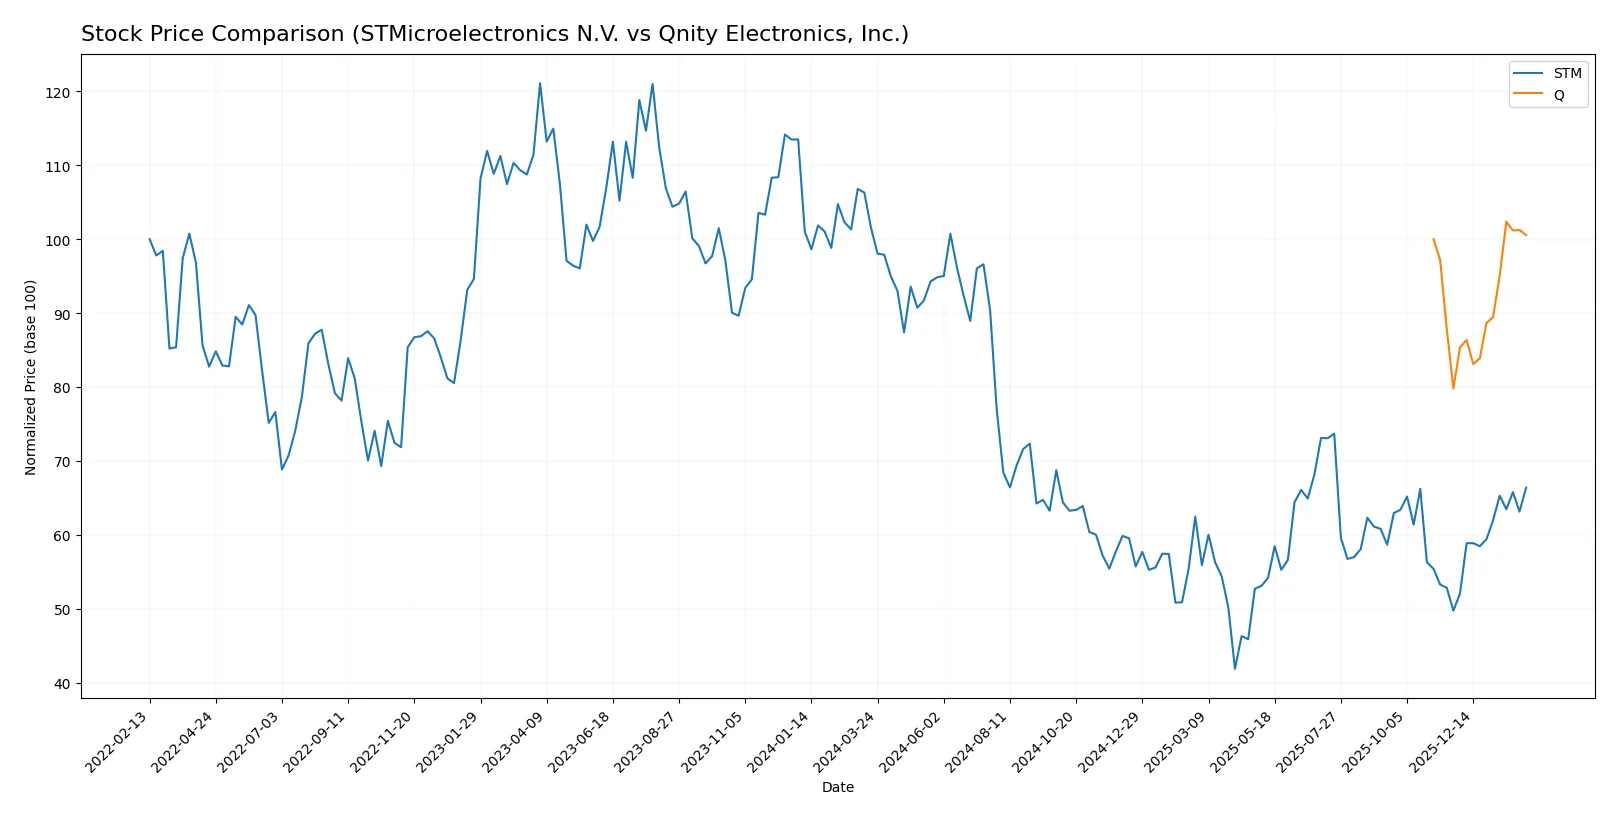
Trend Comparison
STMicroelectronics N.V. posts a bearish 34.6% decline over 12 months, with accelerating losses and significant volatility (6.54 std dev). The stock hit a low of 18.49 and a high of 44.85.
Qnity Electronics, Inc. records a slight 0.54% gain over the year, marked bullish with acceleration and higher volatility (7.17 std dev). Price ranged from 75.8 to 97.25.
Qnity Electronics delivers the highest market performance year-to-date. STMicroelectronics shows greater recent price rebound but remains deeply negative annually.
Target Prices
Analysts present a bullish consensus for both STMicroelectronics N.V. and Qnity Electronics, Inc., reflecting positive growth expectations.
| Company | Target Low | Target High | Consensus |
|---|---|---|---|
| STMicroelectronics N.V. | 28 | 45 | 37.67 |
| Qnity Electronics, Inc. | 92 | 118 | 106.78 |
STMicroelectronics’ consensus target at 37.67 implies a 28% upside from its current 29.33 price, signaling strong growth potential. Qnity Electronics’ target consensus at 106.78 suggests a 12% gain from the current 95.51, affirming market confidence.

Don’t Let Luck Decide Your Entry Point
Optimize your entry points with our advanced ProRealTime indicators. You’ll get efficient buy signals with precise price targets for maximum performance. Start outperforming now!
How do institutions grade them?
The following section compares recent institutional grades for STMicroelectronics N.V. and Qnity Electronics, Inc.:
STMicroelectronics N.V. Grades
Here are the latest grades issued by reputable firms for STMicroelectronics N.V.:
| Grading Company | Action | New Grade | Date |
|---|---|---|---|
| TD Cowen | maintain | Buy | 2025-10-24 |
| Susquehanna | maintain | Positive | 2025-10-22 |
| Susquehanna | maintain | Positive | 2025-07-25 |
| Baird | upgrade | Outperform | 2025-07-22 |
| Susquehanna | maintain | Positive | 2025-07-22 |
| Jefferies | upgrade | Buy | 2025-02-19 |
| Bernstein | downgrade | Market Perform | 2025-02-05 |
| Susquehanna | maintain | Positive | 2025-01-31 |
| Barclays | downgrade | Underweight | 2025-01-22 |
| JP Morgan | downgrade | Neutral | 2024-12-09 |
Qnity Electronics, Inc. Grades
Below are the recent grades for Qnity Electronics, Inc. from well-known grading firms:
| Grading Company | Action | New Grade | Date |
|---|---|---|---|
| RBC Capital | maintain | Outperform | 2025-11-25 |
| Mizuho | maintain | Outperform | 2025-11-20 |
Which company has the best grades?
Qnity Electronics holds consistently high “Outperform” ratings from two firms, indicating strong confidence. STMicroelectronics shows mixed grades with both upgrades and downgrades, reflecting varied analyst sentiment. This divergence suggests differing risk-reward profiles for investors.
Risks specific to each company
The following categories identify the critical pressure points and systemic threats facing both firms in the 2026 market environment:
1. Market & Competition
STMicroelectronics N.V.
- Faces intense competition in diverse semiconductor segments including automotive and industrial markets.
Qnity Electronics, Inc.
- New entrant with limited history, competing in niche electronic materials for chip manufacturing.
2. Capital Structure & Debt
STMicroelectronics N.V.
- Maintains low debt-to-equity (0.12) and strong interest coverage, signaling financial stability.
Qnity Electronics, Inc.
- Also shows very low leverage (0.02 D/E) but interest coverage at 3.21 indicates moderate buffer.
3. Stock Volatility
STMicroelectronics N.V.
- Beta of 1.32 implies higher sensitivity to market swings, increasing volatility risk.
Qnity Electronics, Inc.
- Zero beta suggests minimal correlation with market movements, potentially stable but untested.
4. Regulatory & Legal
STMicroelectronics N.V.
- Operates globally, exposing it to complex regulatory environments in multiple jurisdictions.
Qnity Electronics, Inc.
- Primarily US-based; regulatory risks concentrated but less complex due to narrower footprint.
5. Supply Chain & Operations
STMicroelectronics N.V.
- Broad global supply chain increases exposure to disruptions but benefits from scale.
Qnity Electronics, Inc.
- Smaller scale may limit disruption impact but less diversified supply options.
6. ESG & Climate Transition
STMicroelectronics N.V.
- Established firm likely faces significant ESG scrutiny; transition risks in energy-intensive production.
Qnity Electronics, Inc.
- Newer company with less disclosed ESG footprint; potential risk from future compliance costs.
7. Geopolitical Exposure
STMicroelectronics N.V.
- Exposure across Europe, Americas, Asia-Pacific increases geopolitical risk amid global trade tensions.
Qnity Electronics, Inc.
- Primarily US-focused, limiting geopolitical risks but vulnerable to US-China tech tensions.
Which company shows a better risk-adjusted profile?
Qnity Electronics’ most impactful risk is its early-stage operational and market exposure, with uncertain competitive positioning. STMicroelectronics faces significant geopolitical and competitive pressures but boasts stronger financial stability and global diversification. Qnity’s lower leverage and stable beta support a slightly better risk-adjusted profile despite its nascent status. Notably, STM’s high beta of 1.32 signals greater market volatility risk, justifying caution amid global uncertainties.
Final Verdict: Which stock to choose?
STMicroelectronics N.V. (STM) excels as a cash generator with robust liquidity and a very strong Piotroski score. Its main point of vigilance is a declining profitability trend and value destruction, which signals caution. STM suits investors seeking cyclical exposure with a tolerance for volatility and recovery potential.
Qnity Electronics, Inc. (Q) boasts a strategic moat through stable profitability and efficient capital use, supported by favorable income growth and a solid balance sheet. It offers a safer profile than STM, fitting well within a Growth at a Reasonable Price (GARP) portfolio aimed at steady expansion and risk management.
If you prioritize turnaround potential and can weather profit volatility, STM is compelling for its liquidity and cash strength despite shrinking returns. However, if you seek more stable growth backed by a steady moat and consistent income quality, Q offers better stability and a cleaner growth trajectory, commanding a premium for reduced risk.
Disclaimer: Investment carries a risk of loss of initial capital. The past performance is not a reliable indicator of future results. Be sure to understand risks before making an investment decision.
Go Further
I encourage you to read the complete analyses of STMicroelectronics N.V. and Qnity Electronics, Inc. to enhance your investment decisions: