Home > Comparison > Technology > Q vs SWKS
The strategic rivalry between Qnity Electronics, Inc. and Skyworks Solutions, Inc. shapes the semiconductor industry’s competitive landscape. Qnity operates as a specialized provider of electronic materials for chip manufacturing, while Skyworks offers a broad portfolio of proprietary semiconductor products across multiple applications. This head-to-head highlights a contrast between focused supply-chain innovation and diversified product integration. This analysis will reveal which trajectory delivers superior risk-adjusted returns for a balanced portfolio.
Table of contents
Companies Overview
Qnity Electronics and Skyworks Solutions stand as pivotal players in the semiconductor industry, shaping advanced electronic material innovation and proprietary chip design.
Qnity Electronics, Inc.: Semiconductor Materials Innovator
Qnity Electronics anchors its market identity in supplying semiconductor chip manufacturing materials. Its revenue stems from advanced electronic materials critical to chip production. In 2026, Qnity focuses strategically on scaling its presence post-rebranding, emphasizing innovation in electronic solutions that underpin next-generation semiconductor fabrication.
Skyworks Solutions, Inc.: Diversified Semiconductor Designer
Skyworks Solutions dominates with a broad portfolio of proprietary semiconductor products serving diverse markets from aerospace to mobile devices. The company generates revenue through design, manufacturing, and global sales of high-performance chips and modules. Its 2026 strategy targets expanding market reach by enhancing product integration for wireless and connected technologies.
Strategic Collision: Similarities & Divergences
Both companies compete in semiconductors but diverge sharply: Qnity centers on materials, fostering a specialized supply chain niche; Skyworks pursues a diversified product ecosystem with proprietary chipsets. Their primary battleground lies in controlling value across semiconductor production stages. Investors face distinct profiles—Qnity offers growth tied to material innovation, while Skyworks provides scale and broad market exposure.
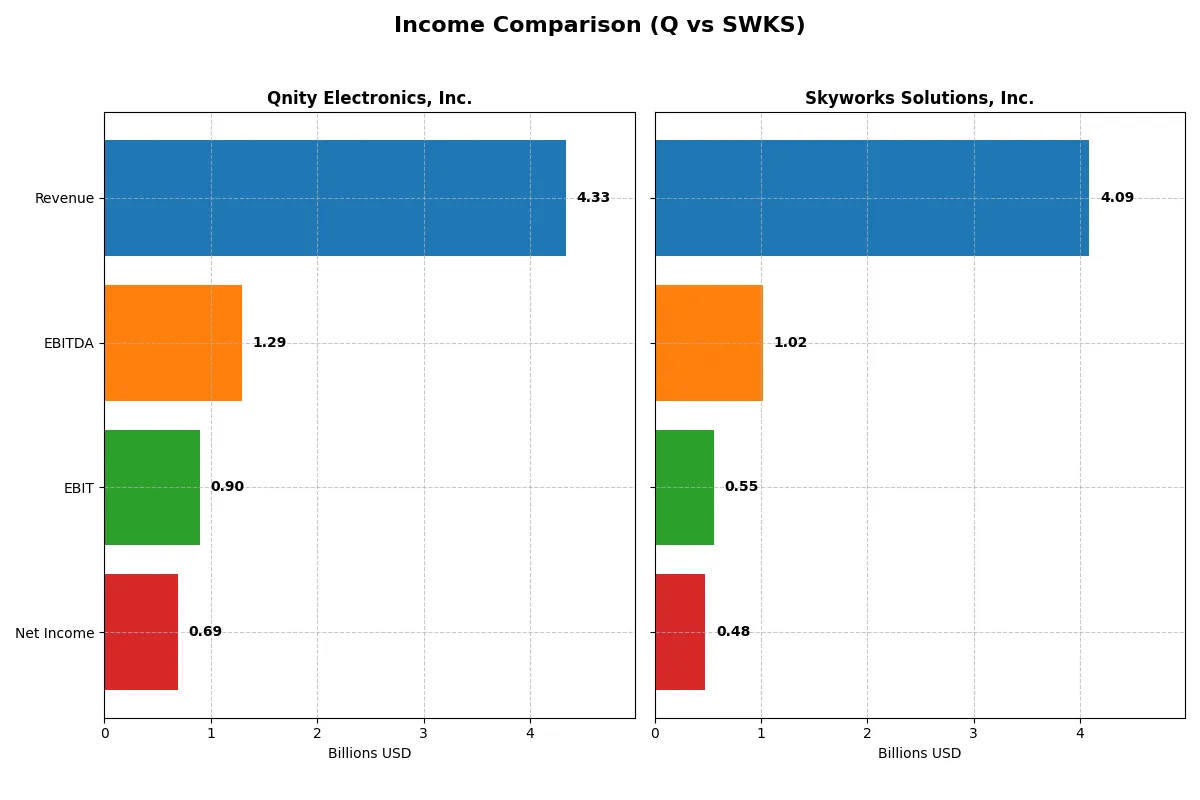
Income Statement Comparison
This data dissects the core profitability and scalability of both corporate engines to reveal who dominates the bottom line:
| Metric | Qnity Electronics, Inc. (Q) | Skyworks Solutions, Inc. (SWKS) |
|---|---|---|
| Revenue | 4.34B | 4.18B |
| Cost of Revenue | 2.34B | 2.46B |
| Operating Expenses | 1.16B | 933M |
| Gross Profit | 2.00B | 1.72B |
| EBITDA | 1.29B | 1.12B |
| EBIT | 898M | 667M |
| Interest Expense | 280M | 31M |
| Net Income | 693M | 596M |
| EPS | 3.31 | 3.72 |
| Fiscal Year | 2024 | 2024 |
Income Statement Analysis: The Bottom-Line Duel
This income statement comparison reveals the true efficiency and profitability trajectories for Qnity Electronics and Skyworks Solutions.
Qnity Electronics, Inc. Analysis
Qnity Electronics shows a mixed revenue trend, peaking at $4.76B in 2022 before declining to $4.34B in 2024. Net income follows a similar pattern, dropping from $774M in 2022 to $693M in 2024 despite a strong 2024 momentum. Gross margins hold favorably at 46.1%, with net margins improving to 16%, signaling resilient cost control and earnings efficiency.
Skyworks Solutions, Inc. Analysis
Skyworks Solutions reports a declining revenue path from $5.49B in 2022 to $4.09B in 2025, paralleled by a steep net income fall from $1.28B to $477M. Margins contract notably, with gross margin at 41.2% and net margin at 11.7%, reflecting operational pressures. Recent years show weakening profitability and margin erosion despite favorable interest expense management.
Margin Strength vs. Revenue Durability
Qnity Electronics outperforms Skyworks in margin quality and recent earnings growth despite a revenue dip. Skyworks suffers steeper declines across revenue, net income, and margins over the longer term. For investors, Qnity’s stable profitability and margin resilience offer a more attractive earnings profile amid sector volatility.
Financial Ratios Comparison
These vital ratios act as a diagnostic tool to expose the underlying fiscal health, valuation premiums, and capital efficiency of the companies compared below:
| Ratios | Qnity Electronics, Inc. (Q) | Skyworks Solutions, Inc. (SWKS) |
|---|---|---|
| ROE | 6.5% | 8.3% |
| ROIC | 5.9% | 6.4% |
| P/E | 28.8 | 24.9 |
| P/B | 1.88 | 2.07 |
| Current Ratio | 1.77 | 2.33 |
| Quick Ratio | 1.06 | 1.76 |
| D/E | 0.018 | 0.209 |
| Debt-to-Assets | 1.6% | 15.2% |
| Interest Coverage | 3.03 | 18.5 |
| Asset Turnover | 0.35 | 0.52 |
| Fixed Asset Turnover | 2.59 | 2.95 |
| Payout ratio | 0% | 91% |
| Dividend yield | 0% | 3.6% |
| Fiscal Year | 2024 | 2025 |
Efficiency & Valuation Duel: The Vital Signs
Financial ratios act as the company’s DNA, revealing hidden risks and operational excellence that shape investor confidence and valuation accuracy.
Qnity Electronics, Inc.
Qnity posts a moderate 6.5% ROE and a solid 16% net margin, yet its 28.8 P/E signals an expensive valuation. The firm maintains a strong current ratio and minimal debt, highlighting operational stability. It does not pay dividends, choosing instead to invest heavily in R&D, supporting long-term growth.
Skyworks Solutions, Inc.
Skyworks delivers a higher 8.3% ROE and an 11.7% net margin with a reasonable 24.95 P/E, indicating fair valuation. Its robust interest coverage and favorable liquidity ratios underline financial strength. Skyworks rewards shareholders with a 3.6% dividend yield, balancing income with ongoing R&D investment.
Premium Valuation vs. Operational Safety
Skyworks offers a better balance of valuation and profitability metrics with lower risk, supported by dividends and strong coverage ratios. Qnity’s high valuation and reinvestment focus suit investors prioritizing growth over immediate income.
Which one offers the Superior Shareholder Reward?
Qnity Electronics (Q) pays no dividends and reinvests all free cash flow into growth initiatives, supported by strong FCF per share of 4.1 and a low debt ratio of 0.02. Skyworks Solutions (SWKS) delivers a 3.6% dividend yield with a 91% payout ratio, signaling limited dividend growth but solid income. SWKS’s buybacks are robust, fueling total returns alongside dividends. Q’s zero payout and moderate buybacks suggest growth focus, but SWKS’s balanced income and buyback strategy offer a more sustainable, attractive total return in 2026. I favor SWKS for superior shareholder reward given its blend of yield, buybacks, and cash flow coverage.
Comparative Score Analysis: The Strategic Profile
The radar chart reveals the fundamental DNA and trade-offs of Qnity Electronics and Skyworks Solutions, highlighting key financial strengths and valuation nuances:
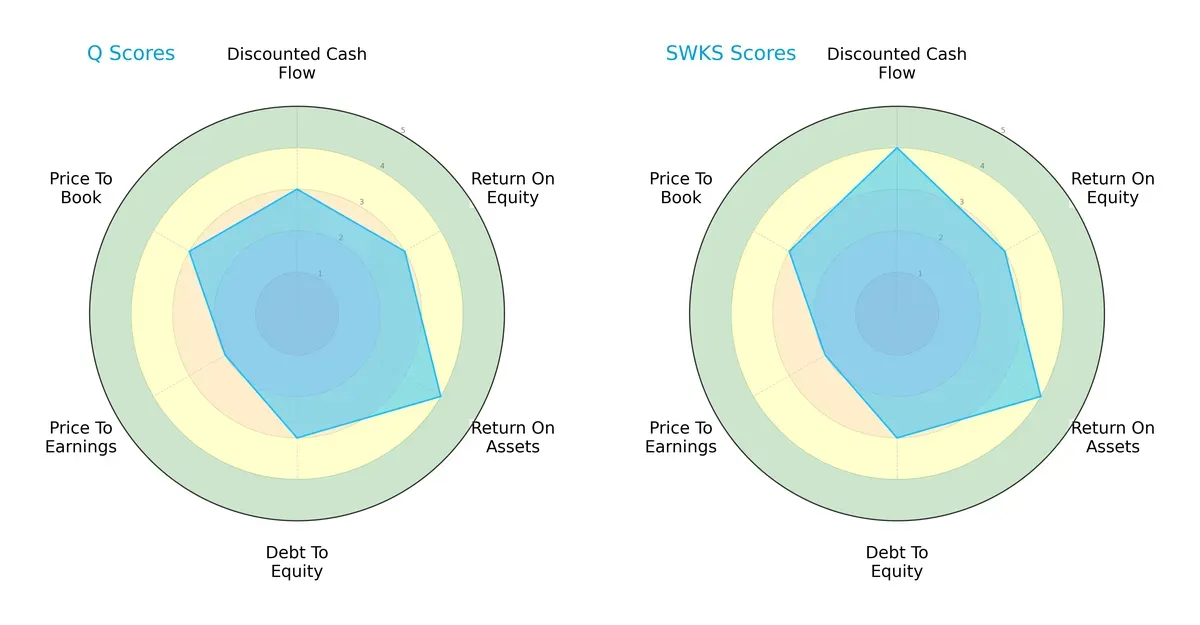
Skyworks edges ahead in discounted cash flow with a favorable 4 versus Qnity’s moderate 3, signaling stronger future cash flow projections. Both share identical moderate scores in return on equity and debt-to-equity, reflecting similar capital efficiency and financial risk profiles. Qnity slightly outperforms in return on assets at 4 versus 4 for Skyworks, but Skyworks maintains a more balanced edge overall, particularly in valuation metrics, with both showing moderate price-to-earnings and price-to-book scores. Skyworks leans on its DCF strength, while Qnity offers a steadier asset utilization profile.
—
Bankruptcy Risk: Solvency Showdown
I do not have Altman Z-Score data for Qnity Electronics, so I must omit this section.
—
Financial Health: Quality of Operations
I do not have Piotroski F-Score data for Qnity Electronics, so I must omit this section.
How are the two companies positioned?
This section dissects Q and SWKS’s operational DNA by comparing their revenue distribution and internal dynamics. The goal is to confront their economic moats to identify which model offers the most resilient competitive advantage today.
Strengths and Weaknesses Comparison
This table compares the Strengths and Weaknesses of Qnity Electronics (Q) and Skyworks Solutions (SWKS):
Q Strengths
- Strong net margin at 15.99%
- Low debt with debt-to-assets at 1.56%
- Favorable liquidity ratios: current 1.77, quick 1.06
- WACC below ROIC at 5.83%
- Low leverage with debt-to-equity 0.02
SWKS Strengths
- Favorable net margin at 11.67%
- Strong liquidity with current ratio 2.33 and quick ratio 1.76
- Solid interest coverage at 20.44
- Dividend yield at 3.63% supports income investors
- Global presence with multi-region revenue, especially US and Asia
Q Weaknesses
- Low ROE at 6.51% despite favorable net margin
- PE ratio high at 28.8, possibly indicating overvaluation
- Asset turnover weak at 0.35
- No dividend yield offered
- Moderate interest coverage at 3.21
SWKS Weaknesses
- ROE low at 8.29% limits equity returns
- WACC at 9.28% slightly erodes capital efficiency
- PE ratio moderate at 24.95
- Asset turnover neutral at 0.52
- Heavy US revenue dependence may risk geographic concentration
Q demonstrates strong profitability and conservative leverage but struggles with capital efficiency and shareholder returns. SWKS excels in liquidity and global reach, delivering dividends and solid coverage, yet faces moderate returns on equity and geographic concentration risk. Both companies exhibit slightly favorable financial profiles but differ in capital allocation and market exposure strategies.
The Moat Duel: Analyzing Competitive Defensibility
A structural moat is the only barrier protecting long-term profits from relentless competition and market pressures. Let’s dissect the moats of Qnity Electronics and Skyworks Solutions:
Qnity Electronics, Inc.: Intangible Assets Anchoring Stability
Qnity’s moat stems primarily from proprietary electronic materials critical in semiconductor manufacturing. This intangible asset yields stable margins near 20% EBIT and a solid 16% net margin. However, its ROIC barely exceeds WACC, signaling no strong value creation yet. Expansion into advanced materials markets could deepen its moat in 2026.
Skyworks Solutions, Inc.: Legacy Scale Meets Cost Pressure
Skyworks relies on scale and product breadth, a cost advantage contrasting Qnity’s niche focus. Yet, its declining ROIC and shrinking margins reveal eroding profitability. Skyworks’ vast global footprint offers potential for recovery, but ongoing market disruptions and profitability losses threaten its competitive edge.
Verdict: Intangible Assets vs. Scale Under Strain
Qnity holds a deeper moat through unique intangible assets sustaining margin stability despite no ROIC premium. Skyworks suffers from a shrinking moat as scale fails to offset profit erosion. I see Qnity better positioned to defend market share amid intensifying semiconductor competition.
Which stock offers better returns?
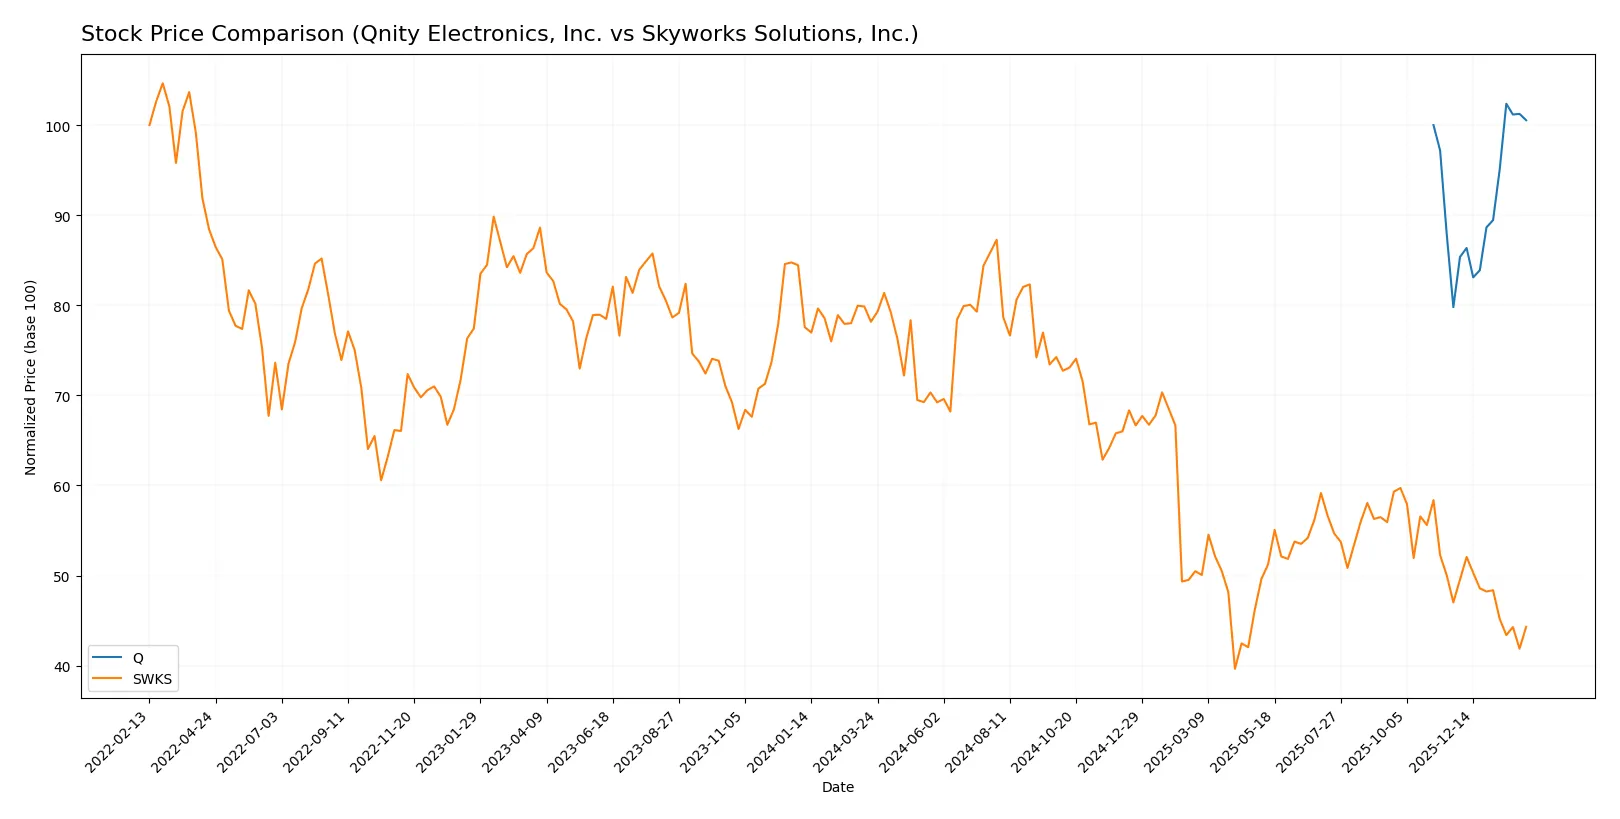
Over the past year, Qnity Electronics, Inc. showed mild overall gains with recent acceleration, while Skyworks Solutions, Inc. faced a pronounced decline and decelerating losses.
Trend Comparison
Qnity Electronics, Inc. recorded a 0.54% overall price increase over 12 months, reflecting a bullish trend with accelerating momentum and a recent 26.0% surge.
Skyworks Solutions, Inc. experienced a -43.31% drop over the same period, marking a bearish trend with decelerating declines and a recent -5.77% downturn.
Qnity Electronics, Inc. clearly outperformed Skyworks Solutions, Inc., delivering the highest market return during the analyzed timeframe.
Target Prices
Analysts present mixed but insightful target price ranges for Qnity Electronics and Skyworks Solutions.
| Company | Target Low | Target High | Consensus |
|---|---|---|---|
| Qnity Electronics, Inc. | 92 | 118 | 106.78 |
| Skyworks Solutions, Inc. | 58 | 140 | 77.36 |
Qnity’s consensus target at 106.78 exceeds its current 95.51 price, signaling moderate upside potential. Skyworks shows a wide range and consensus price well above today’s 59, indicating bullish analyst expectations despite volatility.
How do institutions grade them?
Here is a comparison of recent institutional grades for Qnity Electronics, Inc. and Skyworks Solutions, Inc.:
Qnity Electronics, Inc. Grades
The following table summarizes recent grades from notable institutions for Qnity Electronics:
| Grading Company | Action | New Grade | Date |
|---|---|---|---|
| RBC Capital | Maintain | Outperform | 2025-11-25 |
| Mizuho | Maintain | Outperform | 2025-11-20 |
Skyworks Solutions, Inc. Grades
The table below lists the latest institutional grades for Skyworks Solutions:
| Grading Company | Action | New Grade | Date |
|---|---|---|---|
| Keybanc | Maintain | Overweight | 2026-02-04 |
| JP Morgan | Maintain | Neutral | 2026-02-04 |
| Benchmark | Maintain | Hold | 2026-02-04 |
| Stifel | Maintain | Hold | 2026-02-04 |
| Citigroup | Maintain | Neutral | 2026-02-04 |
| Morgan Stanley | Maintain | Equal Weight | 2026-02-02 |
| B. Riley Securities | Maintain | Neutral | 2026-01-26 |
| Mizuho | Maintain | Neutral | 2026-01-26 |
| Susquehanna | Maintain | Neutral | 2026-01-22 |
| UBS | Maintain | Neutral | 2026-01-20 |
Which company has the best grades?
Qnity Electronics holds consistently stronger grades, rated “Outperform” by RBC Capital and Mizuho. Skyworks shows mixed ratings centered on “Neutral” and “Hold.” This divergence may influence investor confidence and portfolio weighting decisions.

Don’t Let Luck Decide Your Entry Point
Optimize your entry points with our advanced ProRealTime indicators. You’ll get efficient buy signals with precise price targets for maximum performance. Start outperforming now!
Risks specific to each company
The following categories identify the critical pressure points and systemic threats facing both firms in the 2026 market environment:
1. Market & Competition
Qnity Electronics, Inc.
- Newly public since late 2025, faces intense semiconductor sector rivalry with limited track record.
Skyworks Solutions, Inc.
- Established since 1984, competes globally with diversified product lines but faces high market beta risks.
2. Capital Structure & Debt
Qnity Electronics, Inc.
- Extremely low debt levels (D/E 0.02), signaling conservative leverage and financial stability.
Skyworks Solutions, Inc.
- Moderate leverage (D/E 0.21) but strong interest coverage (20.44), indicating manageable debt risk.
3. Stock Volatility
Qnity Electronics, Inc.
- Beta of 0 suggests very low volatility, unusual for tech sector, possibly reflecting limited trading history.
Skyworks Solutions, Inc.
- Beta of 1.317 indicates above-market volatility, raising risk for risk-averse investors.
4. Regulatory & Legal
Qnity Electronics, Inc.
- Newly renamed entity may face transitional regulatory scrutiny.
Skyworks Solutions, Inc.
- Operates in multiple global jurisdictions, increasing exposure to complex regulatory risks.
5. Supply Chain & Operations
Qnity Electronics, Inc.
- Focus on advanced semiconductor materials, potentially vulnerable to raw material supply shocks.
Skyworks Solutions, Inc.
- Broad product portfolio mitigates supply chain risks but complexity can increase operational challenges.
6. ESG & Climate Transition
Qnity Electronics, Inc.
- No explicit data; as a new firm, ESG practices are unestablished and may lag peers.
Skyworks Solutions, Inc.
- Larger firm likely subject to stricter ESG scrutiny; no explicit data but must manage transition risks.
7. Geopolitical Exposure
Qnity Electronics, Inc.
- US-based with limited global footprint, possibly less geopolitical risk but also less market diversification.
Skyworks Solutions, Inc.
- Global operations including Asia-Pacific expose it to geopolitical tensions and supply chain disruptions.
Which company shows a better risk-adjusted profile?
Qnity Electronics faces its greatest risk from market entry and operational infancy in a highly competitive sector. Skyworks Solutions contends primarily with geopolitical and volatility risks due to its global scale and higher beta. Despite Skyworks’ higher leverage and volatility, its strong interest coverage and diversified operations present a more tested risk management framework. I find Skyworks offers a better risk-adjusted profile due to its maturity, scale, and financial robustness. The unusually low beta for Qnity raises red flags about market liquidity and investor confidence, spotlighting its vulnerability in turbulent cycles.
Final Verdict: Which stock to choose?
Qnity Electronics, Inc. (Q) stands out as a cash-efficient operator with solid free cash flow generation and a stable profitability profile. Its main point of vigilance is a modest return on equity, which suggests it might struggle to deliver outsized shareholder returns. Q suits portfolios targeting steady, capital-efficient growth with moderate risk tolerance.
Skyworks Solutions, Inc. (SWKS) boasts a strategic moat rooted in its recurring revenue streams and strong R&D investment, supporting innovation leadership. Relative to Q, SWKS presents a safer liquidity position and a higher dividend yield, though its declining ROIC trend signals caution. It fits well within portfolios seeking growth at a reasonable price combined with income stability.
If you prioritize capital efficiency and consistent free cash flow, Qnity Electronics offers a compelling scenario due to its disciplined capital allocation and stable margins. However, if you seek a blend of innovation-driven moat and safer financial footing, Skyworks provides better stability despite recent profitability headwinds. Both require careful monitoring of their respective risks.
Disclaimer: Investment carries a risk of loss of initial capital. The past performance is not a reliable indicator of future results. Be sure to understand risks before making an investment decision.
Go Further
I encourage you to read the complete analyses of Qnity Electronics, Inc. and Skyworks Solutions, Inc. to enhance your investment decisions: