In the fast-evolving semiconductor sector, Qnity Electronics, Inc. and Silicon Laboratories Inc. stand out as innovative players driving technological progress. Both firms operate within the semiconductor industry, focusing on cutting-edge electronic solutions and mixed-signal technologies, respectively. Their market overlap and distinct innovation strategies make them compelling subjects for comparison. Join me as we explore which company presents the most attractive investment opportunity in 2026.
Table of contents
Companies Overview
I will begin the comparison between Qnity Electronics, Inc. and Silicon Laboratories Inc. by providing an overview of these two companies and their main differences.
Qnity Electronics, Inc. Overview
Qnity Electronics, Inc. specializes in electronic solutions and materials essential for semiconductor chip manufacturing and advanced electronic materials. The company, formerly known as Novus SpinCo 1, Inc. until April 2025, is positioned in the technology sector within the semiconductor industry. It is headquartered in Wilmington, Delaware, and trades on the New York Stock Exchange with a market capitalization of approximately 19.5B USD.
Silicon Laboratories Inc. Overview
Silicon Laboratories Inc. operates as a fabless semiconductor company providing analog-intensive mixed-signal solutions worldwide, including wireless microcontrollers and sensor products. Its applications span IoT devices such as connected homes, industrial automation, and medical instrumentation. Founded in 1996 and based in Austin, Texas, Silicon Labs is listed on NASDAQ with a market cap near 5B USD and employs around 1,889 full-time staff.
Key similarities and differences
Both Qnity Electronics and Silicon Laboratories operate in the semiconductor industry within the technology sector, focusing on electronic components. However, Qnity emphasizes electronic materials for chip manufacturing, whereas Silicon Labs develops mixed-signal semiconductor products for IoT applications. Qnity is a newer public company with a larger market cap, while Silicon Labs has a longer history, a diverse product portfolio, and notable international presence.
Income Statement Comparison
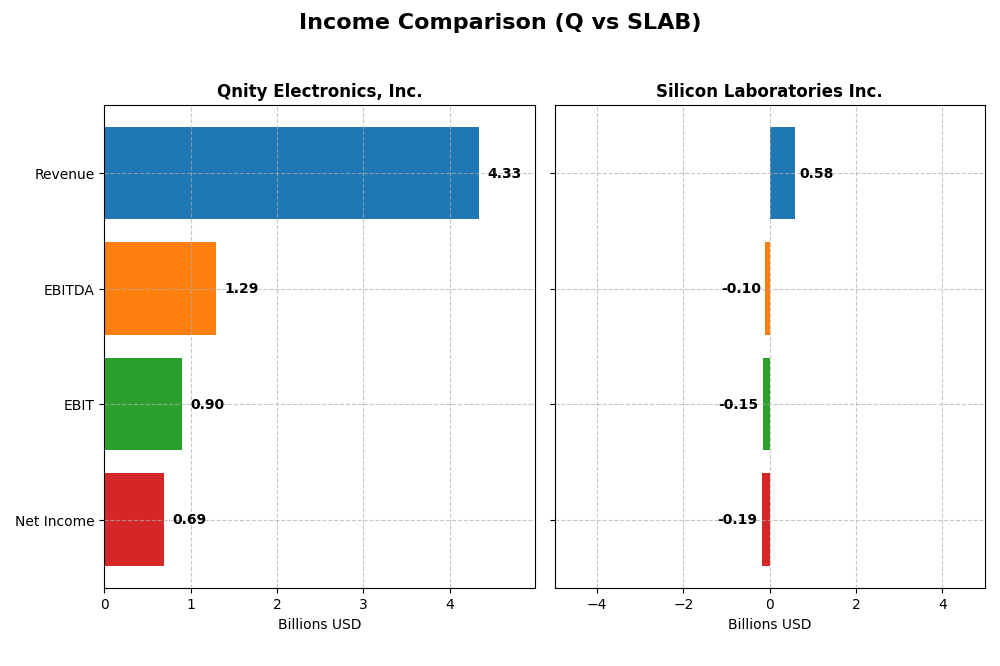
This table presents a side-by-side comparison of key income statement metrics for Qnity Electronics, Inc. and Silicon Laboratories Inc. for the fiscal year 2024.
| Metric | Qnity Electronics, Inc. | Silicon Laboratories Inc. |
|---|---|---|
| Market Cap | 19.5B | 5.0B |
| Revenue | 4.34B | 584M |
| EBITDA | 1.29B | -105M |
| EBIT | 898M | -154M |
| Net Income | 693M | -191M |
| EPS | 3.31 | -5.93 |
| Fiscal Year | 2024 | 2024 |
Income Statement Interpretations
Qnity Electronics, Inc.
Qnity Electronics showed a declining revenue trend from 4.76B in 2022 to 4.34B in 2024, with net income falling from 774M to 693M over the same period. Margins remained generally stable, with a gross margin around 46% and a favorable net margin near 16%. The latest year saw moderate revenue growth (+7.4%) and significant margin improvements, signaling operational efficiency gains.
Silicon Laboratories Inc.
Silicon Laboratories experienced revenue decline from 1.02B in 2022 to 584M in 2024, with net income turning negative at -191M in 2024 from 91M in 2022. The gross margin stayed strong at 53%, but EBIT and net margins were negative, reflecting operational losses. The most recent year marked substantial deterioration in profitability and margins, alongside a steep revenue drop (-25.3%).
Which one has the stronger fundamentals?
Qnity Electronics displays stronger fundamentals with consistent profitability, positive margin trends, and improving earnings per share despite slight revenue contraction. Conversely, Silicon Laboratories faces unfavorable income statement metrics, including negative EBIT and net margins, and worsening profitability over recent years. The contrast highlights Qnity’s more favorable financial health and earnings quality.
Financial Ratios Comparison
The following table compares key financial ratios for Qnity Electronics, Inc. and Silicon Laboratories Inc. based on their most recent fiscal year data for 2024.
| Ratios | Qnity Electronics, Inc. (Q) | Silicon Laboratories Inc. (SLAB) |
|---|---|---|
| ROE | 6.51% | -17.69% |
| ROIC | 5.92% | -14.71% |
| P/E | 28.8 | -21.53 |
| P/B | 1.88 | 3.81 |
| Current Ratio | 1.77 | 6.15 |
| Quick Ratio | 1.06 | 5.07 |
| D/E | 0.018 | 0.014 |
| Debt-to-Assets | 1.56% | 1.27% |
| Interest Coverage | 3.03 | -126.33 |
| Asset Turnover | 0.35 | 0.48 |
| Fixed Asset Turnover | 2.59 | 4.42 |
| Payout ratio | 0% | 0% |
| Dividend yield | 0% | 0% |
Interpretation of the Ratios
Qnity Electronics, Inc.
Qnity Electronics exhibits a slightly favorable overall ratio profile with strengths in net margin (15.99%), current and quick ratios, and low debt levels, indicating sound liquidity and conservative leverage. However, concerns arise from its modest return on equity (6.51%) and asset turnover. The company pays a small dividend, but no yield is reported, suggesting limited shareholder returns or a focus on reinvestment.
Silicon Laboratories Inc.
Silicon Laboratories shows predominantly unfavorable ratios, highlighted by negative net margin (-32.69%), return on equity (-17.69%), and return on invested capital (-14.71%), reflecting operational challenges. While it maintains a strong quick ratio and low debt, the negative interest coverage signals risk. The company does not pay dividends, likely prioritizing growth, R&D, and acquisitions over distributions.
Which one has the best ratios?
Based on the ratio evaluations, Qnity Electronics appears to have a stronger financial profile with more favorable liquidity, profitability, and leverage metrics. Silicon Laboratories, conversely, faces significant profitability and operational challenges despite some liquidity strengths, resulting in an overall unfavorable ratios assessment.
Strategic Positioning
This section compares the strategic positioning of Qnity Electronics, Inc. and Silicon Laboratories Inc., focusing on Market position, Key segments, and exposure to disruption:
Qnity Electronics, Inc.
- Large market cap at 19.5B, stable profitability, low beta, listed on NYSE.
- Focus on electronic solutions and materials for semiconductor chip manufacturing.
- No explicit data on disruption exposure; stable with neutral moat status.
Silicon Laboratories Inc.
- Smaller market cap at 5B, higher beta 1.54, listed on NASDAQ Global Select.
- Diverse analog mixed-signal solutions, strong IoT segment across multiple applications.
- Faces technological challenges with declining ROIC, indicating value destruction.
Qnity Electronics, Inc. vs Silicon Laboratories Inc. Positioning
Qnity Electronics has a concentrated focus on semiconductor materials with a larger market cap and stable profitability. Silicon Laboratories operates a diversified product range in IoT and analog solutions but shows declining profitability and higher market volatility, implying increased risk.
Which has the best competitive advantage?
Qnity Electronics holds a neutral moat with stable profitability, while Silicon Laboratories has a very unfavorable moat and declining returns, indicating Qnity currently demonstrates a stronger competitive position based on MOAT evaluation.
Stock Comparison
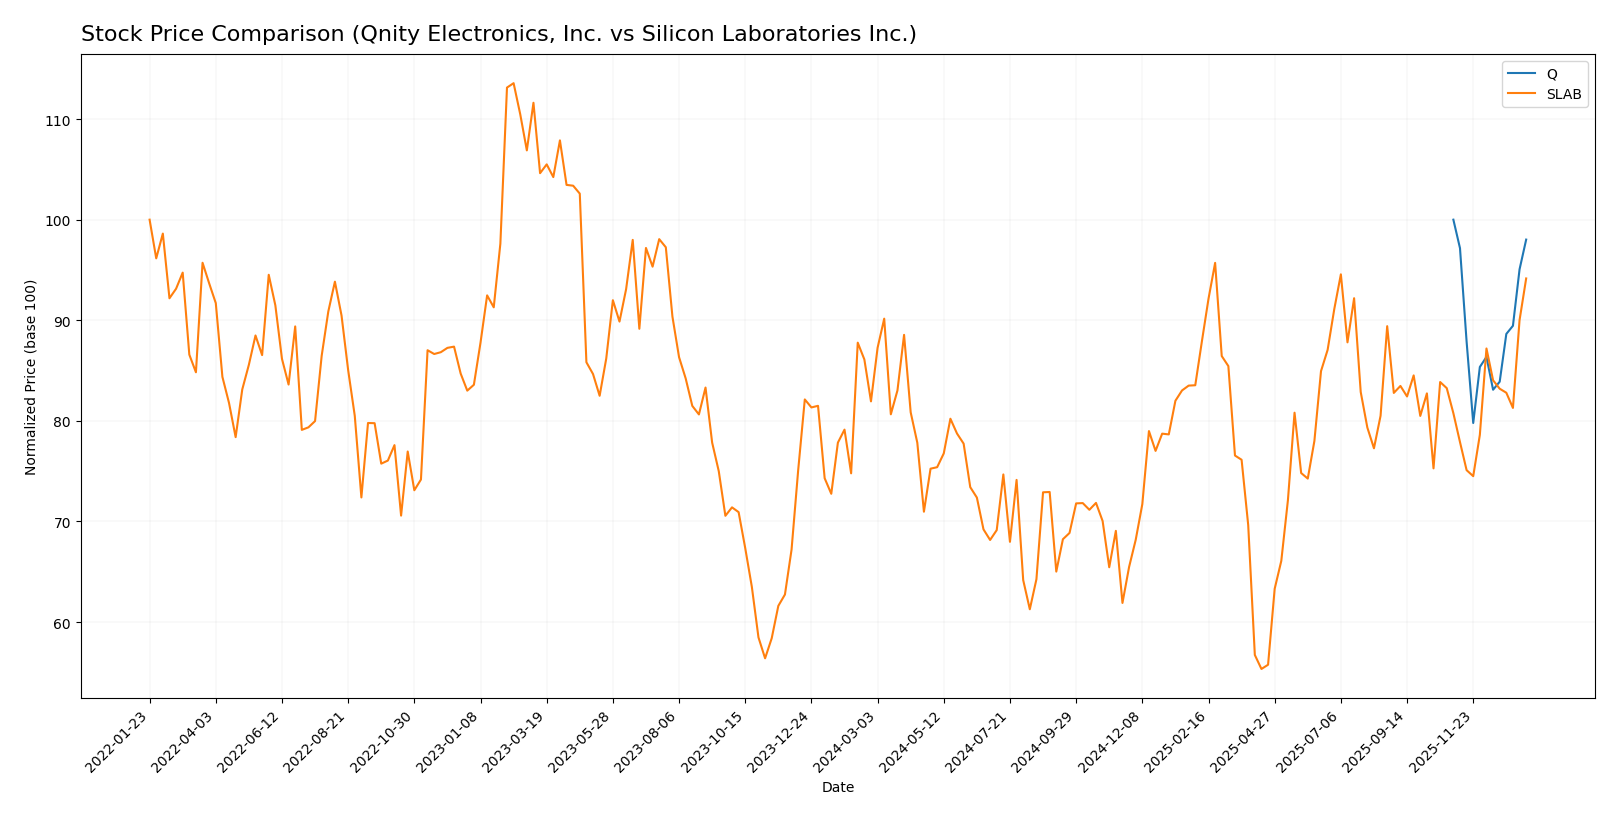
The stock price performance over the past 12 months shows distinct trajectories for Qnity Electronics, Inc. and Silicon Laboratories Inc., with Qnity Electronics experiencing a slight decline and Silicon Laboratories demonstrating strong gains and accelerating upward momentum.
Trend Analysis
Qnity Electronics, Inc. (Q) recorded a -1.98% price change over the past year, indicating a neutral to slightly bearish trend with stable acceleration and price fluctuations between 75.8 and 95.0. Silicon Laboratories Inc. (SLAB) showed a bullish trend with a 14.91% increase, accelerating upward and a wider price range from 89.82 to 155.33. Comparing both, Silicon Laboratories delivered the highest market performance with robust growth and accelerating trend dynamics.
Target Prices
Analysts present a favorable target consensus for Qnity Electronics, Inc. and Silicon Laboratories Inc. based on recent evaluations.
| Company | Target High | Target Low | Consensus |
|---|---|---|---|
| Qnity Electronics, Inc. | 117 | 92 | 105.89 |
| Silicon Laboratories Inc. | 165 | 130 | 151.67 |
The consensus targets suggest upside potential for both stocks compared to current prices of $93.12 for Qnity Electronics and $152.82 for Silicon Laboratories, indicating optimistic analyst expectations within the semiconductor sector.
Analyst Opinions Comparison
This section compares analysts’ ratings and grades for Qnity Electronics, Inc. (Q) and Silicon Laboratories Inc. (SLAB):
Rating Comparison
Q Rating
- Rating: B+ indicating a very favorable overall assessment.
- Discounted Cash Flow Score: 4, showing a favorable outlook on future cash flow projections.
- ROE Score: 3, a moderate measure of profit generation efficiency from equity.
- ROA Score: 4, favorable use of assets to generate earnings.
- Debt To Equity Score: 3, a moderate rating reflecting balanced financial risk.
- Overall Score: 3, a moderate summary of financial health.
SLAB Rating
- Rating: C- reflecting a very unfavorable overall assessment.
- Discounted Cash Flow Score: 2, indicating a moderate view on future cash flow projections.
- ROE Score: 1, a very unfavorable indication of profit generation efficiency from equity.
- ROA Score: 1, very unfavorable effectiveness in asset utilization for earnings.
- Debt To Equity Score: 1, very unfavorable, indicating higher financial risk from debt levels.
- Overall Score: 1, very unfavorable overall financial standing.
Which one is the best rated?
Qnity Electronics (Q) is better rated overall with a B+ and moderate to favorable scores across key metrics, while Silicon Laboratories (SLAB) shows a much weaker profile with a C- rating and predominantly very unfavorable scores.
Scores Comparison
Here is a comparison of the available company scores for investors to consider:
Q Scores
- Altman Z-Score: Not available
- Piotroski Score: Not available
SLAB Scores
- Altman Z-Score: 18.02, indicating a safe zone
- Piotroski Score: 4, representing an average level
Which company has the best scores?
Based on the provided data, only SLAB has available scores, showing a very strong Altman Z-Score and an average Piotroski Score. Q’s scores are not provided, so no direct comparison can be made.
Grades Comparison
Here is a comparison of the latest reliable grades for Qnity Electronics, Inc. and Silicon Laboratories Inc.:
Qnity Electronics, Inc. Grades
The following table summarizes recent grades from recognized financial institutions for Qnity Electronics, Inc.:
| Grading Company | Action | New Grade | Date |
|---|---|---|---|
| RBC Capital | Maintain | Outperform | 2025-11-25 |
| Mizuho | Maintain | Outperform | 2025-11-20 |
Qnity Electronics consistently received “Outperform” grades, indicating a positive outlook from these analysts.
Silicon Laboratories Inc. Grades
This table presents the recent grades issued by verified grading companies for Silicon Laboratories Inc.:
| Grading Company | Action | New Grade | Date |
|---|---|---|---|
| Morgan Stanley | Maintain | Equal Weight | 2025-08-06 |
| Susquehanna | Maintain | Neutral | 2025-08-06 |
| Barclays | Maintain | Equal Weight | 2025-08-05 |
| Susquehanna | Maintain | Neutral | 2025-07-22 |
| Stifel | Maintain | Buy | 2025-07-18 |
| Keybanc | Maintain | Overweight | 2025-07-08 |
| Benchmark | Maintain | Buy | 2025-05-27 |
| Benchmark | Maintain | Buy | 2025-05-14 |
| Susquehanna | Maintain | Neutral | 2025-05-14 |
| Needham | Maintain | Buy | 2025-05-14 |
Silicon Laboratories Inc. shows a mixed but generally positive rating spectrum, including several “Buy” and “Overweight” grades alongside “Neutral” assessments.
Which company has the best grades?
Both companies hold a consensus “Buy” rating, but Qnity Electronics has a more uniform “Outperform” grade from fewer but highly positive sources, while Silicon Laboratories exhibits a wider range of ratings from “Neutral” to “Buy.” This variation may imply different risk-return profiles and investor sentiment for each stock.
Strengths and Weaknesses
Below is a comparative overview of key strengths and weaknesses for Qnity Electronics, Inc. (Q) and Silicon Laboratories Inc. (SLAB) based on the most recent financial and operational data.
| Criterion | Qnity Electronics, Inc. (Q) | Silicon Laboratories Inc. (SLAB) |
|---|---|---|
| Diversification | Moderate product focus; lacks detailed segment data | Primarily Industrial & Commercial segment; declining revenue trend |
| Profitability | Net margin 16% (favorable); ROIC 5.9% (neutral); stable profitability | Negative net margin (-33%), ROIC -14.7%; value destroying |
| Innovation | Neutral ROIC trend; stable but no strong growth in returns | Declining ROIC trend; innovation impact questionable |
| Global presence | Solid current and quick ratios; low debt, stable financials | Strong liquidity but unfavorable interest coverage; financial stress noted |
| Market Share | Moderate asset turnover (0.35, unfavorable); PE 28.8 (unfavorable) | Asset turnover 0.48 (unfavorable); PE negative but low debt |
Key takeaways: Qnity Electronics shows stable profitability and solid financial health but lacks strong growth momentum or competitive moat. Silicon Laboratories faces significant profitability and value erosion issues with declining returns and weakening operational metrics, indicating higher investment risk.
Risk Analysis
Below is a comparison of key risks for Qnity Electronics, Inc. (Q) and Silicon Laboratories Inc. (SLAB) as of 2026:
| Metric | Qnity Electronics, Inc. (Q) | Silicon Laboratories Inc. (SLAB) |
|---|---|---|
| Market Risk | Low beta (0), stable price range | Higher beta (1.545), more volatile |
| Debt Level | Very low debt (D/E 0.02) | Very low debt (D/E 0.01) |
| Regulatory Risk | Moderate, US-based semiconductor | Moderate, global exposure including China |
| Operational Risk | New company (IPO late 2025), scaling risks | Established with diversified IoT products |
| Environmental Risk | Standard semiconductor manufacturing risks | Same sector risks with additional IoT device impact |
| Geopolitical Risk | Primarily US operations | Exposure to China and global markets |
The most significant risks are market volatility and operational challenges. SLAB’s higher beta indicates greater sensitivity to market swings, while Q’s recent IPO status brings scaling and execution risks. Geopolitical exposure is moderate for both, with SLAB more affected by China-related tensions. Debt levels are minimal, reducing financial risk. Investors should weigh Q’s growth potential against SLAB’s operational complexity and recent financial underperformance.
Which Stock to Choose?
Qnity Electronics, Inc. shows a favorable income statement with strong gross and EBIT margins and positive net margin growth despite a slight overall revenue decline. Financial ratios are slightly favorable, highlighting low debt and good liquidity, though return on equity is modest. The company’s rating is very favorable with a stable moat indicating neutral value creation.
Silicon Laboratories Inc. presents an unfavorable income profile marked by negative margins and declining profitability over recent years. Its financial ratios largely appear unfavorable, despite a low debt load and strong quick ratio. The rating is very unfavorable, and the firm shows a very unfavorable moat with decreasing return on invested capital.
For investors, Qnity Electronics might appear more suitable for those prioritizing stable profitability and moderate risk, while Silicon Laboratories could be viewed as a higher-risk option potentially appealing to those with a tolerance for volatility and seeking turnaround opportunities. The contrasting ratings and financial health suggest careful consideration aligned to individual risk profiles and investment strategies.
Disclaimer: Investment carries a risk of loss of initial capital. The past performance is not a reliable indicator of future results. Be sure to understand risks before making an investment decision.
Go Further
I encourage you to read the complete analyses of Qnity Electronics, Inc. and Silicon Laboratories Inc. to enhance your investment decisions: