In the fast-evolving semiconductor industry, Qnity Electronics, Inc. and indie Semiconductor, Inc. stand out for their innovative approaches and market focus. Qnity specializes in advanced electronic materials for chip manufacturing, while indie Semiconductor targets automotive semiconductors and connected car technologies. Both companies compete in technology-driven niches, making this comparison essential. Join me as we analyze which company offers the most promising investment opportunity in 2026.

Table of contents
Companies Overview
I will begin the comparison between Qnity Electronics, Inc. and indie Semiconductor, Inc. by providing an overview of these two companies and their main differences.
Qnity Electronics, Inc. Overview
Qnity Electronics, Inc. focuses on providing electronic solutions and materials used in semiconductor chip manufacturing and advanced electronic materials. Previously known as Novus SpinCo 1, Inc., the company rebranded in April 2025. It is a key player in the semiconductor industry, operating from Wilmington, Delaware, and listed on the NYSE with a market capitalization of approximately 19.5B USD.
indie Semiconductor, Inc. Overview
indie Semiconductor, Inc. specializes in automotive semiconductors and software solutions targeting advanced driver assistance, connected cars, and electrification applications. Founded in 2007, it serves multiple automotive applications including parking assistance and infotainment. Headquartered in Aliso Viejo, California, indie Semiconductor trades on NASDAQ and has a market cap near 857M USD with about 920 employees.
Key similarities and differences
Both companies operate in the semiconductor sector within the technology industry, focusing on specialized electronic components. Qnity concentrates on semiconductor materials and chip manufacturing solutions, whereas indie Semiconductor targets automotive semiconductors and related software for vehicle applications. Qnity is significantly larger by market cap and recently rebranded, while indie has a longer market presence and a higher employee count, reflecting their distinct market approaches and scale.
Income Statement Comparison
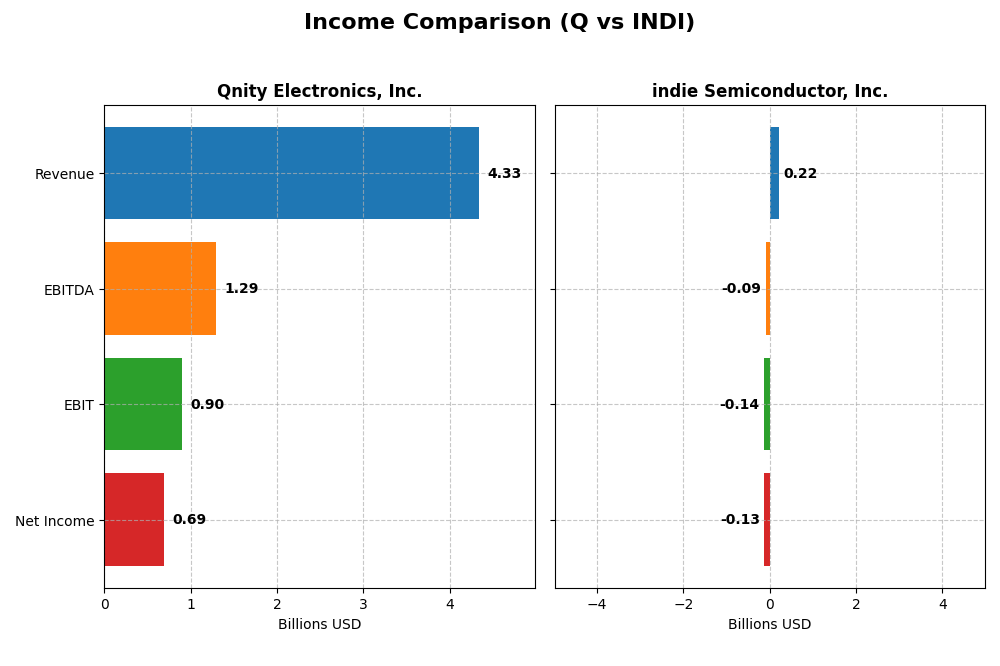
This table provides a side-by-side comparison of key income statement metrics for Qnity Electronics, Inc. and indie Semiconductor, Inc. for the fiscal year 2024.
| Metric | Qnity Electronics, Inc. | indie Semiconductor, Inc. |
|---|---|---|
| Market Cap | 19.5B | 857M |
| Revenue | 4.34B | 217M |
| EBITDA | 1.29B | -94M |
| EBIT | 898M | -137M |
| Net Income | 693M | -133M |
| EPS | 3.31 | -0.76 |
| Fiscal Year | 2024 | 2024 |
Income Statement Interpretations
Qnity Electronics, Inc.
Qnity Electronics saw a decline in revenue and net income over the 2022-2024 period, with revenue falling by 8.83% and net income by 10.47%. Margins remained mostly stable, with a favorable gross margin of 46.11% and a net margin of 15.99% in 2024. The latest year showed moderate revenue growth of 7.43%, alongside strong improvements in gross profit and EBIT margins.
indie Semiconductor, Inc.
indie Semiconductor experienced significant revenue growth overall but posted net losses through 2024, reflecting ongoing challenges in profitability. Gross margin improved to a favorable 41.68%, yet EBIT and net margins were negative, at -63.22% and -61.2%, respectively. The most recent year showed a slight revenue decline of 2.91% and a worsening net margin, despite favorable EPS growth of 6.17%.
Which one has the stronger fundamentals?
Qnity Electronics demonstrates stronger fundamentals with consistent profitability, favorable margins, and positive growth in key income measures over the short term. indie Semiconductor shows promising gross margin improvements and revenue growth long term but struggles with persistent losses and negative net margins. Overall, Qnity’s income statement presents a more favorable and stable financial profile.
Financial Ratios Comparison
The table below presents a side-by-side comparison of key financial ratios for Qnity Electronics, Inc. (Q) and indie Semiconductor, Inc. (INDI) based on their most recent fiscal year data (2024).
| Ratios | Qnity Electronics, Inc. (Q) | indie Semiconductor, Inc. (INDI) |
|---|---|---|
| ROE | 6.51% | -31.73% |
| ROIC | 5.92% | -19.25% |
| P/E | 28.8 | -5.35 |
| P/B | 1.88 | 1.70 |
| Current Ratio | 1.77 | 4.82 |
| Quick Ratio | 1.06 | 4.23 |
| D/E (Debt-to-Equity) | 0.018 | 0.95 |
| Debt-to-Assets | 1.56% | 42.34% |
| Interest Coverage | 3.03 | -18.37 |
| Asset Turnover | 0.35 | 0.23 |
| Fixed Asset Turnover | 2.59 | 4.30 |
| Payout Ratio | 0 | 0 |
| Dividend Yield | 0 | 0 |
Interpretation of the Ratios
Qnity Electronics, Inc.
Qnity Electronics shows a slightly favorable ratio profile with strengths in net margin (15.99%), current and quick ratios, and low debt levels. However, concerns include a moderate return on equity (6.51%) and price-to-earnings ratio of 28.8, which are unfavorable. The company pays a small dividend with a 0.06 last payout, but the dividend yield remains negligible, suggesting limited shareholder returns via dividends.
indie Semiconductor, Inc.
indie Semiconductor presents mostly unfavorable ratios, including a negative net margin (-61.2%) and deeply negative returns on equity (-31.7%) and invested capital. While the quick ratio is strong at 4.23, other liquidity and profitability metrics are weak. The company does not pay dividends, reflecting its high investment in R&D and a potential growth-focused strategy amid ongoing losses.
Which one has the best ratios?
Qnity Electronics maintains a more balanced and slightly favorable ratio set compared to indie Semiconductor, which faces significant profitability and liquidity challenges. Qnity’s low leverage and reasonable current ratios contrast with indie’s unfavorable profitability and high volatility, placing Qnity ahead in terms of financial ratio health in 2024.
Strategic Positioning
This section compares the strategic positioning of Qnity Electronics, Inc. (Q) and indie Semiconductor, Inc. (INDI) based on Market position, Key segments, and Exposure to technological disruption:
Q
- Large market cap of $19.5B, operating in semiconductors with stable profitability and no beta risk.
- Focused on electronic solutions and materials for semiconductor chip manufacturing and advanced materials.
- Positioned in semiconductor materials with limited direct exposure to rapid technological disruption.
INDI
- Smaller market cap of $857M, higher beta of 2.54, facing more volatile competitive pressure in automotive semis.
- Concentrated on automotive semiconductors and software for ADAS, connectivity, electrification, and photonics.
- Exposed to fast-evolving automotive tech and photonic components, requiring continuous innovation.
Q vs INDI Positioning
Q pursues a diversified approach in semiconductor materials supporting chip manufacturing, benefiting from scale and stable profitability. INDI concentrates on automotive semiconductors and software, facing higher volatility and technological challenges, reflecting narrower but specialized market focus.
Which has the best competitive advantage?
Q holds a neutral moat with stable profitability and no value destruction, while INDI shows a very unfavorable moat with declining ROIC and value destruction, indicating Q currently has the stronger competitive advantage.
Stock Comparison
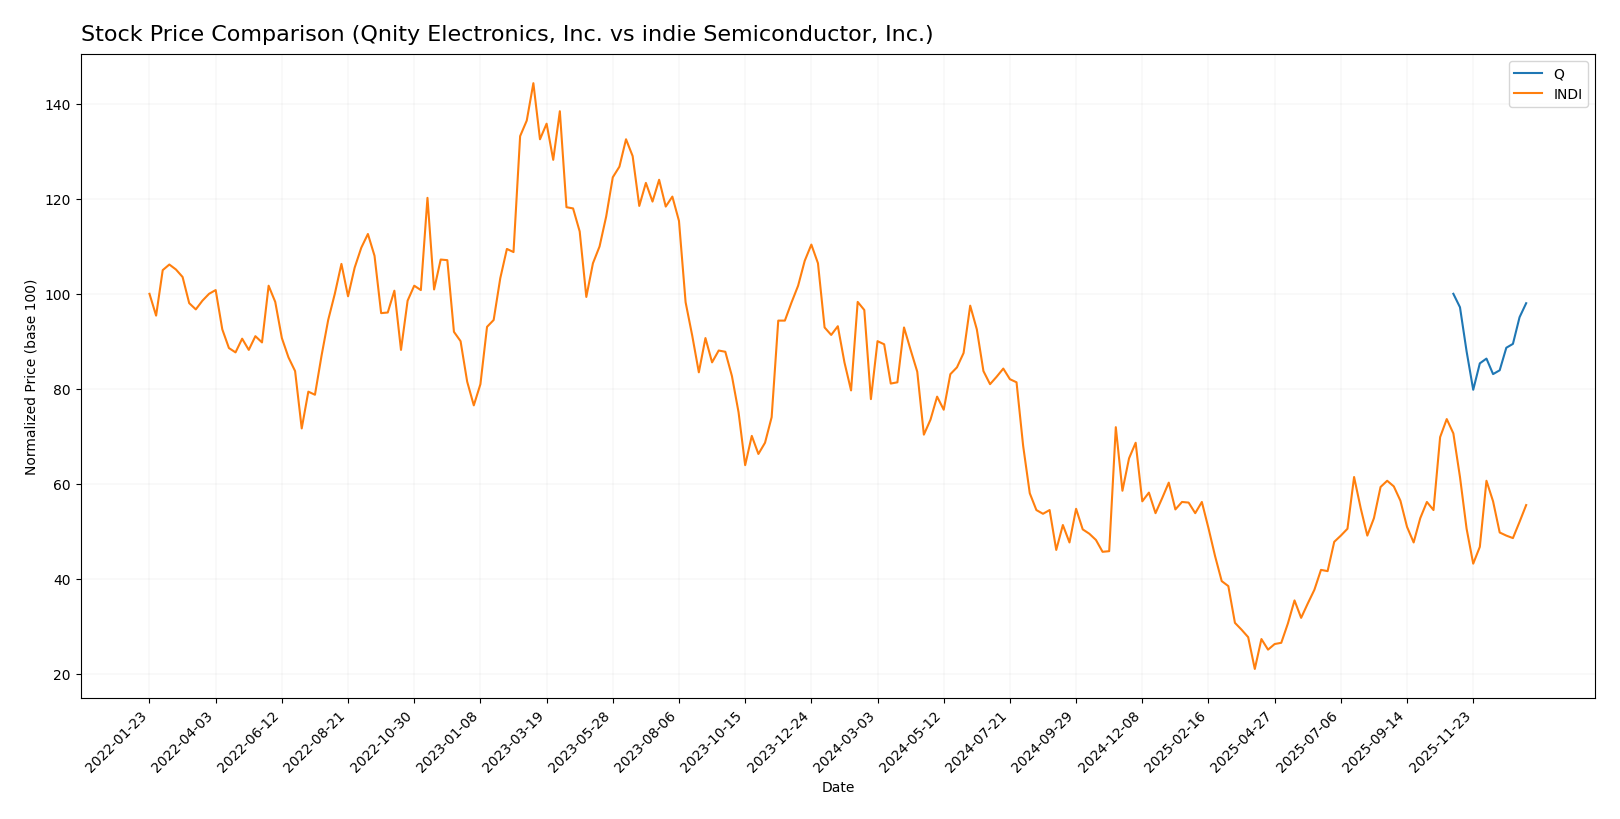
The past 12 months reveal contrasting stock price dynamics for Qnity Electronics, Inc. and indie Semiconductor, Inc., with both showing bearish trends but differing volatility and recent trading behaviors.
Trend Analysis
Qnity Electronics, Inc. experienced a slight bearish trend over the past year, with a price decline of 1.98%. The trend remained stable, reaching a high of 95.0 and a low of 75.8, supported by moderate volatility (std deviation 5.94).
indie Semiconductor, Inc. showed a pronounced bearish trend with a 28.67% price decrease over the same period. The trend decelerated and volatility was low (std deviation 1.35), with prices ranging from 7.43 to 1.6.
Comparatively, Qnity Electronics, Inc. delivered a significantly better market performance than indie Semiconductor, Inc., with a far smaller loss and greater price stability over the past year.
Target Prices
The current analyst consensus presents a clear outlook for Qnity Electronics, Inc. and indie Semiconductor, Inc.
| Company | Target High | Target Low | Consensus |
|---|---|---|---|
| Qnity Electronics, Inc. | 117 | 92 | 105.89 |
| indie Semiconductor, Inc. | 8 | 8 | 8 |
Analysts expect Qnity Electronics’ stock to trade above its current price of 93.12 USD, signaling moderate upside potential. indie Semiconductor’s target of 8 USD also indicates a significant price increase from its current 4.23 USD.
Analyst Opinions Comparison
This section compares analysts’ ratings and grades for Qnity Electronics, Inc. (Q) and indie Semiconductor, Inc. (INDI):
Rating Comparison
Q Rating
- Rating: B+ indicating a very favorable overall rating.
- Discounted Cash Flow Score: 4, a favorable score showing good valuation prospects.
- ROE Score: 3, moderate efficiency in generating profit from equity.
- ROA Score: 4, favorable asset utilization to generate earnings.
- Debt To Equity Score: 3, moderate financial risk and balance sheet strength.
- Overall Score: 3, moderate overall financial standing.
INDI Rating
- Rating: C- with a very unfavorable overall rating.
- Discounted Cash Flow Score: 1, very unfavorable, suggesting poor valuation.
- ROE Score: 1, very unfavorable, indicating low profit generation from equity.
- ROA Score: 1, very unfavorable, showing poor asset utilization.
- Debt To Equity Score: 1, very unfavorable, implying higher financial risk.
- Overall Score: 1, very unfavorable overall financial standing.
Which one is the best rated?
Based strictly on the data, Q has significantly better ratings and financial scores than INDI across all key metrics, indicating stronger financial health and valuation compared to INDI’s very unfavorable scores.
Scores Comparison
This section compares the financial health scores of Qnity Electronics, Inc. and indie Semiconductor, Inc.:
Q Scores
- Altman Z-Score: Not available for Qnity Electronics.
- Piotroski Score: Not available for Qnity Electronics.
INDI Scores
- Altman Z-Score: 0.12, indicating financial distress and high bankruptcy risk.
- Piotroski Score: 2, categorized as very weak financial strength.
Which company has the best scores?
Only indie Semiconductor, Inc. has score data available, showing a distressed Altman Z-Score and very weak Piotroski Score. Qnity Electronics lacks score information, so no direct comparison can be made based on the data provided.
Grades Comparison
The following presents a comparison of the available grades for Qnity Electronics, Inc. and indie Semiconductor, Inc.:
Qnity Electronics, Inc. Grades
This table summarizes recent grades issued by recognized financial institutions for Qnity Electronics, Inc.:
| Grading Company | Action | New Grade | Date |
|---|---|---|---|
| RBC Capital | Maintain | Outperform | 2025-11-25 |
| Mizuho | Maintain | Outperform | 2025-11-20 |
Qnity Electronics, Inc. has consistently received an “Outperform” grade, indicating positive analyst sentiment and confidence in future performance.
indie Semiconductor, Inc. Grades
This table summarizes recent grades issued by recognized financial institutions for indie Semiconductor, Inc.:
| Grading Company | Action | New Grade | Date |
|---|---|---|---|
| UBS | Maintain | Neutral | 2025-11-10 |
| Benchmark | Maintain | Buy | 2025-06-25 |
| Benchmark | Maintain | Buy | 2025-06-11 |
| Benchmark | Maintain | Buy | 2025-05-21 |
| Benchmark | Maintain | Buy | 2025-05-13 |
| Craig-Hallum | Maintain | Buy | 2025-05-13 |
| Keybanc | Maintain | Overweight | 2025-05-13 |
| Benchmark | Maintain | Buy | 2025-04-09 |
| Benchmark | Maintain | Buy | 2025-02-21 |
| Keybanc | Maintain | Overweight | 2025-02-21 |
indie Semiconductor, Inc. shows predominantly “Buy” and “Overweight” ratings with a recent “Neutral” from UBS, reflecting generally favorable analyst opinions with some caution.
Which company has the best grades?
Qnity Electronics, Inc. holds a consistent “Outperform” rating from two institutions, while indie Semiconductor, Inc. has a larger number of “Buy” and “Overweight” ratings but includes a recent “Neutral.” Qnity’s grades suggest stronger conviction, potentially signaling more confident growth prospects for investors.
Strengths and Weaknesses
The table below summarizes the key strengths and weaknesses of Qnity Electronics, Inc. (Q) and indie Semiconductor, Inc. (INDI) based on their recent financial and strategic evaluations.
| Criterion | Qnity Electronics, Inc. (Q) | indie Semiconductor, Inc. (INDI) |
|---|---|---|
| Diversification | Moderate diversification with stable segments | Focused primarily on semiconductor products; limited diversification |
| Profitability | Moderate profitability; net margin at 16%, ROIC slightly above WACC, creating slight value | Negative profitability; net margin -61%, ROIC well below WACC, destroying value |
| Innovation | Stable innovation with consistent asset turnover (neutral) | Some innovation reflected in fixed asset turnover, but overall declining profitability |
| Global presence | Established global presence with stable financial ratios | Smaller global footprint with weaker financial metrics and declining ROIC |
| Market Share | Moderate market share with stable revenue streams | Growing product revenues but overshadowed by large losses and declining service revenues |
In summary, Qnity Electronics shows a more stable financial and operational profile with slight value creation and moderate profitability, while indie Semiconductor struggles with declining profitability and value destruction despite some growth in product revenue. Caution is advised when considering INDI due to its unfavorable financial trends.
Risk Analysis
Below is a comparative risk assessment table for Qnity Electronics, Inc. (Q) and indie Semiconductor, Inc. (INDI) based on the most recent data from 2024 and market conditions in 2026:
| Metric | Qnity Electronics, Inc. (Q) | indie Semiconductor, Inc. (INDI) |
|---|---|---|
| Market Risk | Moderate (Beta 0, stable range 70.5-105.4) | High (Beta 2.54, volatile range 1.53-6.05) |
| Debt Level | Very Low (Debt-to-Equity 0.02, Debt to Assets 1.56%) | Moderate to High (Debt-to-Equity 0.95, Debt to Assets 42.34%) |
| Regulatory Risk | Moderate (US-based, semiconductor industry regulations) | Moderate (US-based, automotive semiconductor focus with evolving regulations) |
| Operational Risk | Moderate (Newly rebranded, stable but limited operating history) | High (Negative margins and ROE indicate operational challenges) |
| Environmental Risk | Low (Focus on electronic materials with limited environmental impact) | Moderate (Automotive sector faces increasing environmental standards) |
| Geopolitical Risk | Moderate (US market exposure, global supply chain dependencies) | Moderate to High (Automotive semiconductor supply chain vulnerable to geopolitical tensions) |
In synthesis, indie Semiconductor (INDI) shows the most significant risks, notably high market volatility, elevated debt levels, operational inefficiencies, and financial distress signals with an Altman Z-score in the distress zone and a very weak Piotroski score. Qnity Electronics (Q) presents lower financial and market risks, supported by a favorable debt profile and more stable market behavior, although still exposed to semiconductor industry regulatory and geopolitical challenges. Investors should weigh INDI’s high risk against potential growth, while Q appears a safer, more moderate risk option.
Which Stock to Choose?
Qnity Electronics, Inc. shows a stable income evolution with favorable gross and EBIT margins, supported by a slightly favorable global income statement and financial ratios evaluation. The company has low debt levels, a moderate ROE of 6.5%, and a very favorable B+ rating, indicating solid financial health despite a neutral moat status.
indie Semiconductor, Inc. exhibits a challenging income evolution marked by negative net margins and unfavorable profitability ratios, with a very unfavorable global ratios evaluation and a C- rating. The company carries higher debt and shows declining profitability with a very unfavorable moat, reflecting ongoing financial distress and operational inefficiencies.
For investors, Qnity Electronics might appear more suitable for those prioritizing stability and moderate growth given its favorable rating and income metrics. Conversely, indie Semiconductor could be of interest to risk-tolerant investors seeking potential turnaround opportunities despite current financial weaknesses and unfavorable ratios.
Disclaimer: Investment carries a risk of loss of initial capital. The past performance is not a reliable indicator of future results. Be sure to understand risks before making an investment decision.
Go Further
I encourage you to read the complete analyses of Qnity Electronics, Inc. and indie Semiconductor, Inc. to enhance your investment decisions: